


- Protocols

- Articles and Issues
- For Authors
- About
- Become a Reviewer


An In Vitro Model to Study Drugs That Affect Macrophage Adhesion to Murine Brain Endothelial Cells After Proinflammatory Insults of LPS and Pilocarpine

Published: Vol 16, Iss 18, Sep 20, 2026 DOI: 10.21769/BioProtoc.5825 Views: 529
Reviewed by: Sébastien GillotinManasa VL ChanduriAnonymous reviewer(s)
 PDF
PDF  Ask a question

Protocol Collections
Comprehensive collections of detailed, peer-reviewed protocols focusing on specific topics




Related protocols
Abstract
Neuroinflammation disrupts blood–brain barrier (BBB) integrity, promoting leukocyte recruitment into the central nervous system and contributing to the progression of neurological disorders. This protocol describes a reproducible macrophage adhesion assay to evaluate interactions between immune cells and brain endothelial cells and to screen compounds with potential anti-inflammatory activity. Murine brain endothelial cells (bEnd.3) were cultured to confluency and exposed to inflammatory stimuli, such as lipopolysaccharide (LPS) or pilocarpine, a cholinergic muscarinic receptor agonist reported to induce inflammatory responses through seizure-associated neuroinflammatory mechanisms, in the presence or absence of candidate therapeutic compounds. In these studies, the natural flavonoid quercetin and the synthetic alkyl-lysophospholipid edelfosine were tested for their effects on macrophage adhesion. After 48 h of treatment, fluorescently labeled murine macrophages (RAW 264.7) were added to the endothelial monolayer, and adherent cells were quantified by fluorescence microscopy. The assay was validated using dexamethasone as an anti-inflammatory control and inflammatory stimulation with LPS or pilocarpine. As expected, dexamethasone reduced macrophage adhesion, whereas both LPS and pilocarpine significantly increased adhesion, demonstrating the assay's sensitivity to changes in endothelial inflammatory status. Overall, this protocol provides a reliable and accessible platform for investigating endothelial–immune cell interactions under neuroinflammatory conditions and for evaluating therapeutic compounds that may preserve BBB function and reduce inflammatory cell recruitment in neurological disease models.
Key features
• This protocol creates an in vitro model that simulates the luminal interface of the blood–brain barrier (BBB).
• The protocol accounts for the 48-h interval required for maximal physiological expression of adhesion molecules at the cell surface.
• The protocol quantifies macrophage adhesion to brain endothelial cells following inflammatory stimulation with lipopolysaccharide (LPS) or pilocarpine.
• It enables evaluation of therapeutic candidates for their ability to modulate macrophage–brain endothelial cell adhesion under neuroinflammatory conditions.
Keywords: Endothelial cells Inflammation
Quercetin
Edelfosine
Lipopolysaccharides
Pilocarpine
Macrophages
Blood–brain barrier
Inflammation
Quercetin
Edelfosine
Lipopolysaccharides
Pilocarpine
Macrophages
Blood–brain barrier
Graphical overview
Background
Neuroinflammation is a central pathological process in the progression of neurodegenerative diseases (NDs), including epilepsy, Alzheimer’s disease (AD), Parkinson’s disease (PD), and others [1–3]. These disorders are characterized by chronic activation of the innate immune system within the central nervous system (CNS), involving microglia, astrocytes, and the recruitment of peripheral immune cells [3–5]. While acute inflammatory responses may initially serve protective functions by promoting debris clearance and tissue repair, persistent and dysregulated neuroinflammation contributes to progressive neuronal damage and synaptic dysfunction [6,7]. Blood–brain barrier endothelial cells (BECs) are also disrupted during neuroinflammation through signaling from activated microglia, astrocytes, and infiltrating immune cells [8–10]. Proinflammatory cytokines such as TNF-α, IL-1β, and IL-6, together with reactive oxygen species (ROS), impair endothelial function by disrupting tight junctions, increasing transcellular transport, and promoting enzymatic degradation of the barrier [11–14]. These changes compromise BBB integrity and facilitate additional immune cell infiltration into the central nervous system [13]. These inflammatory signals, together with matrix metalloproteinases (MMPs), compromise the integrity of the blood–brain barrier (BBB) by disrupting tight junction proteins such as occludins and claudins, leading to increased vascular permeability [15,16]. BBB dysfunction further exacerbates neuroinflammation by allowing the infiltration of circulating monocytes and lymphocytes into the brain parenchyma, creating a feed-forward inflammatory cycle [3]. Such immune cell infiltration has been reported across multiple neurodegenerative conditions. In AD, BBB disruption often precedes significant cognitive decline and facilitates the entry of peripheral immune cells and circulating Aβ into the brain [2,6,17]. In temporal lobe epilepsy (TLE), the most prevalent form of epilepsy, BBB disruption is a hallmark pathological feature that contributes to the maintenance of chronic seizures and promotes neuroinflammatory processes [18,19]. BBB dysfunction is often persistent and has been associated with increased seizure frequency, disease severity, and resistance to antiseizure medications [20]. Although infiltrating macrophages can facilitate the clearance of cellular debris and support tissue repair, they also release proinflammatory mediators that may exacerbate neuronal damage and perpetuate neuroinflammation [21,22]. Consequently, therapeutic strategies aimed at preserving BBB integrity and modulating neuroinflammatory responses—including inhibition of matrix metalloproteinase (MMP) activity, suppression of proinflammatory cytokine production, and promotion of reparative immune phenotypes—have emerged as promising approaches to limit disease progression and improve neurological outcomes [23].
Anti-inflammatory compounds that modulate endothelial activation have emerged as promising strategies to protect BBB function [24]. Both natural and synthetic molecules may regulate inflammatory signaling and immune cell interactions at the BBB. For example, a synthetic compound, edelfosine, which targets phospholipase Cβ signaling [25,26], has shown anti-inflammatory effects in BBB endothelial cells exposed to seizure-inducing stimuli such as pilocarpine [27]. Quercetin is a natural anti-inflammatory molecule that has recently been shown to promote neuroprotection by preserving BBB integrity, reducing inflammation and oxidative stress, preventing neuronal death, and enhancing synaptic function [28]. In this context, the present study investigates whether the natural flavonoid quercetin and the synthetic lysophospholipid edelfosine can attenuate macrophage adhesion under proinflammatory conditions.
Macrophage–endothelial adhesion assays are widely used to investigate leukocyte recruitment during inflammation and to evaluate the anti-inflammatory potential of therapeutic compounds. Common approaches include static adhesion assays, flow-based systems, live-cell imaging, and transwell migration assays, each providing complementary information on leukocyte–endothelial interactions [29–31]. Static assays remain the most widely used because they are simple, reproducible, and suitable for quantitative drug screening, although they do not reproduce physiological shear stress or leukocyte rolling. Despite these limitations, static assays remain the preferred approach for initial drug screening because they provide highly reproducible, quantitative measurements under controlled experimental conditions, enabling rapid evaluation of multiple therapeutic candidates before validation in more physiologically complex models. In contrast, flow-based assays better mimic the vascular microenvironment but require specialized equipment and have lower throughput. Confocal imaging provides high-resolution visualization of adhesion dynamics, whereas transwell assays combine adhesion with transmigration but are less suited for quantitative screening [29,32].
Materials and reagents
Biological materials
1. bEnd.3 (ATCC, CRL-2299); organism: Mus musculus (mouse); tissue: brain, cerebral cortex; disease endothelioma; cell type: endothelial cell
2. Raw cell 264.7 (ATCC, TB1-71); organism: Mus musculus (mouse); tissue: ascites; disease: Abelson murine leukemia virus-induced tumor; cell type: macrophage
Reagents
1. Lipopolysaccharide (LPS) (Sigma-Aldrich, catalog number: L2630)
2. Dexamethasone (MedChemExpress, catalog number: HY-14648)
3. Quercetin (MedChemExpress, catalog number: HY-18085)
4. Dimethyl sulfoxide (DMSO) (Santa Cruz Biotechnology, catalog number: sc-358801)
5. Pilocarpine (Sigma-Aldrich, catalog number: P6503)
6. Edelfosine (Sigma-Aldrich, catalog number: SML0332)
7. Dil (1,1′-Dioctadecyl-3,3,3′,3′-tetramethylindocarbocyanine perchlorate) (Thermo Fisher, catalog number: D3911)
8. Sodium bicarbonate (Sigma-Aldrich, catalog number: S5761)
9. Dulbecco’s modified Eagle medium (DMEM) (Thermo Fisher, catalog number: 12800017)
10. Phosphate-buffered saline (PBS) (Sigma-Aldrich, catalog number: P5368-10PAK)
11. Penicillin and streptomycin (Thermo Fisher, catalog number: 15140122)
12. Fetal bovine serum (Gibco, catalog number: A52567-01)
13. GibcoTM trypsin-EDTA (0.25%), phenol red (Fisher Scientific, catalog number: 25-200-072)
14. Formalin solution, neutral buffered, 10% (Sigma-Aldrich, catalog number: HT501128)
15. Trypan Blue solution 0.4% (Millipore-Sigma, catalog number: T8154)
Solutions
1. Edelfosine stock solution, 1 mM (see Recipes)
2. PBS solution (see Recipes)
3. Pilocarpine stock solution, 10 mM (see Recipes)
4. Dexamethasone stock solution, 50 mM (see Recipes)
5. LPS stock solution, 1 mg/mL (see Recipes)
6. Quercetin stock solution, 5 mM (see Recipes)
7. Complete DMEM (see Recipes)
Recipes
1. Edelfosine stock solution, 1 mM
| Reagent | Initial concentration | Quantity or volume | Final working concentration |
|---|---|---|---|
| Edelfosine (523.73 g/mol) | 1 mM | 5.24 mg | 1 μM |
| DMSO | 10 mL | 0.1% |
According to the molecular weight of edelfosine (523.73 g/mol), prepare a stock solution at 1 mM diluted in DMSO. Accurately weigh the edelfosine, dissolve it in DMSO to the desired volume to prepare the standard solution, and mix thoroughly until completely dissolved.
2. PBS solution
| Reagent | Initial concentration | Quantity or volume |
|---|---|---|
| PBS | 1× | 1 packet |
| Deionized water | 1 L |
Following the manufacturer's instructions, add dry powder from the packet to 1 L of deionized water and stir; this will yield PBS 0.01 M, NaCl 0.138 M, KCl 0.0027 M, pH 7.4 at 25 °C. Sterilize by filtration and store at room temperature.
3. Pilocarpine stock solution, 10 mM
| Reagent | Initial concentration | Quantity or volume | Final working concentration |
|---|---|---|---|
| Pilocarpine (208.26 g/mol) | 10 mM | 20.83 mg | 10 μM |
| PBS solution | 1× | 10 mL |
According to the molecular weight of pilocarpine (208.26 g/mol), prepare a stock solution at 10 mM in PBS solution. Accurately weigh the pilocarpine, dissolve it in PBS solution to the desired volume to prepare the standard solution, and mix thoroughly until completely dissolved.
4. Dexamethasone stock solution, 50 mM
| Reagent | Initial concentration | Quantity or volume | Final working concentration |
|---|---|---|---|
| Dexamethasone (392.46 g/mol) | 50 mM | 196.23 mg | 50 μM |
| DMSO | 10 mL | 0.1% |
According to the molecular weight of dexamethasone (392.46 g/mol), prepare a 50 mM stock solution in DMSO. Accurately weigh the dexamethasone, dissolve it in DMSO to the desired volume to prepare the stock solution, and mix thoroughly.
5. LPS stock solution
| Reagent | Initial concentration | Quantity or volume | Final working concentration |
|---|---|---|---|
| LPS | 1 mg/mL | 10 mg | 100 ng/mL |
| PBS solution | 1× | 10 mL |
According to the molecular weight of LPS, prepare a stock solution at 1 mg/mL in PBS. Accurately weigh the LPS and dissolve it in PBS solution to the desired volume to prepare the standard solution.
6. Quercetin stock solution, 5 mM
| Reagent | Initial concentration | Quantity or volume | Final working concentration |
|---|---|---|---|
| Quercetin (302.24 g/mol) | 5 mM | 15.1 mg | 5 μM |
| DMSO | 10 mL | 0.5% |
According to the molecular weight of quercetin (302.23 g/mol), prepare a stock solution at 5 mM diluted in DMSO. Accurately weigh the quercetin, dissolve it in DMSO to the desired volume to prepare the standard solution.
7. Complete DMEM
| Reagent | Initial concentration | Quantity or volume | Final working concentration |
|---|---|---|---|
| DMEM | 445 mL | ||
| FBS | 50 mL | 10% | |
| Penicillin-streptomycin | 100× | 5 mL | 1% |
| Sodium bicarbonate | 1.85 g |
Laboratory supplies
1. 25 cm2 cell culture flasks (Corning, catalog number: 430639)
2. 75 cm2 cell culture flasks (Corning, catalog number: 430641U)
3. VWR tissue culture plate (24-well plate) (VWR, catalog number: 10861-558)
4. 2 mL serological pipettes (Fisherbrand, catalog number: 15604009)
5. 5 mL serological pipettes (Costar Stripette, catalog number: 13625005)
6. 10 mL serological pipettes (Costar Stripette, catalog number: 12825057)
7. 1.5 mL microtubes (Thermo Scientific, catalog number: 02-682-002)
8. 15 mL NuncTM conical sterile polypropylene centrifuge tubes (Thermo Scientific, catalog number: 339650)
9. 50 mL NuncTM conical sterile polypropylene centrifuge tubes (Thermo Scientific, catalog number: 339652)
10. 2 mL sterile cryovials (Greiner Bio-One, catalog number: 5612-6263)
11. P-10 micropipette (Eppendorf, catalog number: 3123000020)
Equipment
1. Class 2 Biosafety Cabinet (purifier biological safety cabinet) (Labconco, model: Logic/3440809)
2. SureTherm 180 CO2 incubator (Benchmark Scientific, catalog number: H3565-180)
3. Brightfield microscope (Nikon, model: Eclipse Ts2)
4. Water bath (Four E’S Scientific, model: WB201)
5. Haier Ultra Low Temperature (ULT) Freezer (Qingdao Haier Biomedical, model: DW-86L578J)
6. HERMLE benchtop centrifuge (Benchmark Scientific, model: Z327-K)
7. Keyence fluorescence microscope (Keyence, model: BZ-X700)
Software and datasets
1. ImageJ [developed by Wayne Rasband at the U.S. National Institutes of Health (NIH), version: Fiji]
2. GraphPad (GraphPad Software, Inc., version: 10)
Procedure
A. Culturing of murine brain endothelial cells (bEnd.3) and murine macrophage cells (RAW 264.7)
1. Thaw the frozen cryovial by gently agitating it in a 37 °C water bath until the contents are fully thawed (observe while it is thawing; remember that DMSO at 5% is toxic).
Notes:
1. Keep the vial cap and O-ring above the water level to reduce the risk of contamination.
2. Perform thawing rapidly to maintain cell viability.
2. Remove the cryovial from the water bath immediately upon completion of thawing and disinfect the exterior by spraying it with 70% ethanol.
Note: From this step onward, conduct all manipulations under strictly aseptic conditions inside a cell culture hood.
3. Transfer the cell suspension from the vial into a sterile centrifuge tube containing 9 mL of complete DMEM.
4. Centrifuge at 240× g for 5 min to pellet the cells and remove the cryoprotectant (DMSO).
5. Carefully discard the supernatant and gently resuspend the cell pellet in the recommended complete DMEM.
Note: Remove the cryoprotective agent immediately after thawing to reduce cytotoxic effects.
6. Transfer the resuspended cells into a tissue culture flask of 25 cm2.
Notes:
1. Before cell addition, place the culture flask containing complete DMEM in the incubator for 10 min to allow the temperature to reach 37 °C and stabilize the pH.
2. The recommended seeding density for RAW 264.7 is 5 × 10⁴ viable cells/cm2.
3. The recommended seeding density for bEnd.3 cells is 3 × 10⁴ viable cells/cm2.
7. Incubate the cells at 37 °C in a humidified incubator with 5% CO2.
8. Maintain the culture under these conditions until the cells reach an appropriate confluency.
Notes:
1. Confluency of bEnd.3: 100% (reached at 72 h).
2. Confluency of RAW 264.7: 80%–90% (reached at 48–72 h).
See Troubleshooting if RAW 264.7 cells reach confluency above 90%.
B. Trypsinization of bEnd.3 cells
1. Remove the medium from the T-75 flask in which bEnd.3 cells were cultured.
2. Wash three times with 5 mL of PBS solution.
3. Add 3 mL of 0.25% trypsin to detach the cells from the bottom of the flask.
4. Incubate for 3–5 min at 37 °C in the incubator with 5% CO2.
5. Neutralize/inactivate the trypsinization by adding 6 mL of complete DMEM.
6. With a 10 mL pipette, collect the cells and transfer the entire volume (9 mL) to a sterile 15 mL tube.
Note: If cells remain in the flask, add 3 mL of complete DMEM and gently scrape.
7. Centrifuge at 240× g for 5 min.
8. Discard the medium and resuspend the resulting cell pellet in 2 mL of complete DMEM.
C. Quantification and subculturing of bEnd.3 cells
1. Transfer 20 μL of the endothelial cell suspension to a 1.5 mL microcentrifuge tube and mix with 20 μL of Trypan Blue solution (1:1, v/v). Mix gently before proceeding with cell counting.
2. Using a P-10 micropipette, transfer 10 μL of this mixture to count the cells using the preferred cell counting method, by hemocytometer or an automated cell counter. Using a P-10 micropipette, transfer 10 μL of this mixture to either side of the hemocytometer.
3. Place the hemocytometer on the light microscope and count the number of cells in each quadrant.
Note: If there are more cells in the quadrants and you feel overwhelmed, dilute the cells to achieve more precise counting. Remember to correct the final number by the dilution factor.
4. Sum the number of bEnd.3 cells in each quadrant and divide by four to obtain an average .
5. Apply that average to the following formula:
Note: The number of bEnd.3 cells needed for the experiment is 50,000 cells per well (50 × 103 cells/well). Alternatively, use an automated cell counter following the manufacturer's protocol.
6. Transfer 1 mL of complete DMEM containing 50,000 cells to each well in the 24-well plate.
7. Transfer the volume of cells computed (see step C6) to each well.
Note: When transferring, do so drop by drop throughout the entire circumference of the well to ensure proper distribution of the cells.
See Troubleshooting to avoid unsuitable pipetting during the seeding process in the 24-well plate.
8. Verify the microplate under a light microscope for cell quality (they should be round and birefringent). Incubate it at 37 °C with 5% CO2.
9. Monitor cell growth until a uniform cell monolayer covers the entire well (which takes 48 h to grow confluent).
Note: A monolayer of uniform cells covering the entire well is crucial for uniform macrophage adhesion (Figure 1).
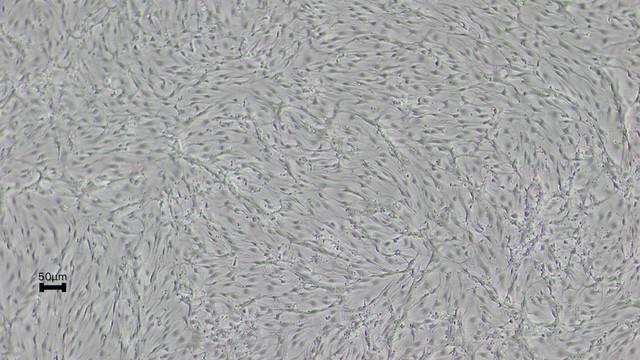
Figure 1. Monolayer of brain endothelial cells (bEnd. 3) under the microscope using 10× magnification. Brightfield micrograph of a confluent monolayer of bEnd.3 cells (mouse brain endothelial cell line). The cells exhibit a characteristic elongated, spindle-shaped morphology and are confluent. Individual cells display tapered ends and thin cytoplasmic extensions, consistent with endothelial cells in an adherent growth state. The distribution of cells is homogeneous, with minimal intercellular spacing, indicating a high level of confluency. The image is presented in grayscale with uniform illumination. Scale bar: 50 μm.
D. Addition of treatment to bEnd.3 monolayers
1. Ensure that a monolayer of uniform BBB endothelial cells covers the entire well.
Notes:
1. Once uniformity is achieved, endothelial cells will be exposed to different treatments to study their effects on macrophage adhesion.
2. The conditions to test are: inflammatory stimuli, inflammatory stimuli plus dexamethasone, experimental drugs alone, and experimental drugs plus inflammatory stimuli, followed by a 48-h incubation to induce endothelial activation.
2. Prepare the treatments freshly according to the required concentrations.
Note: This protocol requires treatments to be freshly prepared at the time of use to ensure accurate, reliable results.
3. Carefully remove the complete medium from each well.
4. Add 1 mL of fresh complete DMEM containing the corresponding treatments.
Note: Experimental groups included:
a. Vehicle controls: Consisted of DMSO or PBS, depending on the solvent used for each compound. Maintain the same final vehicle concentration across all treated wells within an experiment. If compounds are dissolved in different solvents, include separate vehicle controls for each solvent and compare each treatment with its corresponding vehicle control. Alternatively, add the same final concentration of all vehicles to every treatment group, allowing all experimental groups to be compared with a single common vehicle control.
b. Anti-inflammatory control: dexamethasone at 50 μM.
c. Proinflammatory stimulus: pilocarpine and LPS at 10 μM and 100 ng/mL, respectively.
d. Experimental compounds: quercetin and edelfosine at 5 μM and 1 μM, respectively.
e. Combination treatments when applicable (e.g., inflammatory stimulus + experimental drugs).
5. Incubate the endothelial cells with treatments for 48 h at 37 °C in a humidified incubator with 5% CO2.
Note: Our 48-h interval is based on the time required for the maximum physiological expression of adhesion molecules on the cell surface to occur [42–43].
6. After the 48-h treatment period, examine endothelial cells under a light microscope to confirm the monolayer is confluent before proceeding with the macrophage adhesion assay.
Notes:
1. Two independent macrophage adhesion assays were performed, each with its own experimental design and corresponding vehicle controls:
a. LPS/quercetin assay: All compounds were analyzed relative to a common DMSO vehicle control, with the final DMSO concentration standardized across all treatment groups. The final DMSO concentration was maintained at 0.5% in every well, including the vehicle, LPS, quercetin, LPS + quercetin, dexamethasone, and LPS + dexamethasone groups. Although the dexamethasone stock solution contributed only 0.1% DMSO, additional DMSO was added to achieve the same final concentration (0.5%) in all wells. This ensured that any observed differences resulted from the treatment rather than from variations in vehicle concentration (Figure 2).
b. Pilocarpine/edelfosine assay: Because the compounds were prepared in different solvents, separate vehicle controls were included for each solvent. Edelfosine and dexamethasone (prepared in DMSO) were analyzed relative to a 0.1% DMSO vehicle control. Macrophage adhesion did not differ significantly between the DMSO and PBS vehicle controls. Therefore, each treatment was compared with its corresponding vehicle control, ensuring that the effects reflected the experimental compounds rather than their respective solvents.
2. In our pilocarpine/edelfosine assays, initial validation experiments demonstrated that the two vehicle controls (DMSO and PBS) did not differ significantly in their effects on macrophage adhesion (Figure 3, lower right panel). Since both vehicles produced indistinguishable baseline responses, they were considered functionally equivalent. Consequently, a single vehicle control (DMSO) was used as the reference for statistical analyses, thereby avoiding redundant comparisons while maintaining a valid baseline for all treatment groups. This strategy does not affect the interpretation of the results, as the lack of differences between the vehicles confirms that the observed treatment effects are independent of the solvent. Nevertheless, for future applications of this protocol, inclusion of a vehicle-matched pilocarpine + 0.1% DMSO control is recommended.
E. Trypsinization of RAW 264.7 cells
1. Remove the medium from the T-75 flask in which RAW 264.7 cells were cultured.
2. Wash three times with 5 mL of PBS solution.
3. Add 3 mL of 0.25% trypsin to detach the cells from the bottom of the T-75 flask.
4. Incubate for 5 min in the incubator at 37 °C with 5% CO2.
5. Neutralize/inactivate the trypsinization by adding 6 mL of complete DMEM medium.
6. With a 10 mL pipette, collect the cells and transfer the entire volume (9 mL) to a sterile 15 mL tube.
7. Centrifuge at 240× g for 5 min.
8. Discard the medium and resuspend the resulting cell pellet in 6 mL of serum- and antibiotic-free DMEM.
Critical: The absence of serum is crucial to prevent excessive macrophage adhesion to the endothelial monolayer.
9. For quantification, repeat the same process as in steps C1–5.
Note: The number of macrophages needed for the experiment is 1 million cells per well (1 × 10⁶ cells/well).
F. RAW 264.7 cell staining using a liposoluble dye
1. Divide the 6 mL into two 15 mL tubes, 3 mL in each.
Note: The purpose of adding a 6 mL volume containing the RAW 264.7 cells is to divide the volume equally between two sterile tubes to ensure uniform macrophage staining.
2. Centrifuge each tube at 240× g for 5 min.
3. Discard the medium and add 8 mL of serum-free medium to prepare eight wells (8 × 10⁶ cells).
Note: This depends on the number of treatments and controls. Remember that it should be 1 × 10⁶ cells per well.
4. Add 40 μL (5 μL/mL/1 × 106 cells) of Dil fluorescent cell membrane stain to each tube.
5. Incubate the tubes for 1 h at 37 °C in the incubator and gently shake them by hand up and down every 5 min (to ensure uniform staining) until the incubation period is complete.
6. Centrifuge the tubes at 240× g for 5 min.
7. Remove the medium, wash with 5 mL of serum-free medium, and centrifuge again using the same specifications. Repeat this step twice.
8. Remove the medium and resuspend the final cell pellet in 8 mL (1 mL per 1 million cells) of serum-free medium.
Note: The final resuspension volume of 8 mL may vary depending on the number of wells, always considering the number of RAW 264.7 cells available after quantification and the number of RAW 264.7 cells required per well (1 × 10⁶ cells/well).
G. Macrophage adhesion assay
1. Remove the serum medium from each well containing the bEnd.3 endothelial cell monolayer.
2. Wash the bEnd.3 wells with 1 mL of serum-free medium twice.
See Troubleshooting to avoid residual presence of serum in bEnd.3.
3. Transfer 1 mL of labeled macrophages into each bEnd.3 well (1 million cells).
See Troubleshooting to avoid unsuitable pipetting during the addition of RAW 264.7 cells to bEnd.3 monolayers.
4. Incubate the coculture at 37 °C for 1 h.
5. Carefully remove the medium and wash each well three times with 1 mL of serum-free medium.
Note: Washing should be performed gently by adding the media along the wall of the well, always from the same side, to minimize disturbance of the adherent cells.
6. Remove the serum-free medium and add 500 μL of 10% formalin per well.
7. Incubate the plate at 4 °C for 20 min.
8. After fixation, wash the wells twice with 1 mL of PBS solution to remove residual fixative. The cells should be maintained in PBS.
9. Obtain images using confocal microscopy. Images should be taken as soon as possible to avoid lateral diffusion of Dil dye.
10. To obtain reliable results, obtain one picture from the central area of each well, using a 10× objective.
Note: The central area of the well is preferred for imaging because the surrounding cells could be removed by the washing steps.
11. Replicate each condition at least three times per experiment. Combine data from at least three different experiments.
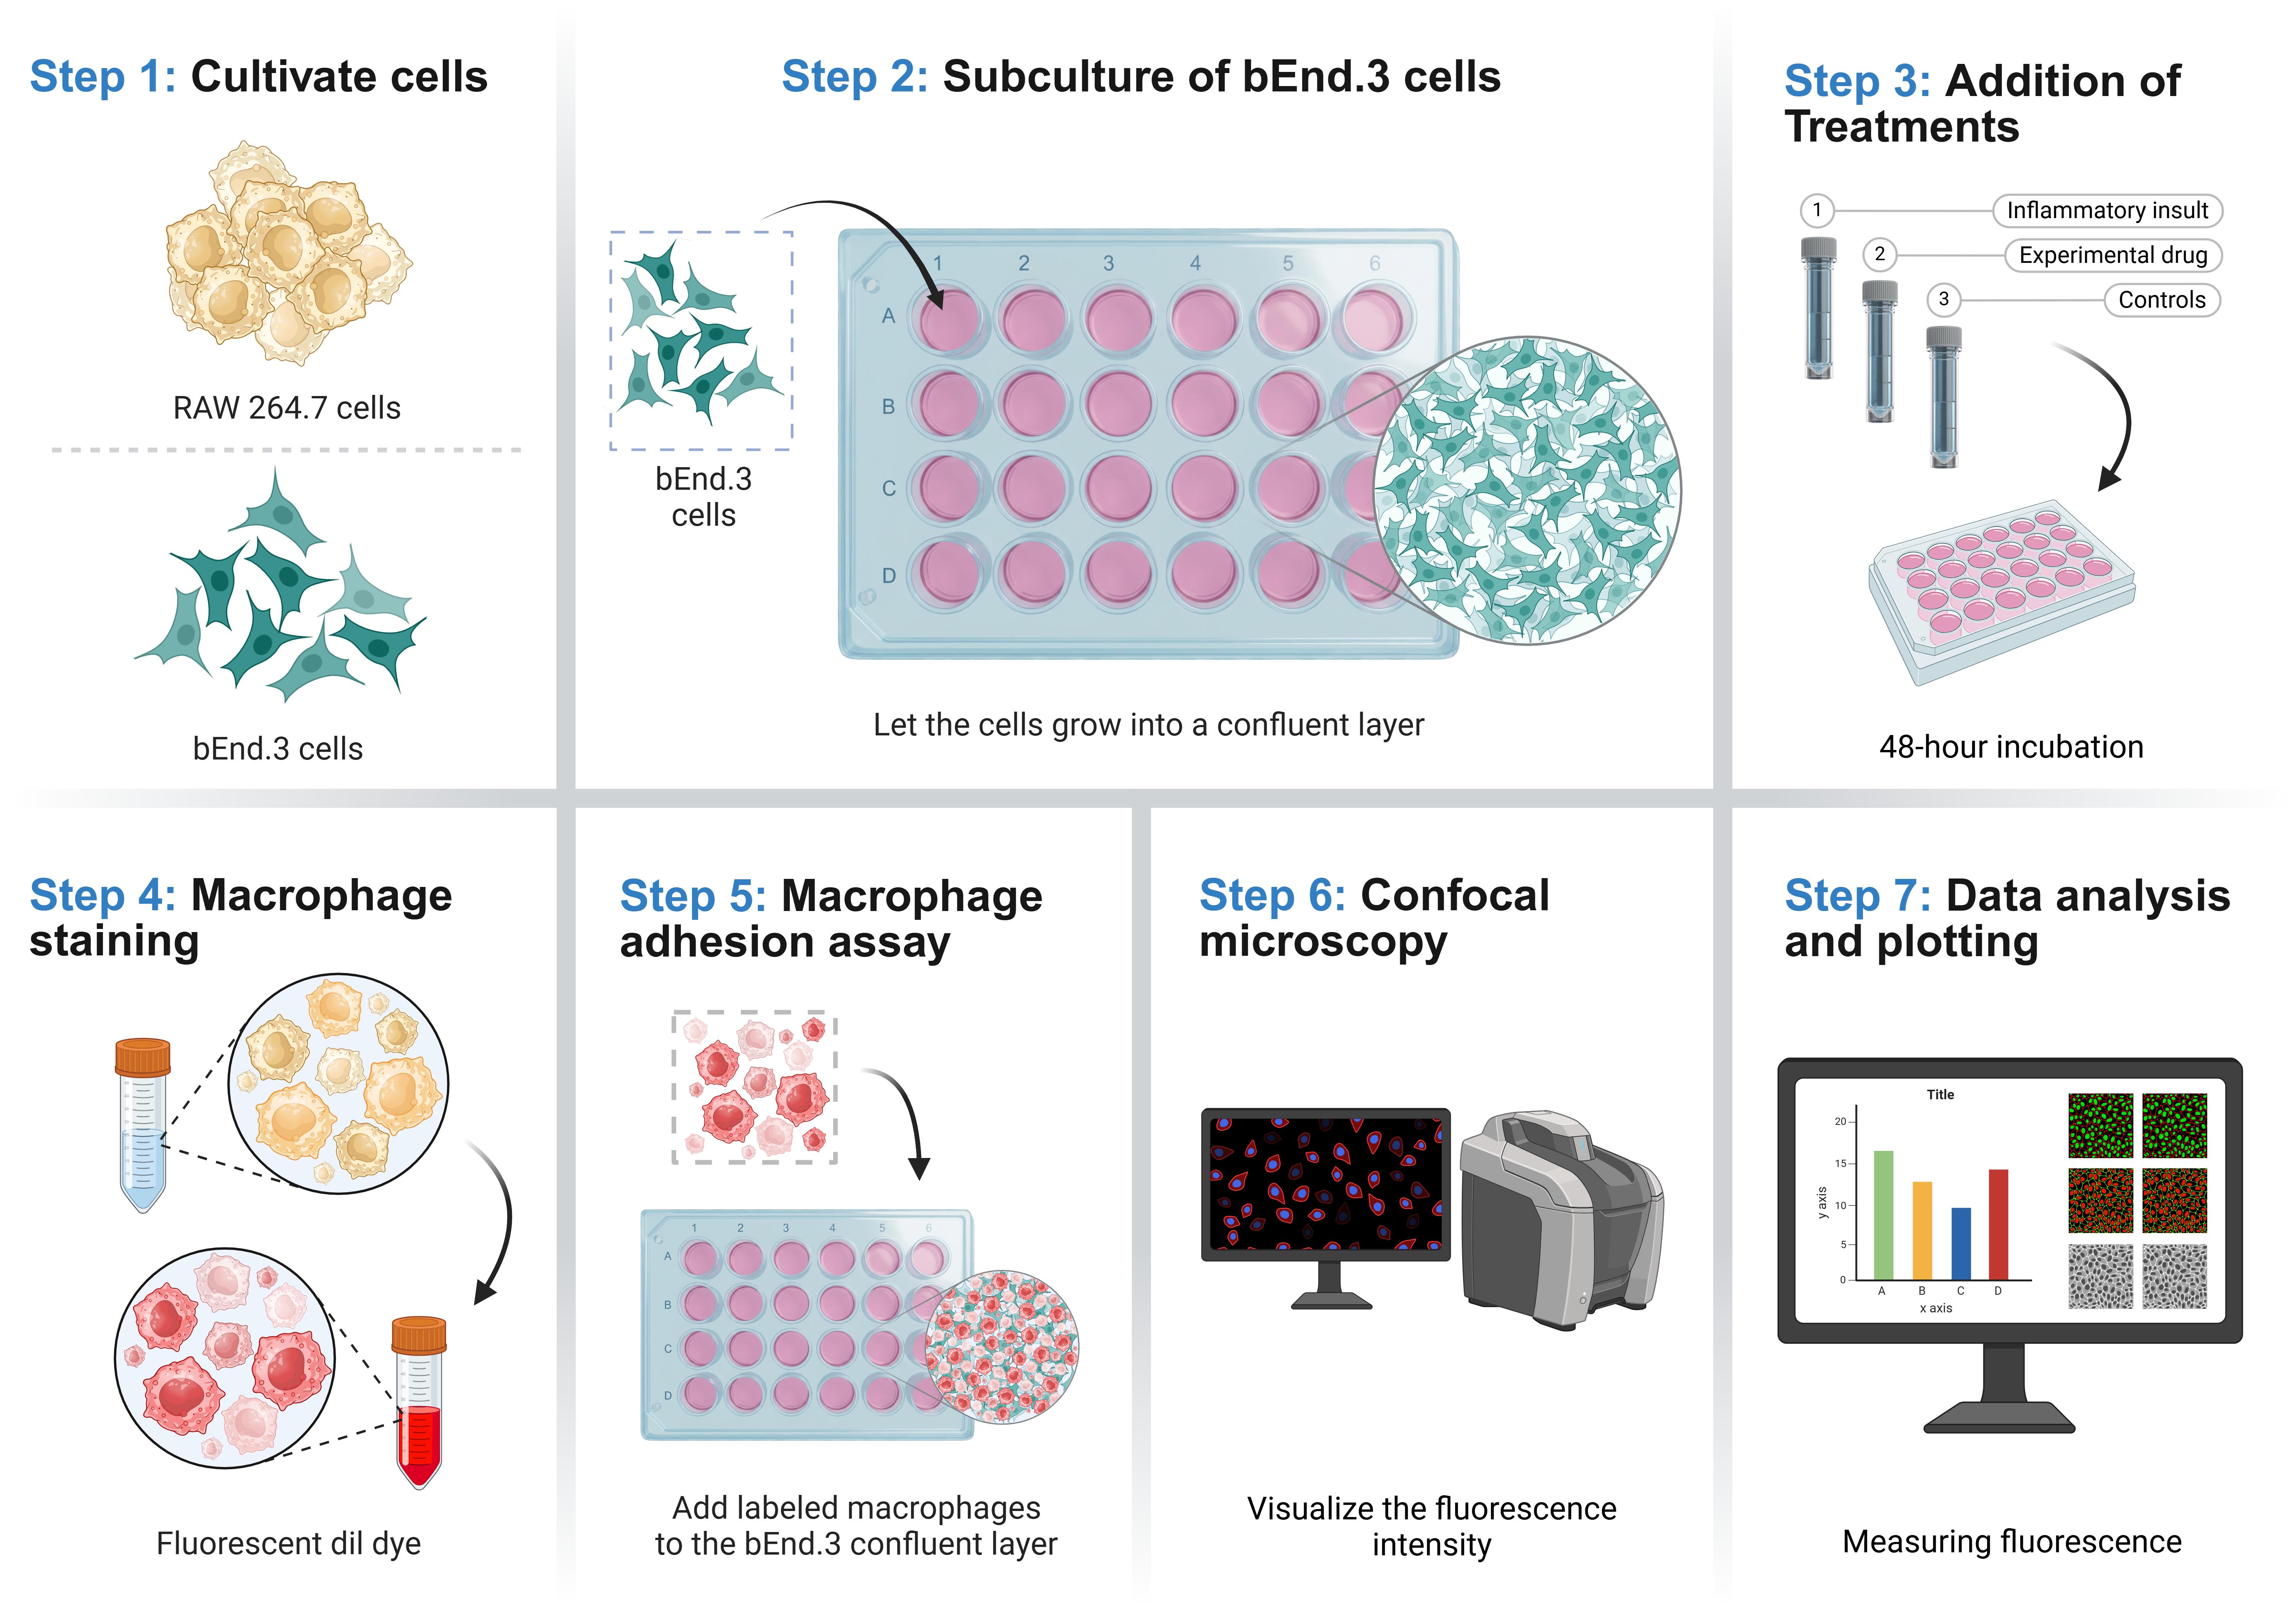
Note: A summary of the entire procedure is shown in the Graphical overview.
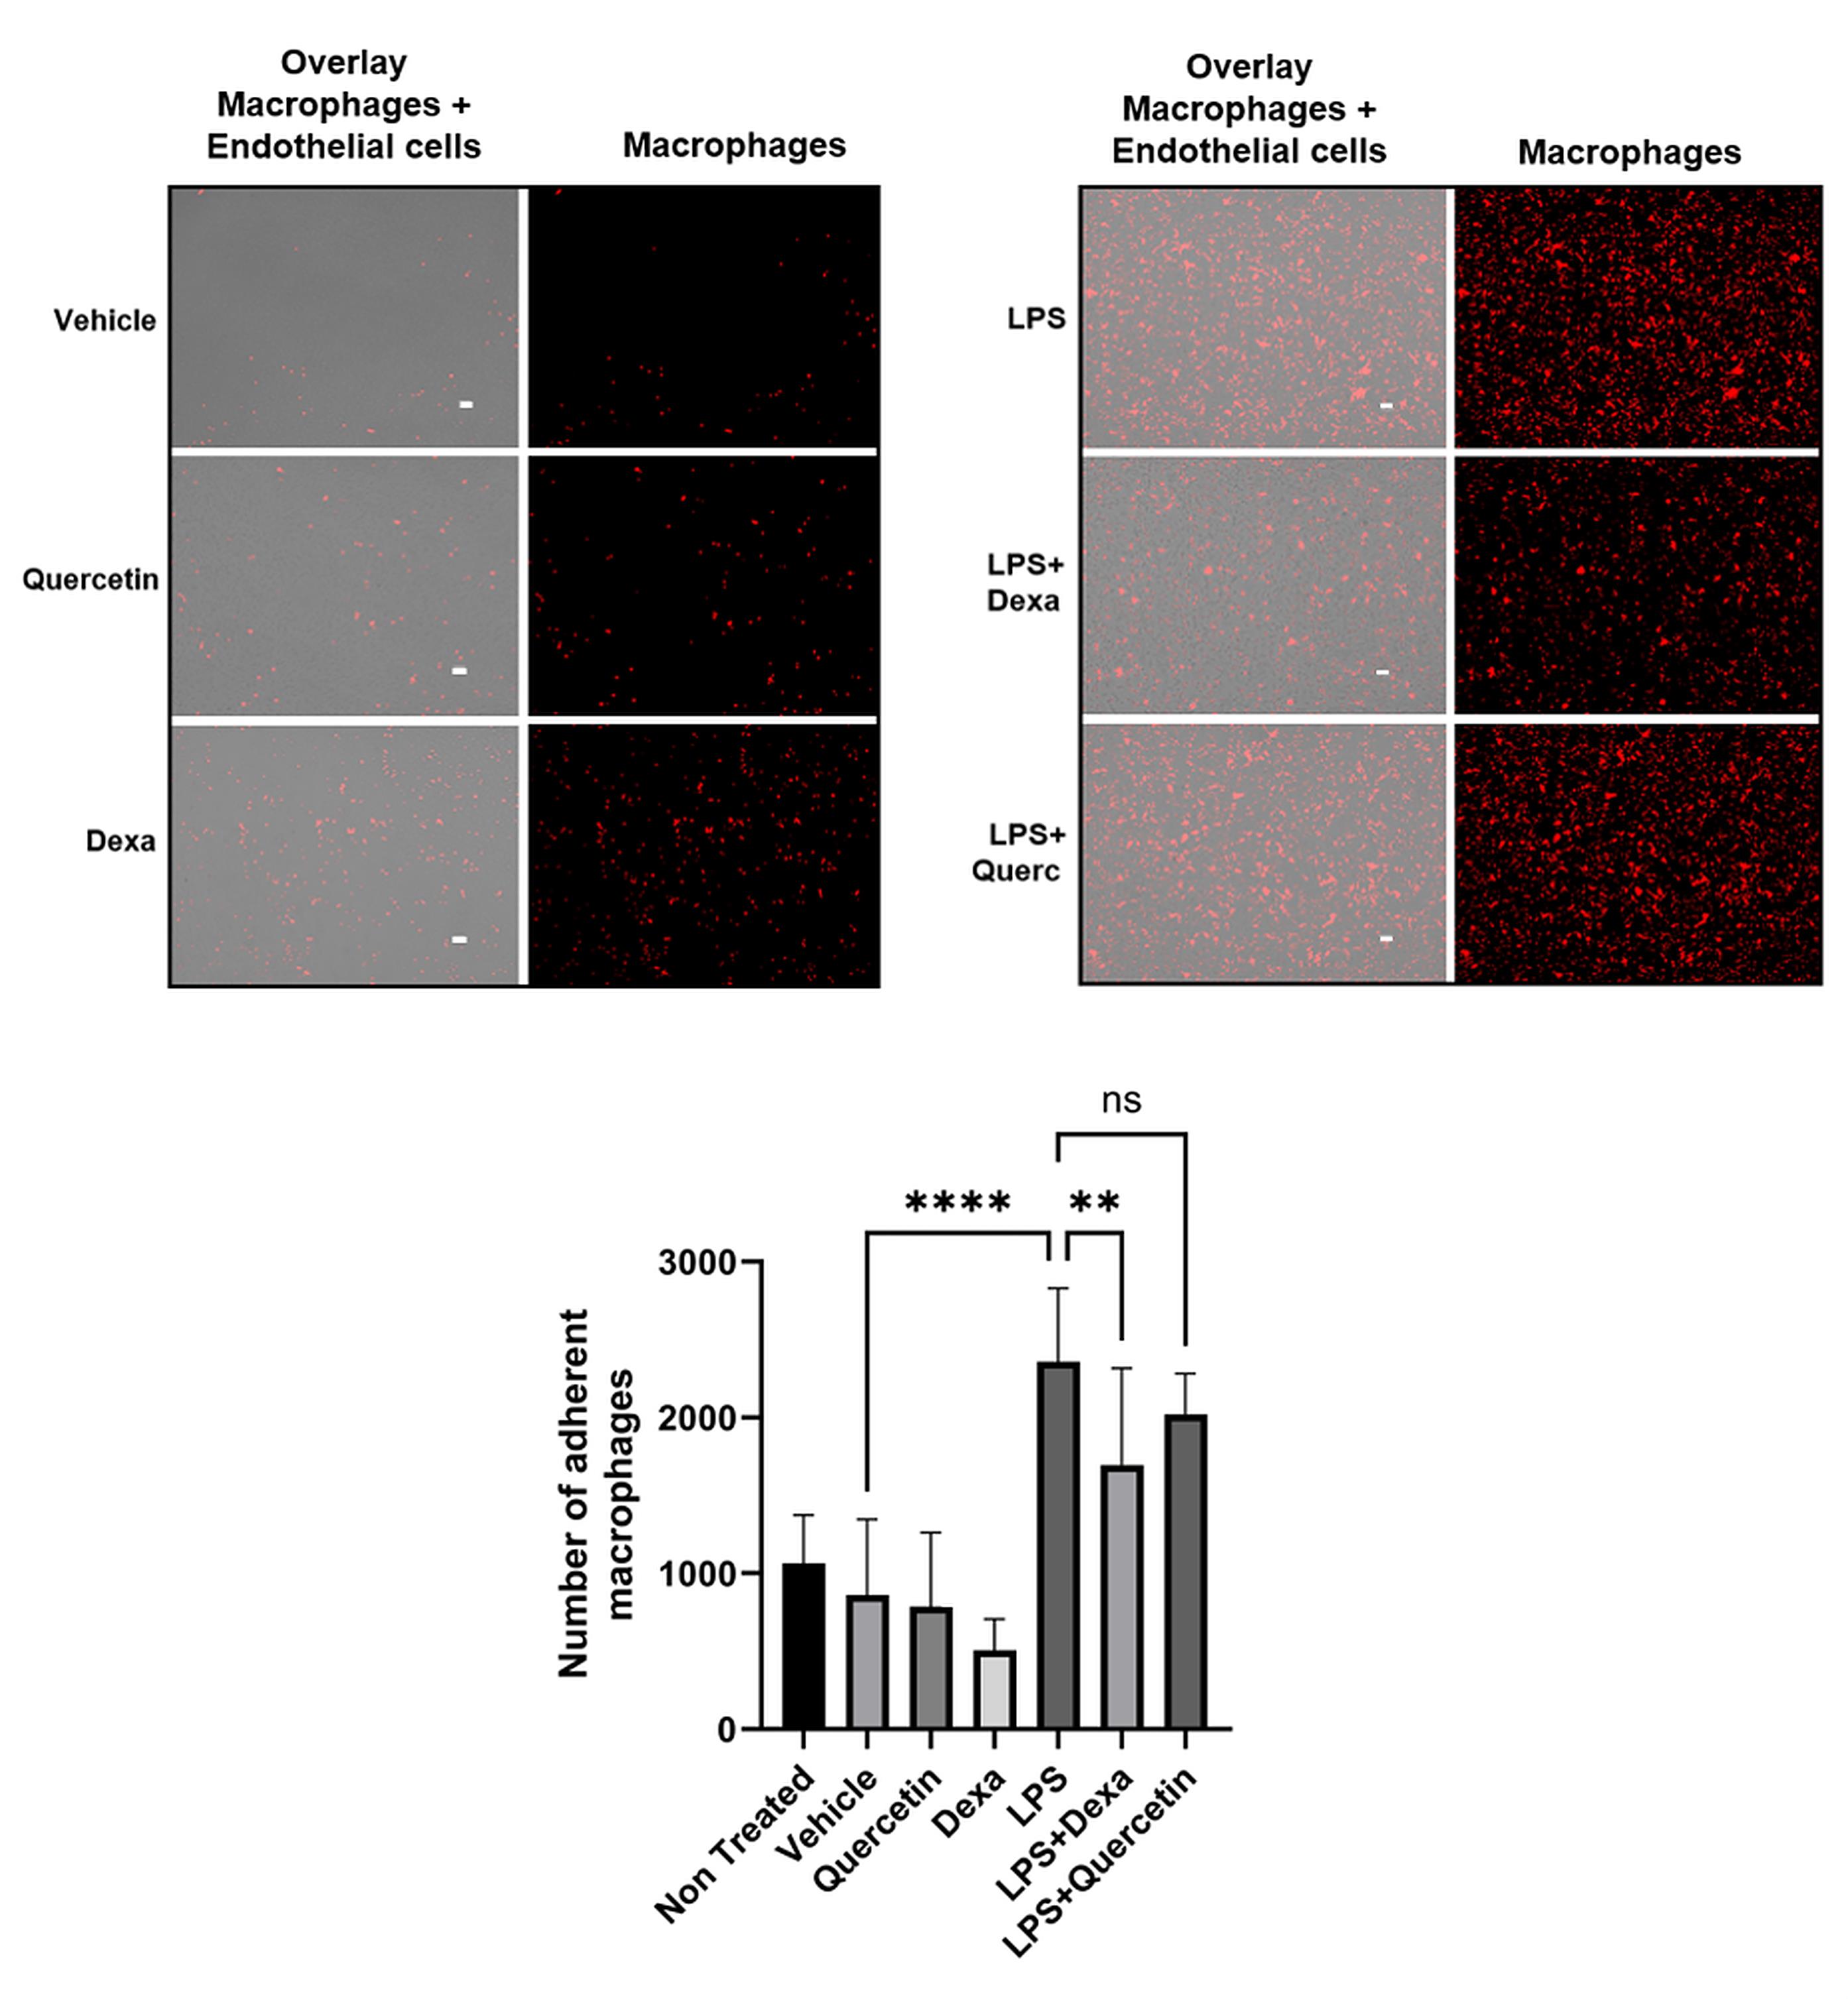
Figure 2. Validation of the macrophage adhesion assay using LPS, dexamethasone, and quercetin. Brain endothelial cells were treated for 48 h with vehicle (0.5% DMSO), LPS (100 ng/mL), dexamethasone (Dexa) (50 μM), quercetin (Querc) (5 μM), LPS + quercetin (5 μM), or LPS + dexamethasone (50 μM). To compare, all groups contained 0.5% DMSO, except for the untreated group. Fluorescently labeled macrophages (1 × 10⁶ cells) were added to endothelial monolayers for 1 h at 37 °C. After removal of non-adherent cells, these were fixed and imaged by confocal microscopy (left panel: endothelial cells in brightfield and macrophages in red; right panel: macrophages in red alone). The number of adherent macrophages is presented in the lower panel graph. Data were analyzed by one-way ANOVA (**p = 0.0021, **** p < 0.001). Non-treated: mean = 1,064, SD = 310, N = 10; Vehicle: mean = 861.2, SD = 486.1, N = 10; Quercetin: mean = 786.1, SD = 475.1, N = 10; Dexa: mean = 506.4, SD = 200.8, N = 10; LPS: mean = 2352, SD = 470.2, N = 11; LPS+Dexa: mean = 1697, SD = 620.3, N = 12; LPS+Quercetin: mean = 2021; SD = 261.3, N = 13. Representative images from three independent experiments. Dexa = dexamethasone, LPS = lipopolysaccharide, SD = standard deviation, ns = non-significant. Scale bar: 50 μm.
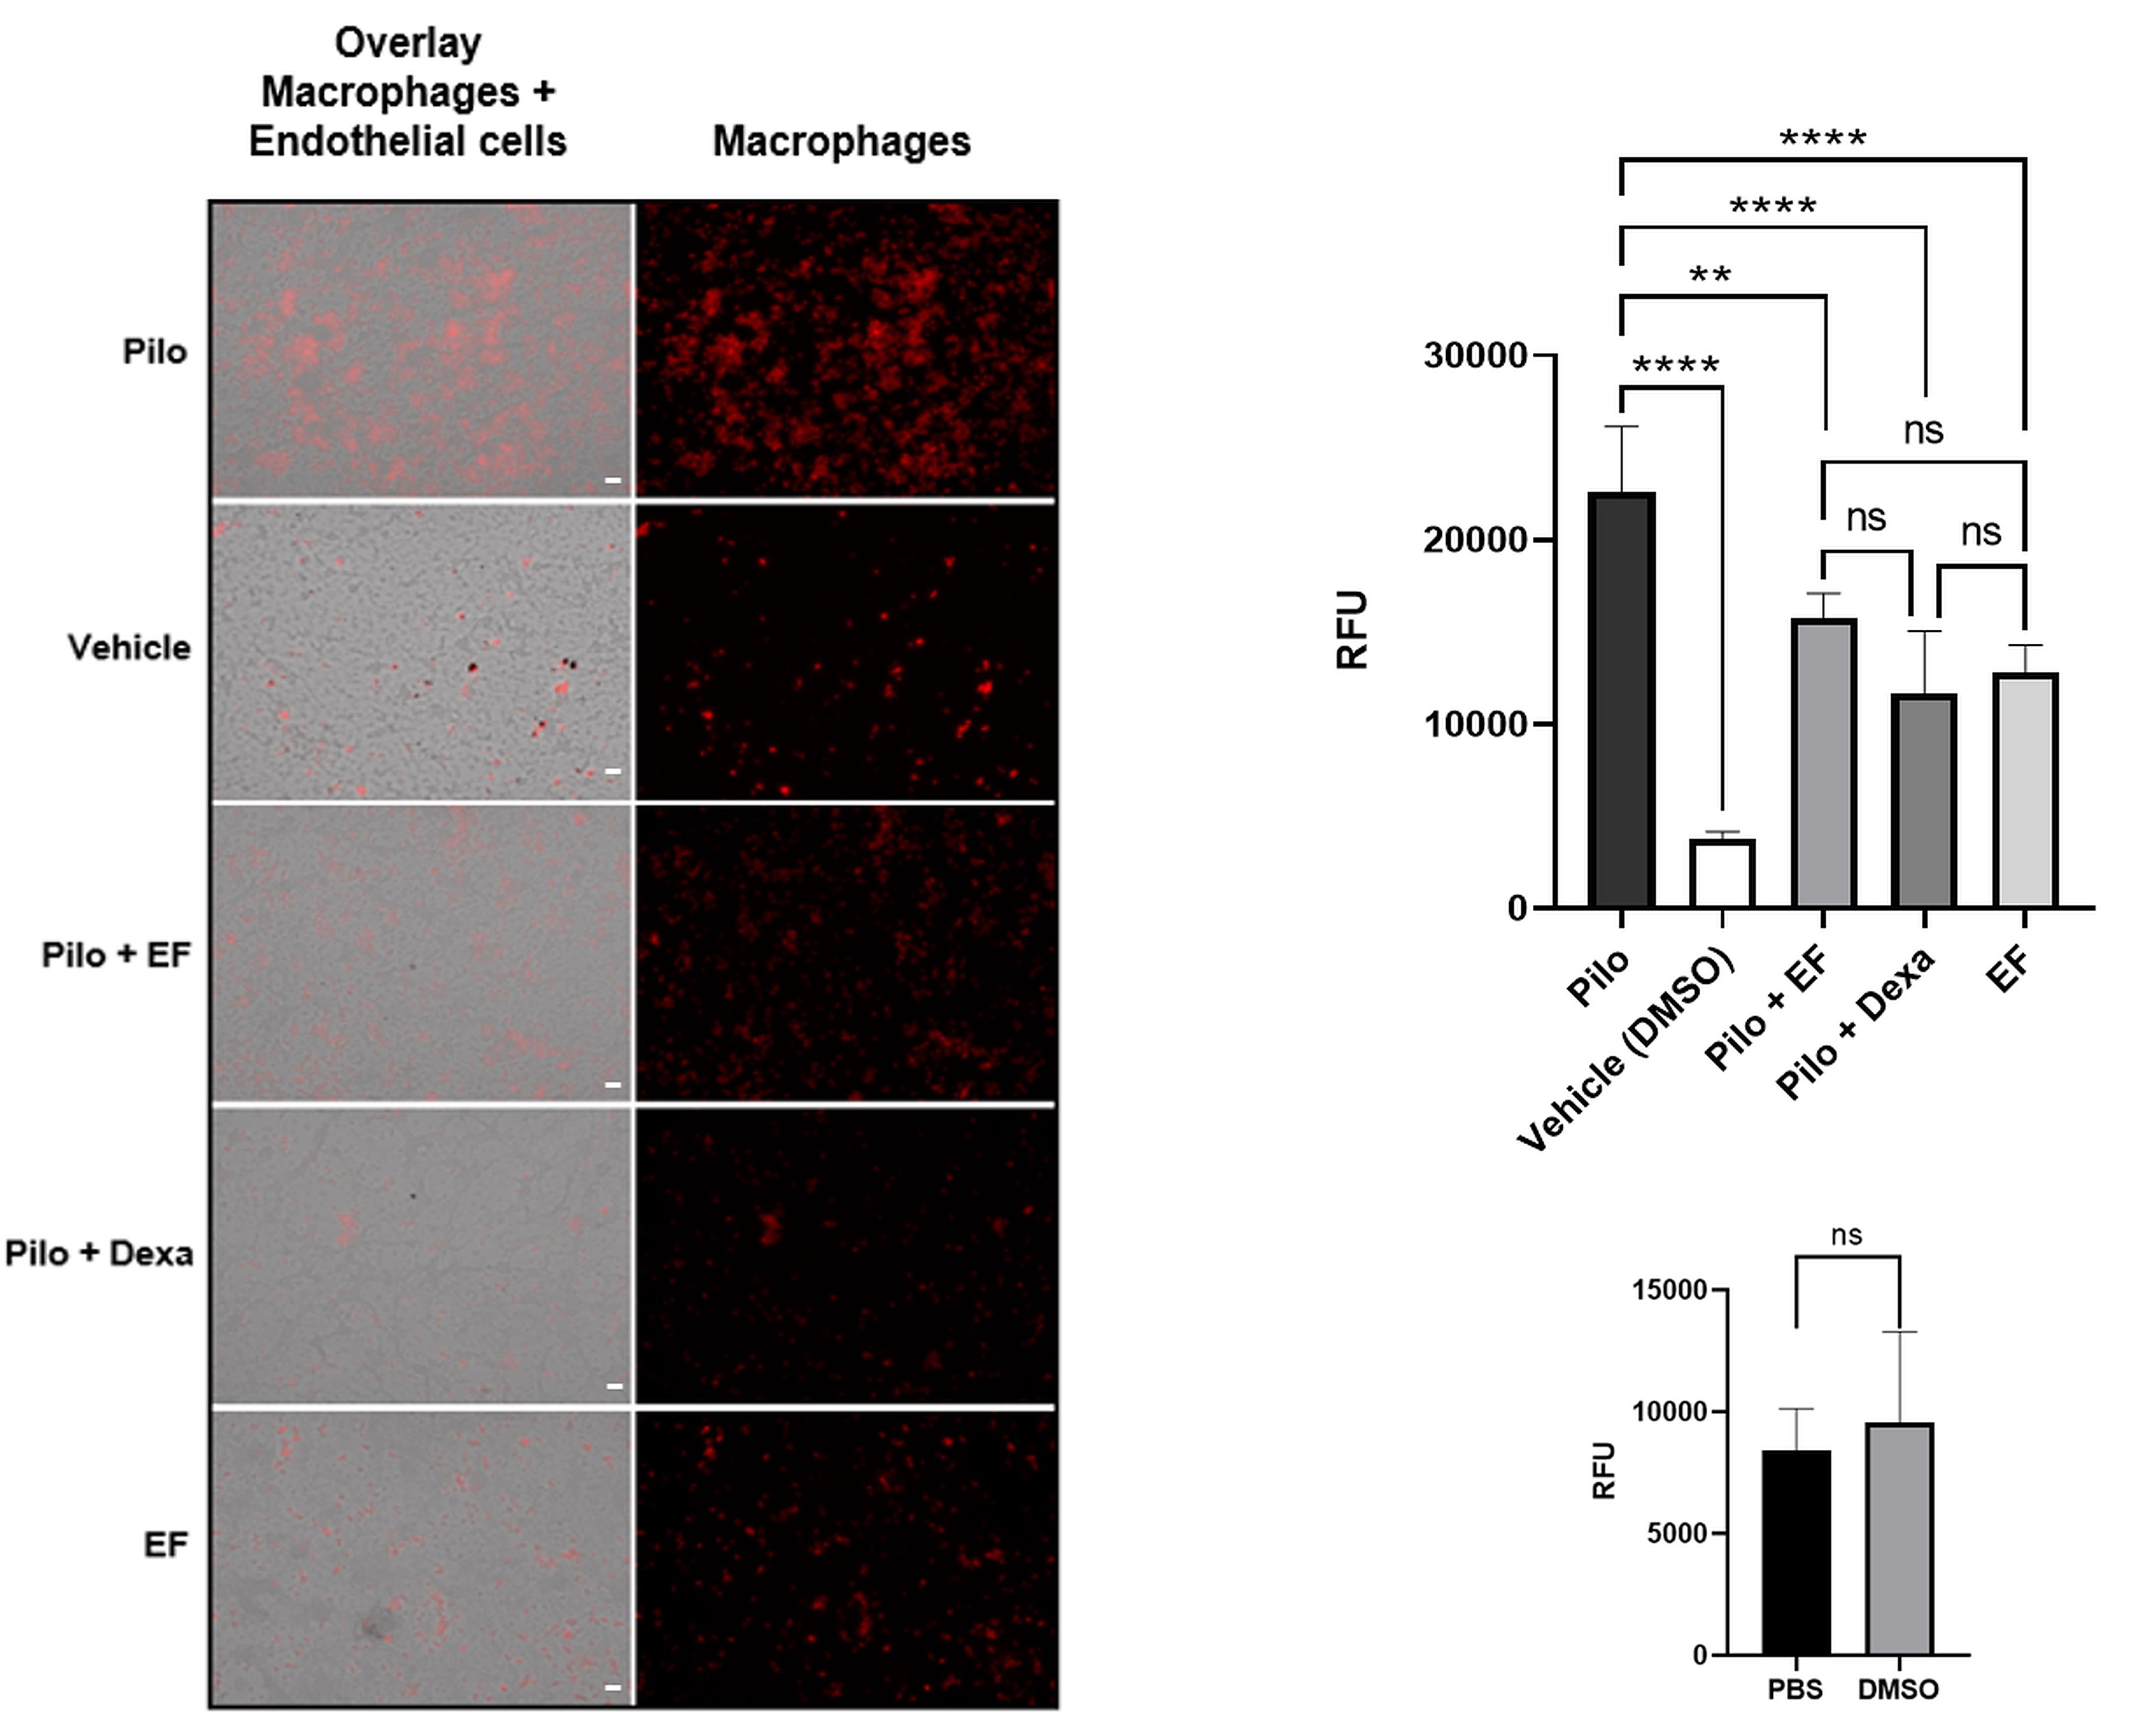
Figure 3. Representative fluorescence images illustrating macrophage adhesion to brain endothelial cells (bEnd.3) following pilocarpine exposure. Representative images of bEnd.3 endothelial cells incubated with fluorescently Dil-labeled RAW 264.7 macrophages following treatment with vehicle (0.1% DMSO), pilocarpine (Pilo) (10 μM), Edelfosine (EF) (1 μM), dexamethasone (Dexa) (50 μM), pilocarpine + edelfosine, or pilocarpine + dexamethasone for 48 h. Macrophage fluorescence was measured as relative fluorescence units (RFU). The upper-right panel shows image quantification for each condition, and the lower-right panel shows image data analysis for vehicles: PBS (for Pilo) and DMSO (for EF, Dexa). Data in the upper-right panel were analyzed by one-way ANOVA (**p = 0.0024; ****p < 0.0001). Pilo: mean = 22,571, SD = 3,571; Vehicle (DMSO): mean = 3,753, SD = 392; Pilo+EF: mean = 15,736, SD = 1350; Pilo+Dexa: mean = 11,658, SD = 3,372; EF: mean = 12,821, SD = 1,459. Data in the lower right panel were analyzed using an unpaired two-tailed t-test (p = 0.79, ns, non-significant). PBS: mean = 8,423, SD = 2,949; DMSO: mean = 9,574, SD = 6,442. Representative images from three independent experiments. Fluorescence images were acquired at 10× magnification. Scale bar: 50 μm.
Data analysis
A. Image processing for cell quantification using ImageJ
Image processing for cell quantification using ImageJ begins by opening the software and selecting File > Open to load an image from the computer. Once the image is opened, convert it to grayscale format by selecting Image > Type > 8-bit. Next, adjust the threshold in Image > Adjust > Threshold, followed by clicking Apply, allowing the software to automatically detect the cells in black within the image. Afterward, apply the Process > Binary > Watershed function to separate cells that may be touching or overlapping.
Subsequently, perform particle analysis by selecting Analyze > Analyze Particles, setting the size from 0 to infinity and the circularity from 0.00 to 1.00, while choosing the option Show: Overlay. In the Analyze Particles settings window, check the boxes Display Results and Summarize before pressing OK. A new window will then appear displaying the file name, the number of counted cells, total area, average particle size, and percentage area. Finally, to export the results for further analysis in Microsoft Excel, select Edit > Copy in the Summary window and paste the data into an Excel spreadsheet.
B. Image processing for total fluorescence quantification using ImageJ
Image processing for total fluorescence quantification using ImageJ begins by opening the software and selecting File > Open to load an image from the computer. After the image is opened, it is converted into grayscale format by selecting Image > Type > 8-bit. The threshold is then adjusted using Image > Adjust > Threshold, followed by clicking Apply, allowing the software to automatically detect the cells in black within the image. Next, measurement parameters are configured by selecting Analyze > Set Measurements and choosing the following options: area, min & max gray value, mean gray value, and integrated density.
Once the measurements are configured, the fluorescence analysis is performed through Analyze > Measure. A new window titled Results will appear, displaying the file name, area, minimum and maximum gray values, mean gray value, and integrated density. For accurate comparisons between samples, all measurements must be performed using the exact same area value. The main parameter used for fluorescence quantification is the Integrated density. Finally, to export the results into Microsoft Excel for further analysis, select Edit > Copy in the Results window and paste the data into an Excel spreadsheet.
C. Number of technical and biological replicates
Replicate each condition at least three times (technical repeats) per experiment. Combine data from at least three different experiments (biological repeats).
D. Criteria for data inclusion/exclusion
By using the Grubbs' test, we can determine whether a result is a significant outlier relative to the rest. Outliers can be excluded from data analyses.
Grubbs' test, also called the extreme studentized deviate (ESD) method, is a simple technique for quantifying outliers in studies. It is based on a normal distribution and a test statistic (Z) that is calculated from the most extreme data point. The test statistic corresponds to a p-value that represents the likelihood of observing that outlier under the assumption that the underlying data are Gaussian.
The formula for the Grubbs' test is as follows:
This test can also be done online, in the following GraphPad Prism webpage: https://www.graphpad.com/quickcalcs/grubbs1/
E. GraphPad analysis software
Data analysis is performed using GraphPad Prism 10 software. To begin the analysis, the user creates a new project by selecting File > New Table and Graph > Column. Under the Data Table section, the option Enter or import data into a new table is selected, followed by choosing Enter replicate values, stacked into columns under the Options menu. The combined fluorescence intensity density values or the number of fluorescent cells corresponding to each treatment group are then arranged in separate columns.
For statistical analysis, the user selects Analyze > Column Analyses > One-way ANOVA (and nonparametric or mixed). In the Analyze Data window, all datasets are selected for analysis. Within the Parameters tab, the experimental design is configured as No matching or pairing. The assumption of a Gaussian distribution of residuals is set to No, while equal standard deviations are assumed by selecting Yes, using the ordinary ANOVA test. In the Multiple Comparisons tab, the option Compare the mean of each column with the mean of every other column is selected.
The software automatically generates two result tabs. The first tab contains the overall one-way ANOVA analysis of the combined data, including the calculated p-value. The second tab, labeled Multiple Comparisons, displays pairwise comparisons between all samples along with their corresponding individual p-values. In these assays, p-values less than 0.05 are considered statistically significant.
F. Data analysis of experimental results
Representative results from the macrophage adhesion assay are shown in Figures 2 and 3. Following treatment, adherent RAW 264.7 macrophages are visualized by fluorescence microscopy and quantified from one centralized picture per well. The mean number of adherent macrophages is calculated for each experimental condition and normalized to the corresponding vehicle-treated control.
A successful assay should demonstrate low basal macrophage adhesion in untreated control cultures and a significant increase in adhesion following inflammatory stimulation with LPS. Although pilocarpine is not a classical inflammatory stimulus, it is expected to increase macrophage adhesion under the conditions described in this protocol, providing an additional model of endothelial activation relevant to seizure-associated neuroinflammation. Treatment with the positive anti-inflammatory control, dexamethasone, should significantly reduce macrophage adhesion compared with the corresponding stimulated groups, confirming assay performance.
Experimental compounds can then be evaluated by comparing macrophage adhesion with the appropriate stimulated control group (e.g., LPS or pilocarpine). Statistical analysis should be performed using one-way ANOVA followed by an appropriate multiple-comparison post hoc test (e.g., Tukey's or Dunnett's test), with statistical significance defined as P < 0.05. Results should be presented as the mean and standard deviation from at least three independent experiments.
Validation of protocol
All experiments were performed using a minimum of three independent biological replicates, with each biological replicate analyzed in at least three technical replicates. Statistical analyses were conducted using one-way analysis of variance, as described in the Data Analysis section, using GraphPad Prism software.
Experimental controls included (1) vehicle-treated cells corresponding to the solvent used for the test compounds, (2) a positive control consisting of a proinflammatory stimulus (LPS or pilocarpine, depending on the experiment) to promote macrophage adhesion, and (3) a negative control consisting of dexamethasone, an anti-inflammatory agent known to reduce macrophage adhesion. To validate the assay, LPS treatment should produce a significant increase in macrophage adhesion compared with the vehicle-treated control, whereas co-treatment with LPS and dexamethasone (LPS + Dexa) should significantly reduce macrophage adhesion relative to the LPS-treated group. These expected responses confirm that the assay is sensitive to both proinflammatory and anti-inflammatory modulation. The experimental groups included treatment with the compounds of interest, quercetin or edelfosine, and their effects must be compared with the corresponding vehicle, positive, and negative controls. Importantly, all treatment groups, including controls, should contain the vehicle at the same final concentration to ensure that any observed differences are attributable to the test compounds rather than the solvent.
The monocyte/macrophage adhesion assay employed in this study, including fluorescent labeling and co-incubation of monocytes/macrophages with endothelial cell monolayers to evaluate factors influencing leukocyte adhesion, is a well-established and validated methodology. Similar protocols have been described and utilized in previous studies by other authors, including:
• Xu et al. [33]. Monocyte Adhesion Assays for Detecting Endothelial Cell Activation in Vascular Inflammation and Atherosclerosis. Methods in Molecular Biology (Figure 1 in the mentioned article).
• Mai et al. [34]. Interleukin-17A Promotes Aortic Endothelial Cell Activation via Transcriptionally and Post-translationally Activating p38 Mitogen-activated Protein Kinase (MAPK) Pathway. Journal of Biological Chemistry (Figure 4F in the mentioned article).
• Wójciak-Stothard et al. [35]. Monocyte adhesion and spreading on human endothelial cells is dependent on Rho-regulated receptor clustering. The Journal of Cell Biology (Graphical overview in the mentioned article).
• Lee et al. [36]. SIRT1 inhibits monocyte adhesion to the vascular endothelium by suppressing Mac-1 expression on monocytes. Experimental & Molecular Medicine (Figure 3A, C; Figure 6D in the mentioned article).
General notes and troubleshooting
General notes
1. This protocol uses a monoculture of bEnd.3 endothelial cells, which does not fully recapitulate the in vivo BBB microenvironment. The in vivo BBB includes dynamic interactions with astrocytes, pericytes, neurons, and extracellular matrix components, which are not represented here. Therefore, results should be interpreted as indicative of endothelial-specific responses rather than whole neurovascular unit behavior.
2. The macrophage adhesion assay is performed under static conditions, which lack physiological shear stress. Consequently, the assay does not model processes such as leukocyte rolling and flow-dependent adhesion, which occur in vivo.
3. Both bEnd.3 and RAW 264.7 are immortalized murine cell lines. Their behavior can vary depending on the number, culture conditions, and laboratory handling, potentially affecting adhesion outcomes and inflammatory responses. Using low-to-mid passage cells and consistent culture conditions is critical for reproducibility; we recommend passages 10–30.
4. This protocol can be adapted to other endothelial or immune cell systems (e.g., HUVECs, THP-1 macrophages), but optimization of seeding density, labeling conditions, and treatment concentrations is required, as adhesion properties differ between models.
Troubleshooting
Problem 1: High confluency of RAW 264.7 before subculturing induces clumping.
Possible cause: RAW 264.7 is a cell line characterized by a high proliferation rate and high sensitivity to the microenvironment. Upon reaching or exceeding confluency (>90%–100%), the cells experience nutrient limitation, accumulation of acidic metabolites, and excessive cell–cell contact, which can induce unwanted basal activation, morphological changes, and increased expression of proinflammatory cytokines even in the absence of classical stimuli [35].
Solution: To overcome these problems, we recommend (1) subculturing RAW 264.7 cells when they reach 80%–90% confluency, avoiding prolonged overcrowding, (2) changing the media every 48 h to prevent acidification and metabolic stress, and (3) use the cells from low to medium passages (10–30), as over-culturing disrupts the plasticity and basal activation state of RAW 264.7 macrophages [36].
Problem 2: Inappropriate pipetting during seeding leads to accumulation in the corners of the wells and to overactivation due to mechanical shear stress.
Possible cause: Rapid pipetting, whether pipetting of the bEnd.3 endothelial cells on the bottom of the well or pipetting of RAW 264.7 macrophages on the endothelial monolayer generates turbulent microflows and localized mechanical stress [37], leading to cell accumulation in the corners of the well and potentially inducing mechano-dependent activation in both macrophages [38] and endothelial cells. It has been demonstrated that even transient shear forces activate signaling pathways such as nuclear factor kappa B (NF-κB), focal adhesion kinase (FAK) [39], and mitogen-activated protein kinases (MAPKs), thereby altering cell adhesion.
Solution: To overcome this problem, we recommend (1) adding cell suspensions slowly and (2) avoiding vigorous resuspensions immediately before seeding to reduce mechanical pre-activation of both cell lines.
Problem 3: Residual presence of serum in bEnd.3 monolayer washes produce excessive macrophage adhesion.
Possible cause: The serum contains adhesive proteins (e.g., fibronectin, vitronectin) [40,41] that coat the endothelial surface and act as integrin-dependent bridges, increasing the basal adhesion of macrophages and masking actual experimental effects.
Solution: To overcome this problem, we recommend (1) performing thorough washes to bEnd.3 endothelial cells with PBS or serum-free medium before adding RAW 264.7 macrophages, and (2) maintaining the endothelial cells in serum-free conditions during the macrophage adhesion step.
Acknowledgments
Funding acquisition: Yancy Ferrer-Acosta and Antonio Henrique Martins; Supervision: Yancy Ferrer-Acosta and Antonio Henrique Martins. This research was supported by: COBRE Center for Microbiome Studies award #1P20156713-01; Institutional Development Award (IDeA) from the NIGMS-PRINBRE award #P20GM103475; COBRE3 Neuroplasticity award #P30-GM149367; and Neuro ID, award #5R25NS80687.
Author contributions
Specific contributions of each author: Conceptualization: Lorena Pachiardi, Antonio Henrique Martins, and Yancy Ferrer-Acosta; Investigation: Abriel J. Rivera Rivera, Paola N. Gracia Ayala, and Arot L. Velázquez Pulliza; Writing—original draft: Abriel J. Rivera Rivera; Writing—review & editing: Yancy Ferrer-Acosta and Antonio Henrique Martins.
Competing interests
The authors declare no conflicts of interest.
Ethical considerations
All authors declare that there are no ethical considerations regarding this protocol.
References
- Balistreri, C. R. and Monastero, R. (2023). Neuroinflammation and Neurodegenerative Diseases: How Much Do We Still Not Know? Brain Sci. 14(1): 19. https://doi.org/10.3390/brainsci14010019
- Zhang, W., Xiao, D., Mao, Q. and Xia, H. (2023). Role of neuroinflammation in neurodegeneration development. Signal Transduct Target Ther. 8(1): 267. https://doi.org/10.1038/s41392-023-01486-5
- Adamu, A., Li, S., Gao, F. and Xue, G. (2024). The role of neuroinflammation in neurodegenerative diseases: current understanding and future therapeutic targets. Front Aging Neurosci. 16: e1347987. https://doi.org/10.3389/fnagi.2024.1347987
- Kwon, H. S. and Koh, S. H. (2020). Neuroinflammation in neurodegenerative disorders: the roles of microglia and astrocytes. Transl Neurodegener. 9(1): 42. https://doi.org/10.1186/s40035-020-00221-2
- Zang, X., Chen, S., Zhu, J., Ma, J. and Zhai, Y. (2022). The Emerging Role of Central and Peripheral Immune Systems in Neurodegenerative Diseases. Front Aging Neurosci. 14: e872134. https://doi.org/10.3389/fnagi.2022.872134
- Aranda-Abreu, G. E., Rojas-Durán, F., Hernández-Aguilar, M. E., Herrera-Covarrubias, D., Tlapa-Monge, L. R. and Mestizo-Gutiérrez, S. L. (2026). The Molecular Architecture of Neurodegeneration: An Integrative Overview of Convergent Mechanisms. NeuroSci. 7(1): 7. https://doi.org/10.3390/neurosci7010007
- Müller, L., Di Benedetto, S. and Müller, V. (2025). The dual nature of neuroinflammation in networked brain. Front Immunol. 16: e1659947. https://doi.org/10.3389/fimmu.2025.1659947
- Mohan, U. P., Filipeanu, C. M. and Lazartigues, E. (2026). Microglial activation and RAS signaling: a dual-edged sword in neuroinflammation. Am J Physiol Regul Integr Comp Physiol. 330(2): R151–R165. https://doi.org/10.1152/ajpregu.00268.2025
- Ramos, A. J., Lazarowski, A., Vega-García, A., Buriticá-Ramírez, E., Auzmendi, J., Becerra-Hernández, L. V., Nuñez-Lumbreras, M. d. l. A., Orozco-Suárez, S. A., Alves, S. S., Garcia-Cairasco, N., et al. (2025). Modulation of neuroinflammation as a therapeutic strategy for the control of epilepsy. Seizure. 131: 458–470. https://doi.org/10.1016/j.seizure.2025.08.023
- Bosco, D. B., Tian, D. and Wu, L. (2020). Neuroimmune interaction in seizures and epilepsy: focusing on monocyte infiltration. FEBS J. 287(22): 4822–4837. https://doi.org/10.1111/febs.15428
- Kobeissy, F. and Salzet, M. (2026). Beyond immune privilege: the brain as a dynamic immunological interface. Cell Death Dis. 17(1): 408. https://doi.org/10.1038/s41419-026-08561-z
- Kölliker-Frers, R., Udovin, L., Otero-Losada, M., Kobiec, T., Herrera, M. I., Palacios, J., Razzitte, G. and Capani, F. (2021). Neuroinflammation: An Integrating Overview of Reactive‐Neuroimmune Cell Interactions in Health and Disease. Mediators Inflamm. 2021(1): e1155/2021/9999146. https://doi.org/10.1155/2021/9999146
- Gryka-Marton, M., Grabowska, A. D. and Szukiewicz, D. (2025). Breaking the Barrier: The Role of Proinflammatory Cytokines in BBB Dysfunction. Int J Mol Sci. 26(8): 3532. https://doi.org/10.3390/ijms26083532
- Alboni, S. and Maggi, L. (2016). Editorial: Cytokines as Players of Neuronal Plasticity and Sensitivity to Environment in Healthy and Pathological Brain. Front Cell Neurosci. 9: e00508. https://doi.org/10.3389/fncel.2015.00508
- Candelario-Jalil, E., Dijkhuizen, R. M. and Magnus, T. (2022). Neuroinflammation, Stroke, Blood-Brain Barrier Dysfunction, and Imaging Modalities. Stroke. 53(5): 1473–1486. https://doi.org/10.1161/strokeaha.122.036946
- Ju, M., Shen, H., Zhang, X., Tian, M. and Zhang, L. (2026). The crosstalk between blood-brain barrier and neural cells: bidirectional regulation of brain function and pathology. Biochem Biophys Rep. 45: 102475. https://doi.org/10.1016/j.bbrep.2026.102475
- Soto-Rojas, L. O., Cruz-López, F. d. l., Ontiveros-Torres, M. A., Viramontes-Pintos, A., Cárdenas-Aguayo, M. d. C., Meraz-Ríos, M. A., Salinas-Lara, C., Florán-Garduño, B. and Luna-Muñoz, J. (2015). Neuroinflammation and Alteration of the Blood-Brain Barrier in Alzheimer’s Disease. Alzheimers Dis.: e5772/60024. https://doi.org/10.5772/60024
- Sumadewi, K. T., Harkitasari, S. and Tjandra, D. C. (2023). Biomolecular mechanisms of epileptic seizures and epilepsy: a review. Acta Epileptol. 5(1): 1–22. https://doi.org/10.1186/s42494-023-00137-0
- Swissa, E., Serlin, Y., Vazana, U., Prager, O. and Friedman, A. (2019). Blood–brain barrier dysfunction in status epileptics: Mechanisms and role in epileptogenesis. Epilepsy Behav. 101: 106285. https://doi.org/10.1016/j.yebeh.2019.04.038
- Suleymanova, E. and Karan, A. (2025). The Role of Blood–Brain Barrier Disruption in Epilepsy: Mechanisms and Consequences. Neurol Int. 18(1): 1. https://doi.org/10.3390/neurolint18010001
- Winkler, B., Funke, D., Benmimoun, B., Spéder, P., Rey, S., Logan, M. A. and Klämbt, C. (2021). Brain inflammation triggers macrophage invasion across the blood-brain barrier in Drosophila during pupal stages. Sci Adv. 7(44): eabh0050. https://doi.org/10.1126/sciadv.abh0050
- Alemán-Villa, K. M., Armienta-Rojas, D. A., Camberos-Barraza, J., Rábago-Monzón, Ã. R., Camacho-Zamora, A., Osuna-Ramos, J. F., Magaña-Gómez, J. A., Guadrón-Llanos, A. M., Calderón-Zamora, L., Norzagaray-Valenzuela, C. D., et al. (2025). Neuroinflammation across the Spectrum of Neurodegenerative Diseases: Mechanisms and Therapeutic Frontiers. Neuroimmunomodulation. 32(1): 278–305. https://doi.org/10.1159/000548021
- Kim, S., Jung, U. J. and Kim, S. R. (2025). The Crucial Role of the Blood–Brain Barrier in Neurodegenerative Diseases: Mechanisms of Disruption and Therapeutic Implications. J Clin Med. 14(2): 386. https://doi.org/10.3390/jcm14020386
- Zhou, Y., Yang, Y., Tian, R. and Cheang, W. S. (2025). Pterostilbene protects against lipopolysaccharide-induced inflammation and blood–brain barrier disruption in immortalized brain endothelial cell lines in vitro. Sci Rep. 15(1): 1542. https://doi.org/10.1038/s41598-025-85144-6
- Powis, G., Seewald, M. J., Gratas, C., Melder, D., Riebow, J. and Modest, E. J. (1992). Selective inhibition of phosphatidylinositol phospholipase C by cytotoxic ether lipid analogues.Cancer Res. 52(10): 2835–2840. https://pubmed.ncbi.nlm.nih.gov/1316230/
- James, S. R. and Downes, C. P. (1997). Structural and mechanistic features of phospholipases C: effectors of inositol phospholipid-mediated signal transduction. Cell Signal. 9(5): 329–336. https://doi.org/10.1016/s0898-6568(96)00175-1
- Pérez-Caraballo, D., Torres, G., Estrada, S., Inostroza-Nieves, Y., Pérez, D., Ferchmin, P., Delgado, Y. and Ferrer-Acosta, Y. (2024). Neuroprotection and activation of anti-inflammatory and plasticity mechanisms by PLC-β inhibition after cholinergic hyperstimulation in hippocampal slices and microglial cells. IBRO Neurosci Rep. 19:1117–1127. https://doi.org/10.1016/j.ibneur.2024.11.011
- Lu, T., Gao, J., Zhu, P., Cao, R. and Ye, K. (2026). The multi-target protective effects of quercetin in cerebrovascular diseases: a dietary strategy for endothelial repair and neuroprotection. Front Nutr. 13: 1775964. https://doi.org/10.3389/fnut.2026.1775964
- Butler, L. M., McGettrick, H. M. and Nash, G. B. (2016). Static and Dynamic Assays of Cell Adhesion Relevant to the Vasculature. Methods Mol Biol. 1430: 231–248. https://doi.org/10.1007/978-1-4939-3628-1_16
- Higueras, M. Ã., Jiménez-García, L., Herranz, S., Hortelano, S. and Luque, A. (2017). Screening Assays to Characterize Novel Endothelial Regulators Involved in the Inflammatory Response. J Visualized Exp. 127: 55824. https://doi.org/10.3791/55824
- Justus, C. R., Marie, M. A., Sanderlin, E. J. and Yang, L. V. (2023). Transwell In Vitro Cell Migration and Invasion Assays. Methods Mol Biol. 2644: 349–359. https://doi.org/10.1007/978-1-0716-3052-5_22
- Pijuan, J., Barceló, C., Moreno, D. F., Maiques, O., Sisó, P., Marti, R. M., Macià, A. and Panosa, A. (2019). In vitro Cell Migration, Invasion, and Adhesion Assays: From Cell Imaging to Data Analysis. Front Cell Dev Biol. 7: e00107. https://doi.org/10.3389/fcell.2019.00107
- Xu, K., Saaoud, F., Yu, S., Drummer, C., Shao, Y., Sun, Y., Lu, Y., Sun, J., Yu, J., Jiang, X., et al. (2022). Monocyte Adhesion Assays for Detecting Endothelial Cell Activation in Vascular Inflammation and Atherosclerosis. Methods Mol Biol. 2419: 169–182. https://doi.org/10.1007/978-1-0716-1924-7_10
- Mai, J., Nanayakkara, G., Lopez-Pastrana, J., Li, X., Li, Y. F., Wang, X., Song, A., Virtue, A., Shao, Y., Shan, H., et al. (2016). Interleukin-17A Promotes Aortic Endothelial Cell Activation via Transcriptionally and Post-translationally Activating p38 Mitogen-activated Protein Kinase (MAPK) Pathway. J Biol Chem. 291(10): 4939–4954. https://doi.org/10.1074/jbc.m115.690081
- Wójciak-Stothard, B., Williams, L. and Ridley, A. J. (1999). Monocyte Adhesion and Spreading on Human Endothelial Cells Is Dependent on Rho-regulated Receptor Clustering. J Cell Biol. 145(6): 1293–1307. https://doi.org/10.1083/jcb.145.6.1293
- Lee, S. J., Baek, S. E., Jang, M. A. and Kim, C. D. (2019). SIRT1 inhibits monocyte adhesion to the vascular endothelium by suppressing Mac-1 expression on monocytes. Exp Mol Med. 51(4): 1–12. https://doi.org/10.1038/s12276-019-0239-x
- Shetty, S., Weston, C. J., Adams, D. H. and Lalor, P. F. (2014). A Flow Adhesion Assay to Study Leucocyte Recruitment to Human Hepatic Sinusoidal Endothelium Under Conditions of Shear Stress. J Visualized Exp. (85): 51330. https://doi.org/10.3791/51330
- Jui, E., Kingsley, G., Phan, H. K. T., Singampalli, K. L., Birla, R. K., Connell, J. P., Keswani, S. G. and Grande-Allen, K. J. (2024). Shear Stress Induces a Time-Dependent Inflammatory Response in Human Monocyte-Derived Macrophages. Ann Biomed Eng. 52(11): 2932–2947. https://doi.org/10.1007/s10439-024-03546-5
- Li, S., Kim, M., Hu, Y. L., Jalali, S., Schlaepfer, D. D., Hunter, T., Chien, S. and Shyy, J. J. (1997). Fluid Shear Stress Activation of Focal Adhesion Kinase. J Biol Chem. 272(48): 30455–30462. https://doi.org/10.1074/jbc.272.48.30455
- Lee, D. Y., Lee, S. Y., Yun, S. H., Jeong, J. W., Kim, J. H., Kim, H. W., Choi, J. S., Kim, G. D., Joo, S. T., Choi, I., et al. (2022). Review of the Current Research on Fetal Bovine Serum and the Development of Cultured Meat. Food Sci Anim Resour. 42(5): 775–799. https://doi.org/10.5851/kosfa.2022.e46
- Piazza, F., Ravaglia, B., Caporale, A., Svetić, A., Parisse, P., Asaro, F., Grassi, G., Secco, L., Sgarra, R., Marsich, E., et al. (2024). Elucidating the unexpected cell adhesive properties of agarose substrates. The effect of mechanics, fetal bovine serum and specific peptide sequences. Acta Biomater. 189: 286–297. https://doi.org/10.1016/j.actbio.2024.09.042
Article Information
Publication history
Received: Jun 25, 2026
Accepted: Aug 9, 2026
Available online: Sep 3, 2026
Published: Sep 20, 2026
Copyright
© 2026 The Author(s); This is an open access article under the CC BY-NC license (https://creativecommons.org/licenses/by-nc/4.0/).
How to cite
Rivera-Rivera, A. J., Gracia-Ayala, P. N., Velázquez Pulliza, A. L., Martins, A. H. and Ferrer-Acosta, Y. (2026). An In Vitro Model to Study Drugs That Affect Macrophage Adhesion to Murine Brain Endothelial Cells After Proinflammatory Insults of LPS and Pilocarpine. Bio-protocol 16(18): e5825. DOI: 10.21769/BioProtoc.5825.

 Download Citation in RIS Format
Category
Neuroscience > Nervous system disorders > Blood brain barrier
Cell Biology > Cell-based analysis > Cell adhesion
Immunology > Immune cell function > Macrophage
Do you have any questions about this protocol?
Post your question to gather feedback from the community. We will also invite the authors of this article to respond.
 Post a Question


