


- Protocols

- Articles and Issues
- For Authors
- About
- Become a Reviewer


An Automated, Ventana Discovery Platform-based Imaging Workflow for Simultaneous Quantification of B Cells, Plasma Cells, and Plasmablasts in FFPE Human Tissues

Published: Vol 16, Iss 17, Sep 5, 2026 DOI: 10.21769/BioProtoc.5797 Views: 184
Reviewed by: Alessandro DidonnaSunjay J FernandesAnonymous reviewer(s)
 PDF
PDF  Ask a question
Original research article
The authors used this protocol in:

Mar 2026
Advertisement


Protocol Collections
Comprehensive collections of detailed, peer-reviewed protocols focusing on specific topics




Related protocols
Abstract
Accurate, sensitive quantification of B-lineage cells is critical for pharmacodynamic evaluation of B cell–targeted therapies in lupus nephritis (LN) clinical trials. While high-dimensional discovery platforms offer broad profiling, they often lack the sensitivity, quantitative rigor, and throughput needed for precise cell enumeration in renal trial needle biopsies. Traditional immunostaining is hampered by CD20-directed therapeutic masking or downregulation, inadequate sensitivity of CD19 in FFPE tissue, and confounding renal tubular CD138 expression. This protocol details an automated, fit-for-purpose, 5-plex sequential tyramide signal amplification (TSA)-based immunofluorescence assay (CD38, CD79a, CD19, Ki-67, CD138) developed on the Ventana Discovery Ultra platform for deployment on single tissue sections. The workflow anchors B-cell detection on CD79a to ensure sensitivity and utilizes CD38 as an obligate co-marker for CD138+ antibody-secreting cells (ASCs) to definitively exclude the CD138+ epithelial background. Following acquisition via fluorescence whole-slide imaging, a digital analysis pipeline utilizing InstanSeg-based automated segmentation rigorously classifies cell phenotypes to generate precise spatial densities (cells/mm2). This validated protocol maximizes data yield from scarce clinical biopsies while providing high-precision quantitative monitoring of longitudinal therapeutic depletion in the renal microenvironment.
Key features
• Automated trial scalability: Details an automated, TSA-based 5-plex assay optimized for the Ventana Discovery Ultra platform, ensuring high-throughput, reproducible B-lineage quantification in multicenter cohorts.
• Robust lineage identification: Establishes CD79a as an anchor for sensitive B-cell detection in FFPE tissue, avoiding CD20 therapeutic masking/downregulation and CD19 epitope instability.
• High-specificity ASC enumeration: Resolves confounding CD138+ renal tubular background using an obligate CD38/CD138 co-labeling strategy to definitively identify ASCs within the renal microenvironment.
• Single-section phenotypic resolution: Combines multiplexing and InstanSeg segmentation on one 4-μm section to simultaneously quantify B-lineage subsets in tissue-limited renal needle biopsies.
Keywords: Lupus nephritis B cells
Plasma cells
Plasmablasts
Antibody-secreting cells (ASCs)
Quantitative-multiplex immunofluorescence
FFPE tissue
Spatial density
B cells
Plasma cells
Plasmablasts
Antibody-secreting cells (ASCs)
Quantitative-multiplex immunofluorescence
FFPE tissue
Spatial density
Graphical overview
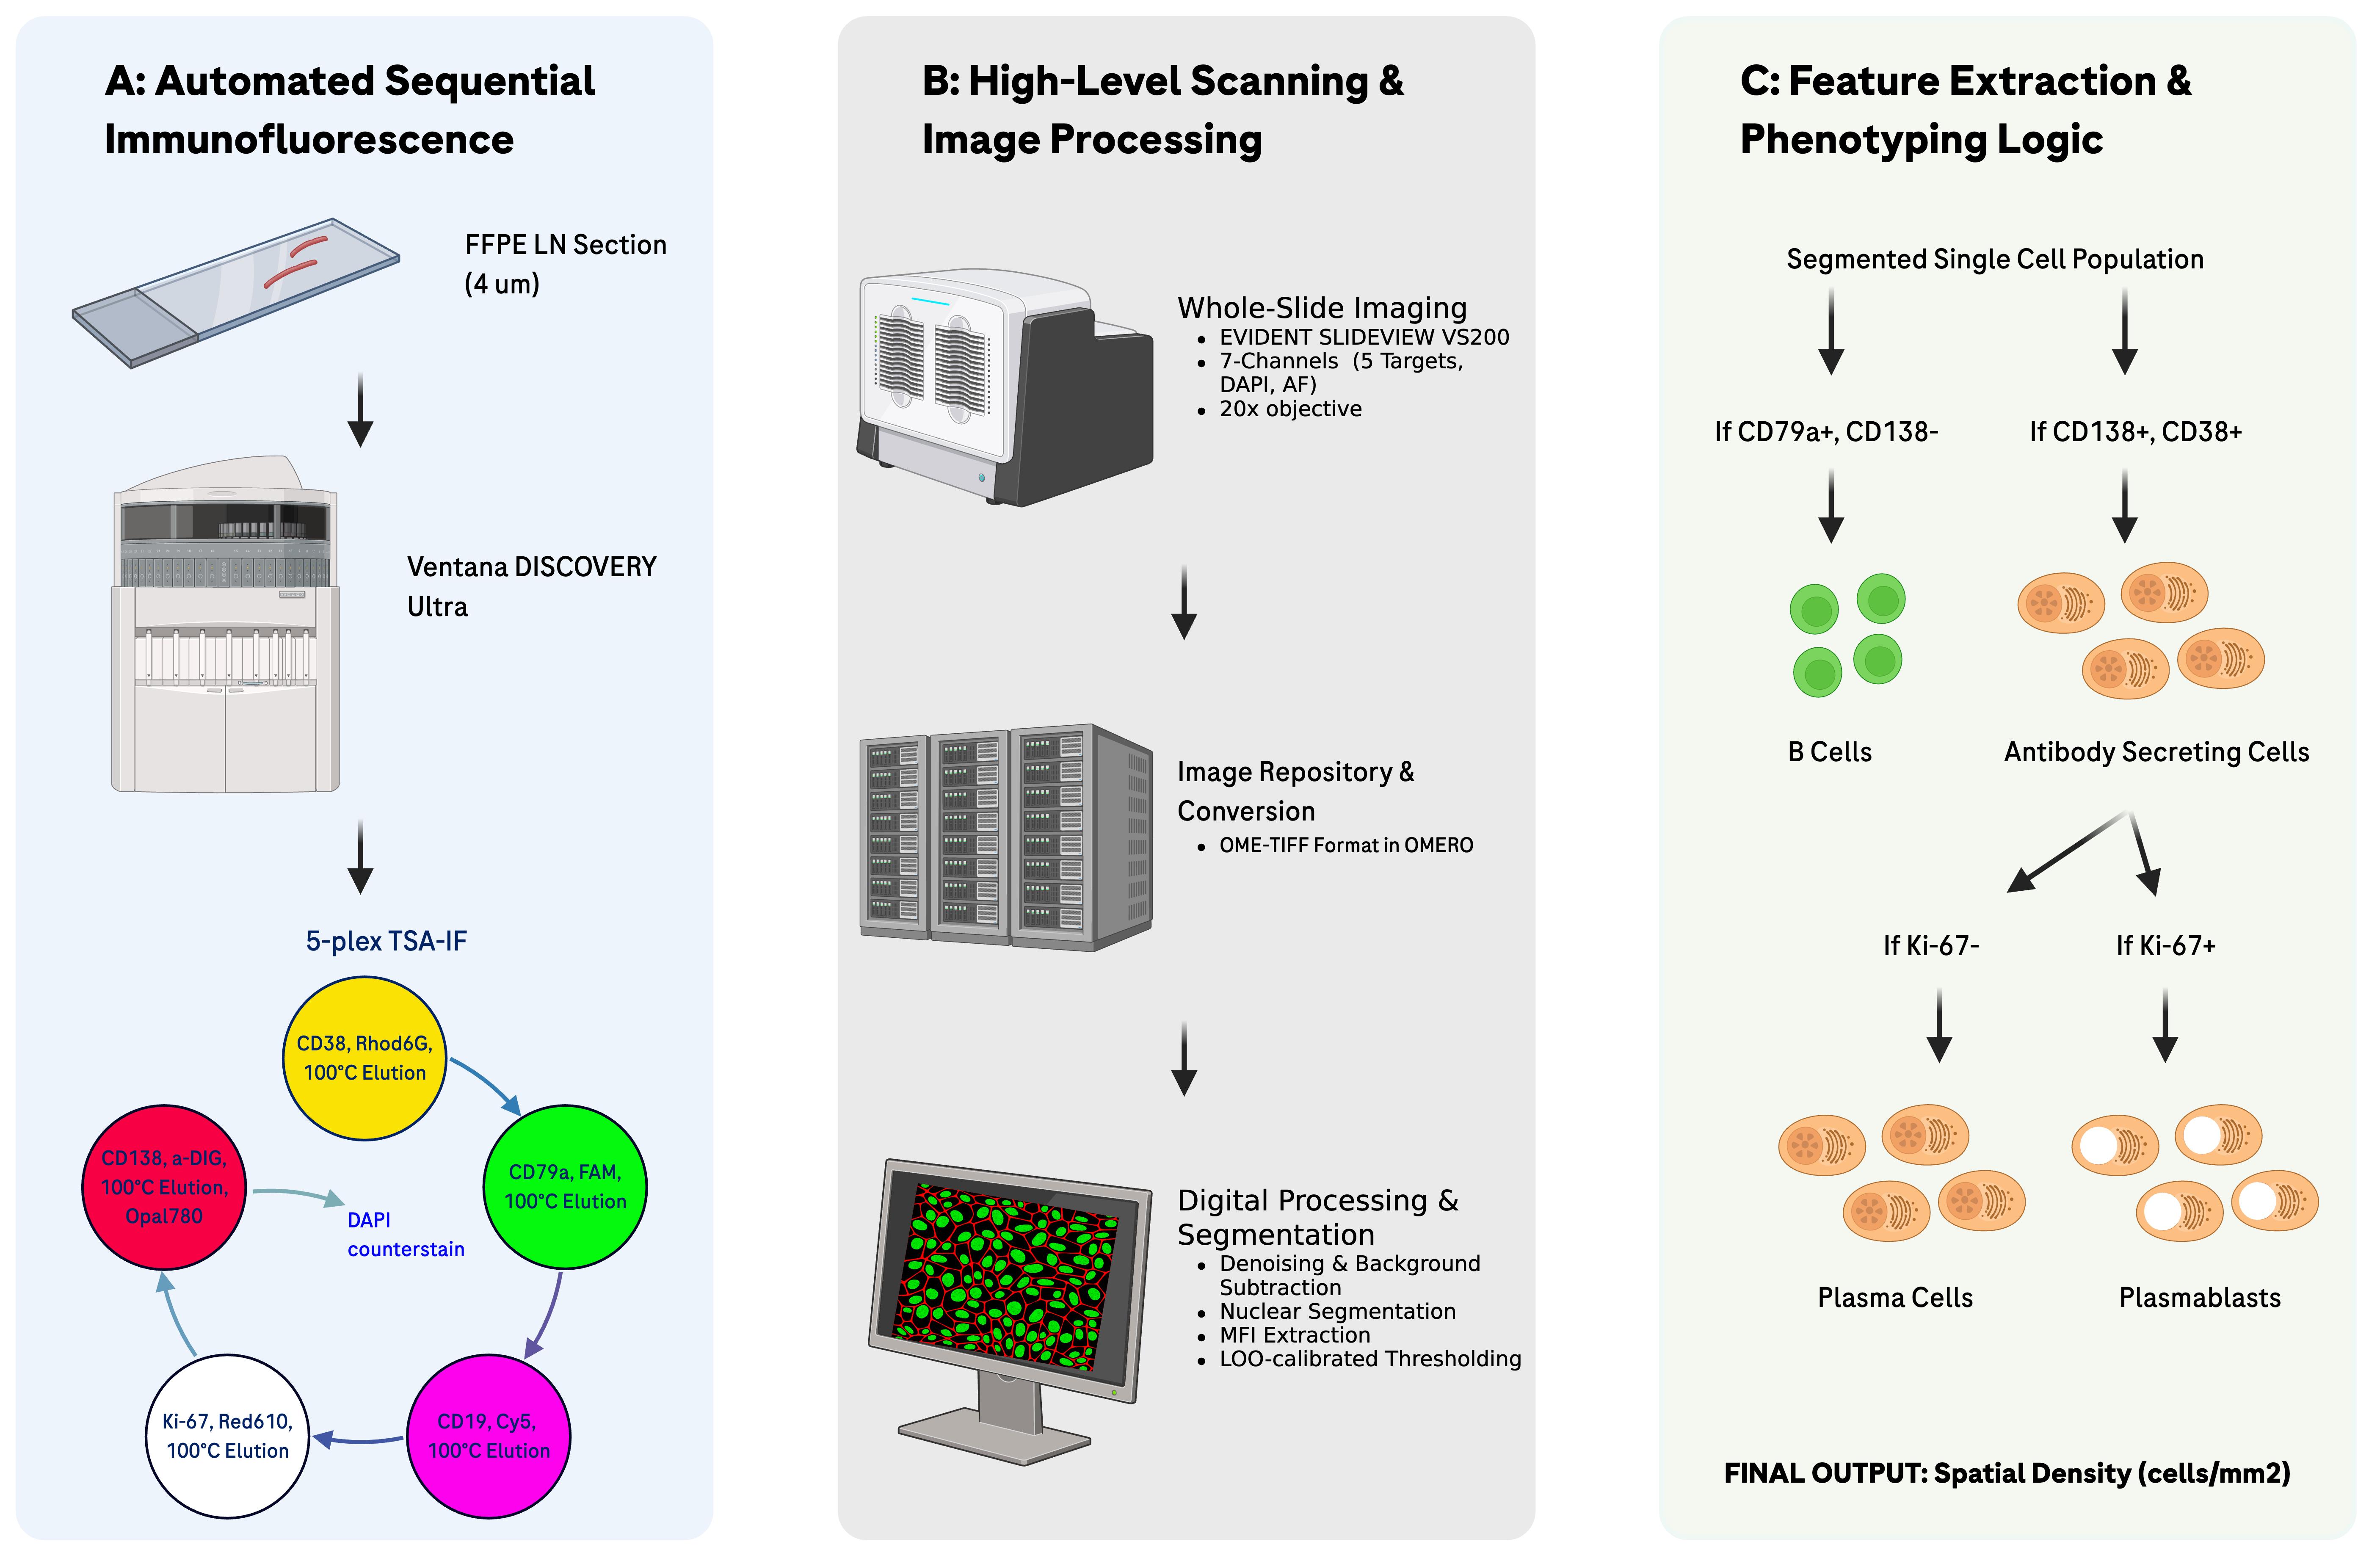
Automated multiplex immunofluorescence and digital phenotyping workflow. (A) Formalin-fixed, paraffin-embedded (FFPE) tissue sections (4 μm) undergo automated 5-plex tyramide signal amplification immunofluorescence (CD38, CD79a, CD19, Ki-67, CD138, plus DAPI) on the Ventana DISCOVERY Ultra. (B) Slides are digitized via 7-channel whole-slide imaging (20×) on the EVIDENT SLIDEVIEW VS200 and imported into OMERO. Digital processing includes median blur filtering, background subtraction, InstanSeg cell segmentation, and single-cell MFI calculation. (C) A decision logic tree classifies segmented single cells into B cells (CD79a+/CD138-) and antibody-secreting cells (ASCs; CD138+/CD38+). ASCs are further stratified into plasma cells (Ki-67-) and plasmablasts (Ki-67+) to yield final spatial densities (cells/mm2).
Background
Accurate spatial enumeration of B-lineage cells within the renal microenvironment is essential for understanding the pathogenesis of lupus nephritis (LN), where B cells and antibody-secreting cells (ASCs), which include plasma cells (PCs) and plasmablasts (PBs), mediate kidney injury [1]. Monitoring these populations in formalin-fixed, paraffin-embedded (FFPE) kidney tissue is critical for evaluating the pharmacodynamic efficacy of B cell–targeted therapies in clinical trials. Traditional immunohistochemical (IHC) approaches often rely on single markers such as CD20 for B cells and CD138 for plasma cells. However, in the context of CD20-directed depletion therapies, CD20 is unreliable for quantifying total B-lineage burden because it can be masked or internalized following therapeutic depletion [2,3]. Additionally, while CD19 is a canonical B-cell marker often used in flow cytometry studies [4], its detection in FFPE tissue lacks the sensitivity required for rigorous quantitative analysis due to poor epitope preservation. CD138 (Syndecan-1), often used as a standalone marker for ASC identification, is unreliable in renal tissue due to substantial endogenous CD138 expression on renal tubular epithelium, creating a significant risk of false-positive ASC identification [5,6]. While high-dimensional spatial platforms offer broad inflammatory cell profiling, they often lack the throughput and quantitative rigor required for precise cell enumeration in large multicenter clinical cohorts. Furthermore, reliance on serial sections for multiple markers is often unfeasible for scarce LN needle biopsy material.
This multiplex protocol (see Graphical overview) provides an automated, sequential tyramide signal amplification (TSA) workflow [7] (CD38, CD79a, CD19, Ki-67, CD138) developed on the Ventana Discovery Ultra platform. Key advantages include establishing CD79a as a requisite anchor, which remains detectable, even when CD20 is lost or masked [8,9], providing far greater sensitivity than CD19 in FFPE sections [10,11]. To ensure specific renal ASC identification, the protocol employs an obligate CD38/CD138 co-labeling strategy to definitively distinguish them from the confounding renal tubular epithelium. Finally, the workflow allows for the efficient use of tissue by combining all markers and InstanSeg-based digital segmentation [12] on a single 4-μm section, maximizing data yield from material-constrained clinical trial samples.
A limitation of this methodology is the requirement for specific automated staining hardware and digital analysis expertise. While validated specifically for LN, this robust, fit-for-purpose workflow is adaptable for any FFPE tissue where high-precision B-lineage enumeration is required. Furthermore, the method is agile and amenable to swapping in or out these markers with other markers of interest.
Materials and reagents
Biological materials
1. FFPE human tissue (validation samples were de-identified clinical remnants acquired from Avaden Biosciences; however, the protocol is broadly applicable to clinical trials, clinical remnants, or other commercial specimens)
a. Target tissue: Designed for lupus nephritis (LN) needle biopsies, but adaptable to other tissue types; if feasible, standardization of fixation (e.g., 16–24 h in 10% neutral buffered formalin at ambient temperature), automated processing, and embedding in histology-grade paraffin is recommended
b. Control tissue: Secondary lymphoid tissue with germinal centers (e.g., palatine tonsil) to validate B-cell maturation spectrum, including B cell (CD19, CD79a), ASC (CD38, CD138), and proliferation Ki-67 markers; tonsillar epithelium provides a reference for the epithelial CD138 expression
Reagents
Note: All reagents should be stored at 4 °C unless otherwise noted.
1. Discovery CC1 (predilute) (Roche Diagnostics, catalog number: 950-500); store at room temperature (RT)
2. DISCOVERY inhibitor (Roche Diagnostics, catalog number: 760-4840)
3. CD38 (clone: SPC32) antibody (Leica Biosystems, catalog number: NCL-L-CD38-290)
4. Bovine serum albumin (BSA) (Fisher Scientific, SKU #501657297)
5. Phosphate-buffered saline (PBS) 1×, sterile-filtered (Life Technologies, SKU #J61196.AP); store at RT
6. Goat Ig block (Roche Diagnostics, catalog number: 760-6008)
7. OmniMap anti-mouse HRP (Roche Diagnostics, catalog number: 760-4310)
8. Discovery Rhodamine 6G (Roche Diagnostics, catalog number: 760-244)
9. Ultra CC2 (Roche Diagnostics, catalog number: 950-223); store at RT
10. CD79a (clone: SP18) antibody (Roche Diagnostics, catalog number: 790-4432)
11. OmniMap anti-rabbit HRP (Roche Diagnostics, catalog number: 760-4311)
12. Discovery FAM (Roche Diagnostics, catalog number: 760-243)
13. CD19 (clone: LE-CD19) antibody (Agilent, catalog number: M7296)
14. Discovery Cy5 (Roche Diagnostics, catalog number: 760-238)
15. Ki-67 (clone: D3B5) antibody (Cell Signaling, catalog number: 12202S); store at -20 °C
16. Discovery Red610 (Roche Diagnostics, catalog number: 760-245)
17. CD138 (clone: B-A38) antibody (Roche Diagnostics, catalog number: 760-4248)
18. Opal 780 Reagent Pack (Akoya Biosciences, catalog number: FP1501001KT); store at -20 °C in powder form
19. DAPI nucleic acid stains (ThermoFisher, catalog number: D1306); store at -20 °C
20. 1× Plus automation amplification diluent (Perkin Elmer, catalog number: FP1609)
21. Antibody diluent/block (Perkin Elmer, catalog number: ARD1001EA)
22. Dawn ultra liquid dish detergent (Procter & Gamble, catalog number: 24386798)
23. ProLong Gold antifade reagent (Invitrogen, catalog number: P36930)
Solutions
1. 3% BSA (see Recipes)
2. CD38 antibody solution (see Recipes)
3. CD19 antibody solution (see Recipes)
4. Ki-67 antibody solution (see Recipes)
5. TSA-DIG stock solution (see Recipes)
6. TSA-DIG working solution (see Recipes)
7. Anti-DIG Opal 780 stock solution (see Recipes)
8. Anti-DIG Opal 780 working solution (see Recipes)
9. DAPI solution (see Recipes)
10. Slide cleaning solution (see Recipes)
Recipes
Notes:
1. Recipes for working antibody solutions and DAPI are calculated for a 10-slide batch. This volume specifically accounts for the 1-mL dead volume required by Ventana reagent dispensers to prevent bubble introduction.
2. All solutions should be stored at 4 °C, except the slide cleaning solution.
1. 3% BSA
| Reagent | Final concentration | Quantity or volume |
|---|---|---|
| BSA | 3% | 30 g |
| PBS | 1× | 1 L |
| Total | n/a | 1 L |
Filter-sterilize (0.2 μm). Stable at 4 °C for up to 1 year.
2. CD38 antibody solution
| Reagent | Final concentration | Quantity or volume |
|---|---|---|
| CD38 stock solution | 46 μg/mL | 20 μL |
| 3% BSA (Recipe 1) | n/a | 1,980 μL |
| Total | 0.46 μg/mL | 2 mL |
Stable at 4 °C for up to 2 weeks.
3. CD19 antibody solution
| Reagent | Final concentration | Quantity or volume |
|---|---|---|
| CD19 stock solution | 83 μg/mL | 20 μL |
| 3% BSA (Recipe 1) | n/a | 1,980 μL |
| Total | 0.83 μg/mL | 2 mL |
Stable at 4 °C for up to 2 weeks.
4. Ki-67 antibody solution
| Reagent | Final concentration | Quantity or volume |
|---|---|---|
| Ki-67 stock solution | 270 μg/mL | 2.22 μL |
| 3% BSA (Recipe 1) | n/a | 1997.78 μL |
| Total | 0.3 μg/mL | 2 mL |
Stable at 4 °C for up to 2 weeks.
5. TSA-DIG stock solution
| Reagent | Final concentration | Quantity or volume |
|---|---|---|
| Opal TSA-DIG | n/a | 1 vial |
| Dimethyl sulfoxide (DMSO) | n/a | 75 μL |
| Total | n/a | 75 μL |
Opal TSA-DIG and DMSO are part of the Opal 780 Reagent Pack. Stable at 4 °C for up to 1 month.
6. TSA-DIG working solution
| Reagent | Final concentration | Quantity or volume |
|---|---|---|
| Opal TSA-DIG stock solution (Recipe 5) | n/a | 20 μL |
| 1× Plus automation amplification diluent | n/a | 1,980 μL |
| Total | 1:100 | 2 mL |
Store at 4 °C; it should be used within 3 weeks of preparation for the best outcome.
7. Anti-DIG Opal 780 stock solution
| Reagent | Final concentration | Quantity or volume |
|---|---|---|
| Anti-DIG Opal 780 | n/a | 1 vial |
| Deionized H2O | n/a | 300 μL |
| Total | n/a | 300 μL |
Anti-DIG Opal 780 is part of the Opal 780 Reagent Pack. Stable at 4 °C for up to 1 month.
8. Anti-DIG Opal 780 working solution
| Reagent | Final concentration | Quantity or volume |
|---|---|---|
| Anti-DIG Opal 780 stock solution (Recipe 7) | n/a | 80 μL |
| Antibody Diluent/Block | n/a | 1920 μL |
| Total | 1:25 | 2 mL |
Prepare in an ASSY, LP PREP KIT dispenser. Store at 4 °C; it should be used within 3 weeks of preparation for the best outcome.
9. DAPI solution
| Reagent | Final concentration | Quantity or volume |
|---|---|---|
| DAPI stock solution | 5 mg/mL | 8 μL |
| Deionized H2O | n/a | 1 mL |
| PBS | 1× | 199 mL |
| Total | 0.2 μg/mL | 200 mL |
Prepare in an ASSY, LP PREP KIT dispenser. Stable at 4 °C for up to 1 month.
10. Slide cleaning solution
| Reagent | Final concentration | Quantity or volume |
|---|---|---|
| Dawn Ultra liquid dish soap | n/a | 50 mL |
| Deionized H2O | n/a | 150 mL |
| Total | 1:4 | 200 mL |
Store at RT.
Laboratory supplies
1. Superfrost Plus glass slides (Thermo Fisher Scientific, Waltham, MA, USA, catalog number 4951PLUS-001 or equivalent)
Critical: Use of high-adhesion slides is critical to prevent tissue detachment during sequential heat-induced epitope retrieval cycles.
2. DISCOVERY, REAGENT DISP. CARD, Detection 1 (Roche Diagnostics, catalog number: 05280192001)
3. DISCOVERY, REAGENT DISP. CARD, Detection 2 (Roche Diagnostics, catalog number: 05280206001)
4. NEXES REAGENT DISP. CARD, CNTRSTAIN 1 (Roche Diagnostics, catalog number: 05271720001)
5. ASSY, LP PREP KIT (Roche Diagnostics, catalog number: 7475144001); brown dispenser to prevent light damage to the solution
6. Nexes Primary Antibody 1 Dispenser (Roche Diagnostics, catalog number: 05269857001)
7. Nexes Primary Antibody 2 Dispenser (Roche Diagnostics, catalog number: 05269865001)
8. Nexes Primary Antibody 3 Dispenser (Roche Diagnostics, catalog number: 05269873001)
9. 24 × 50 mm No. 1 SuperSlip coverslip (VWR, catalog number: 48404-453)
10. Acrodisc PF syringe filter with 0.8/0.2 μm Supor membrane non-pyrogenic, sterile (Pall Life Sciences, catalog number: 4658)
Equipment
1. Desert Chamber Oven (Biocare Medical, model: DRY2008US)
2. Ventana DISCOVERY ULTRA (Roche Diagnostics, catalog number: 05987750001)
3. SLIDEVIEW VS200 Universal Whole Slide Imaging Scanner (EVIDENT, model: VS200), including the following filter cubes:
a. DAPI LED Filter Set 378/52X/BS409/447/60M zeropixel w/ BX3 cube (EVIDENT, model: OSF-DAPIZLEDBX3)
b. CFP Zero LED Filter (EVIDENT, model: OSF-CFPZLEDBX3)
c. FITC LED Filter Set 474/27X/BS495/525/45M zeropixel w/ BX3 cube (EVIDENT, model: OSF-FITCZLEDBX3)
d. ET-Gold/Yellow Filter Set 546/10×, BS556, 572/23M w/ BX3 cube (EVIDENT, model: OCT-49304BX3)
e. ET-Red#1 FISH Filter Set 580/25×, BS600, 625/30M w/ BX3 cube (EVIDENT, model: OCT-49306BX3)
f. ET-CY5 Filter Set 640/30×, BS660, 690/50M w/ BX3 cube (EVIDENT, model: OCT-49009BX3)
g. Cy7 LED Filter Set 735/28×/BS757/809/81M zeropixel w/ BX3 cube (EVIDENT, model: OSF-CY7ZLEDBX3)
Software and datasets
Staining and scanning
1. Ventana NexES, VSS (Roche Diagnostics, version 12.5.4; included with the instrument)
2. VS200 ASW (EVIDENT, version 4.3; included with the instrument)
Data analysis
The digital analysis pipeline described herein (including image processing, segmenting whole-slide images, and single-cell feature extraction) was successfully performed on a high-performance computing node (HPC) with 128 GB RAM, an Intel Xeon Gold 6248 CPU, and an NVIDIA V100 GPU with 32 GB VRAM to efficiently run InstanSeg and handle large OME-TIFF files locally.
1. NGFF-Converter (Glencoe Software, version 2.0.2; freely available at https://www.glencoesoftware.com/products/ngff-converter/)
2. OMERO (Glencoe Software, version OMERO.web 5.29.2; freely available at https://pypi.org/project/omero-web/)
3. InstanSeg (v0.1.0; freely available at https://github.com/instanseg/instanseg)
4. Custom Python analysis scripts (Threshold Explorer and tissue area calculations). Scripts were executed in Python 3.12. The specific repository version 0.1.0, source code, and full environment dependencies (listed in pyproject.toml) are freely available at https://github.com/Genentech/sp_pipeline_public. Please refer to the repository’s README file for the installation of dependencies.
Procedure
A. Protocol setup
Enter the following staining protocol into the VSS software by creating a new procedure and selecting the specified sequence cycles, reagents, temperatures, and incubation times from the Protocol Steps editor’s checkboxes and drop-down menus. Save the protocol so it can be used at a future date for repeated staining.
First sequence
• Deparaffinization
Depar Cycle 1: Warm up slide to 69 °C, and incubate for 8 min
Depar Cycle 2: Incubate for 8 min
Depar Cycle 3: Incubate for 8 min
• Pretreatment
Cell conditioning
CC1 Reservoir (with Discovery CC1)
Warm up slides to 97 °C and incubate for a total of 64 min
• Inhibitor
DISCOVERY Inhibitor
8 min
• Antibody
High Temp Ab incubation
Warm up slides to 37 °C from low temperature
Apply one drop of “CD38 [clone: SPC32]” (antibody solution in dispenser with Nexes Primary Antibody 1 label) and incubate for 32 min
• Multimer HRP
Multimer HRP Blocker
Apply one drop of goat Ig block and incubate for 4 min
Apply one drop of OmniMap anti-mouse HRP and incubate for 16 min
• Rhodamine 6G
Apply one drop of Discovery Rhodamine 6G and incubate for 8 min
Dual sequence
• Antibody denaturation (Critical step)
Antibody denature CC2-1 (with Ultra CC2)
Warm up slide to 100 °C and incubate for 8 min
• DS inhibitor
Neutralize
• DS antibody
Warm up slide to 37 °C from very low temperature
Apply one drop of “CD79a [clone: SP18]” (antibody solution in pre-filled dispenser) and incubate for 16 min
• Multimer HRP
Multimer HRP Blocker
Apply one drop of goat Ig block and incubate for 4 min
Apply one drop of OmniMap anti-rabbit HRP and incubate for 16 min
• DS FAM
Apply one drop of Discovery FAM and incubate for 8 min
Triple stain
• TS antibody denaturation (Critical step)
Antibody denature CC2-2 (with Ultra CC2)
Warm up slide to 100 °C and incubate for 8 min
• TS inhibitor
TS neutralize
• TS antibody
Warm up slide to 37 °C from very low temperature
Apply one drop of “CD19 [clone: LE-CD19]” (antibody solution in dispenser with Nexes Primary Antibody 2 label) and incubate for 60 min
• TS multimer HRP
TS multimer HRP blocker
Apply one drop of goat Ig block and incubate for 4 min
Apply one drop of OmniMap anti-mouse HRP and incubate for 16 min
• TS Cy5
Apply one drop of Discovery Cy5 and incubate for 32 min
Quadruple stain
• QuS antibody denaturation (Critical step)
Antibody denature CC2-3 (with Ultra CC2)
Warm up slide to 100 °C and incubate for 8 min
• QuS inhibitor
QuS neutralize
• QuS antibody
Warm up slide to 37 °C from very low temperature
Apply one drop of “Ki-67 [clone: D3B5]” (antibody solution in dispenser with Nexes Primary Antibody 3 label) and incubate for 60 min
• QuS multimer HRP
QuS multimer HRP blocker
Apply one drop of goat Ig block and incubate for 4 min
Apply one drop of OmniMap anti-rabbit HRP and incubate for 8 min
• QuS Red 610
Apply one drop of Discovery Red610 and incubate for 8 min
Quintuple stain
• QnS antibody denaturation (Critical step)
Antibody denature CC2-4 (with Ultra CC2)
Warm up slide to 100 °C and incubate for 8 min
• QnS inhibitor
QnS neutralize
• QnS antibody
Warm up slide to 37 °C from very low temperature
Apply one drop of “CD138 [clone: B-A38]” (antibody solution in pre-filled dispenser) and incubate for 32 min
• QnS multimer HRP
QnS multimer HRP blocker
Apply one drop of goat Ig block and incubate for 4 min
Apply one drop of OmniMap anti-mouse HRP and incubate for 16 min
• QnS Open Detection Kit
QnS Automated Open Detection
Apply one drop of TSA-DIG working solution (in dispenser with DISCOVERY, REAGENT DISP. CARD, Detection 1 label) and incubate for 8 min
Sextuple stain
• SxS antibody denaturation (Critical step)
Antibody denature CC2-5 (with Ultra CC2)
Warm up slide to 100 °C and incubate for 8 min
• SxS Open Detection Kit
SxS Automated Open Detection
Apply one drop of Anti-DIG Opal 780 working solution (in ASSY, LP PREP KIT dispenser with DISCOVERY, REAGENT DISP. CARD, Detection 2 label) and incubate for 32 min
Note: Opal 780 is highly light-sensitive; use of the opaque brown ASSY, LP PREP KIT dispenser is required.
Counterstain
• Use RB for counterstain
Apply one drop of DAPI (in ASSY, LP PREP KIT dispenser with NEXES REAGENT DISP. CARD, CNTRSTAIN 1 label) and incubate for 16 min
B. Slide staining
1. Bake the 4-μm thick paraffin-embedded tissue sections on glass slides for 30 min at 70 °C in the oven.
2. Print out Ventana labels in the VSS software’s Create Label section. Choose the protocol created in section A and print out one label for each sample slide. Affix the Ventana label onto one end of the sample slides. Load the reagent dispensers onto the Ventana DISCOVERY ULTRA stainer reagent racks. Load the sample slides onto the stainer slide trays with the labeled end pointing into the stainer.
3. Start the automated staining process (total run time is approximately 13–15 h, typically executed as an overnight run).
4. Retrieve slides from the stainer after the staining process is done. Wash the slides with diluted slide cleaning solution until there is no visible liquid coverslip (LCS) oil in the wash water.
5. Coverslip the slides using ProLong Gold antifade reagent with No. 1 SuperSlip coverslip.
a. Lay down the coverslips on a lab wipe.
b. Dispense 100 μL of ProLong Gold onto the coverslip in a line across the long side.
c. Angle the sample slide with the tissue side facing down. Lower the sample slide onto the coverslip, starting from one edge, and slowly roll the slide down to allow the ProLong Gold to spread evenly and avoid bubbles in the ProLong Gold.
d. Tap the side of the slide on the wipe to remove excess ProLong Gold.
e. If there are bubbles visible on the slide, use a pipette tip to gently press on the coverslip and squeeze out the bubbles.
Pause point: The coverslipped slides can be stored in a 4 °C fridge before scanning.
Note: The fluorescence will fade over time. It is best practice to scan the slides within a week of staining.
C. Slide scanning
1. Load the slides into the SLIDEVIEW VS200 scanner.
2. Set the objective lens to 20×.
3. Configure the scanner to capture the following seven fluorescence channels:
a. DAPI (DAPI LED filter) for nuclei.
b. CFP (CFP Zero LED filter) for autofluorescence/background.
c. FAM (FITC LED filter set) for CD79a.
d. Rhodamine 6G (ET-Gold/Yellow filter set) for CD38.
e. Red 610 (ET-Red#1 FISH filter set) for Ki-67.
f. Cy5 (ET-CY5 filter set) for CD19.
g. Cy7 (Cy7 LED filter set) for CD138.
4. Initially set up the IF profile using Single Scan mode.
a. Select the slides first and then choose the profile to use or modify.
b. Scan a small ROI to test the exposure times for each of the channels.
5. Use the Batch Scan for automated slide scanning.
a. Select the slides first and then choose the profile to use.
b. Select ROI. Check focus points locations. Make sure there is tissue below the focusing squares. Move or delete the focus square if there is no tissue underneath.
c. Keep the ROI as close to the tissue as possible to minimize empty space in the scene. Empty spaces will create problems for whole slide image alignment.
d. After the scan is complete, check the focus and exposure.
e. Rescan the slide if:
i. More than 10% of the tissue area on that slide is out of focus.
ii. More than 10% of the pixels in that batch are saturated. Adjust the exposure time and rescan all slides.
Data analysis
All whole slide images were converted from Olympus VSI to OME-TIFF format using Glencoe’s NGFF-Converter software and uploaded to the OMERO open-source image repository for viewing and annotation. Visual inspection and quality assessment of the entire dataset was performed by a pathologist, and the dataset was then processed for single-cell analysis, including nuclear segmentation, cell feature extraction, background and autofluorescence (AF) subtraction, and cell phenotyping. Nuclear segmentation using the DAPI channel was performed using InstanSeg’s pre-trained fluorescence_nuclei_and_cells model, where each individual cell that contains a nucleus was labeled with a unique integer value.
Each fluorescent marker image was denoised by preprocessing using a median blur filter with a disk-shaped 2 × 2 kernel footprint, implemented using the dask-image library in Python. This specific filter was selected to effectively reduce high-frequency background noise (salt-and-pepper noise) that may affect the extraction of each segmented cell’s mean fluorescent intensity (MFI). Background and autofluorescence signal reduction was then performed on each marker channel independently using a pixel-based rolling-ball algorithm (morphological opening) with a 50 × 50 pixel kernel, implemented using the OpenCV library. The background estimate produced by this operation was subtracted from the median-denoised image. After background subtraction, the MFI of each marker was extracted for each segmented cell.
Marker positivity was determined via thresholding by setting cutoff values for each marker independently (including AF) based on selected ROIs in OMERO. Initial cutoff parameters were established by visually identifying the local background noise floor within these ROIs and validating against our biological positive controls (tonsil tissue). Final thresholds were subsequently refined by quantifying segmented cells across the entirety of the corresponding Leave-One-Out (LOO) control slides. Cutoffs were empirically adjusted for each marker to ensure that any residual false-positive events resulting from optical bleedthrough or crosstalk represented a negligible fraction of the true-positive population observed in the fully stained control tissue. The results were visualized and evaluated using a custom Python script called the Threshold Explorer, an interactive tool integrated with OMERO that allows the iterative tuning of marker thresholds and visualization of single-cell marker positivity on whole slide images. Positive cells with high AF values were rejected to reduce false positives. Two independent phenotyping logic trees were implemented in Python to phenotype cells, based on marker positivity: (1) one for B cells (CD79a+/CD138-) (Figure 1, “bc”), and (2) one for plasmablasts (CD138+/CD38+/Ki-67+) (Figure 1, “pb”) and plasma cells (CD138+/CD38+/Ki-67-) (Figure 1, “pc”). Importantly, these definitions were permissive regarding markers not explicitly used for exclusion (e.g., the plasma cell class included all lineage-positive cells regardless of variable expression of CD79a) to ensure capture of activated or proliferating subsets. This resulted in a cell-by-feature table where each row represents an individual cell as determined by cell segmentation, and the columns include the cell’s unique integer label, its centroid, the extracted MFI, and its phenotype.
Tissue detection and area calculations were performed using a custom Python script by applying a Gaussian blur and thresholding on the autofluorescence channel. The code used for the multiplex tissue-based image analysis and to reproduce the findings of this study is available on GitHub at https://github.com/Genentech/sp_pipeline_public. Analysis regions of interest were refined by the manual and automated exclusion of non-tissue whitespace, staining artifacts, and non-renal tissue. The results were integrated with the phenotyping cell counts to generate the final tabularized output of cell counts and densities. Additionally, the proportions of CD79a+ and CD19+ subpopulations comprising each cell class, as well as the proportion of plasmablasts relative to total antibody-secreting cells, were calculated. The cell density of each cell type was calculated and reported for comparison using the following formula:
Representative staining of lupus nephritis kidney biopsies is provided in Figure 1, and final output metrics, including cumulative spatial densities and phenotypic proportions for tonsil and LN tissue, are summarized in Table 1.
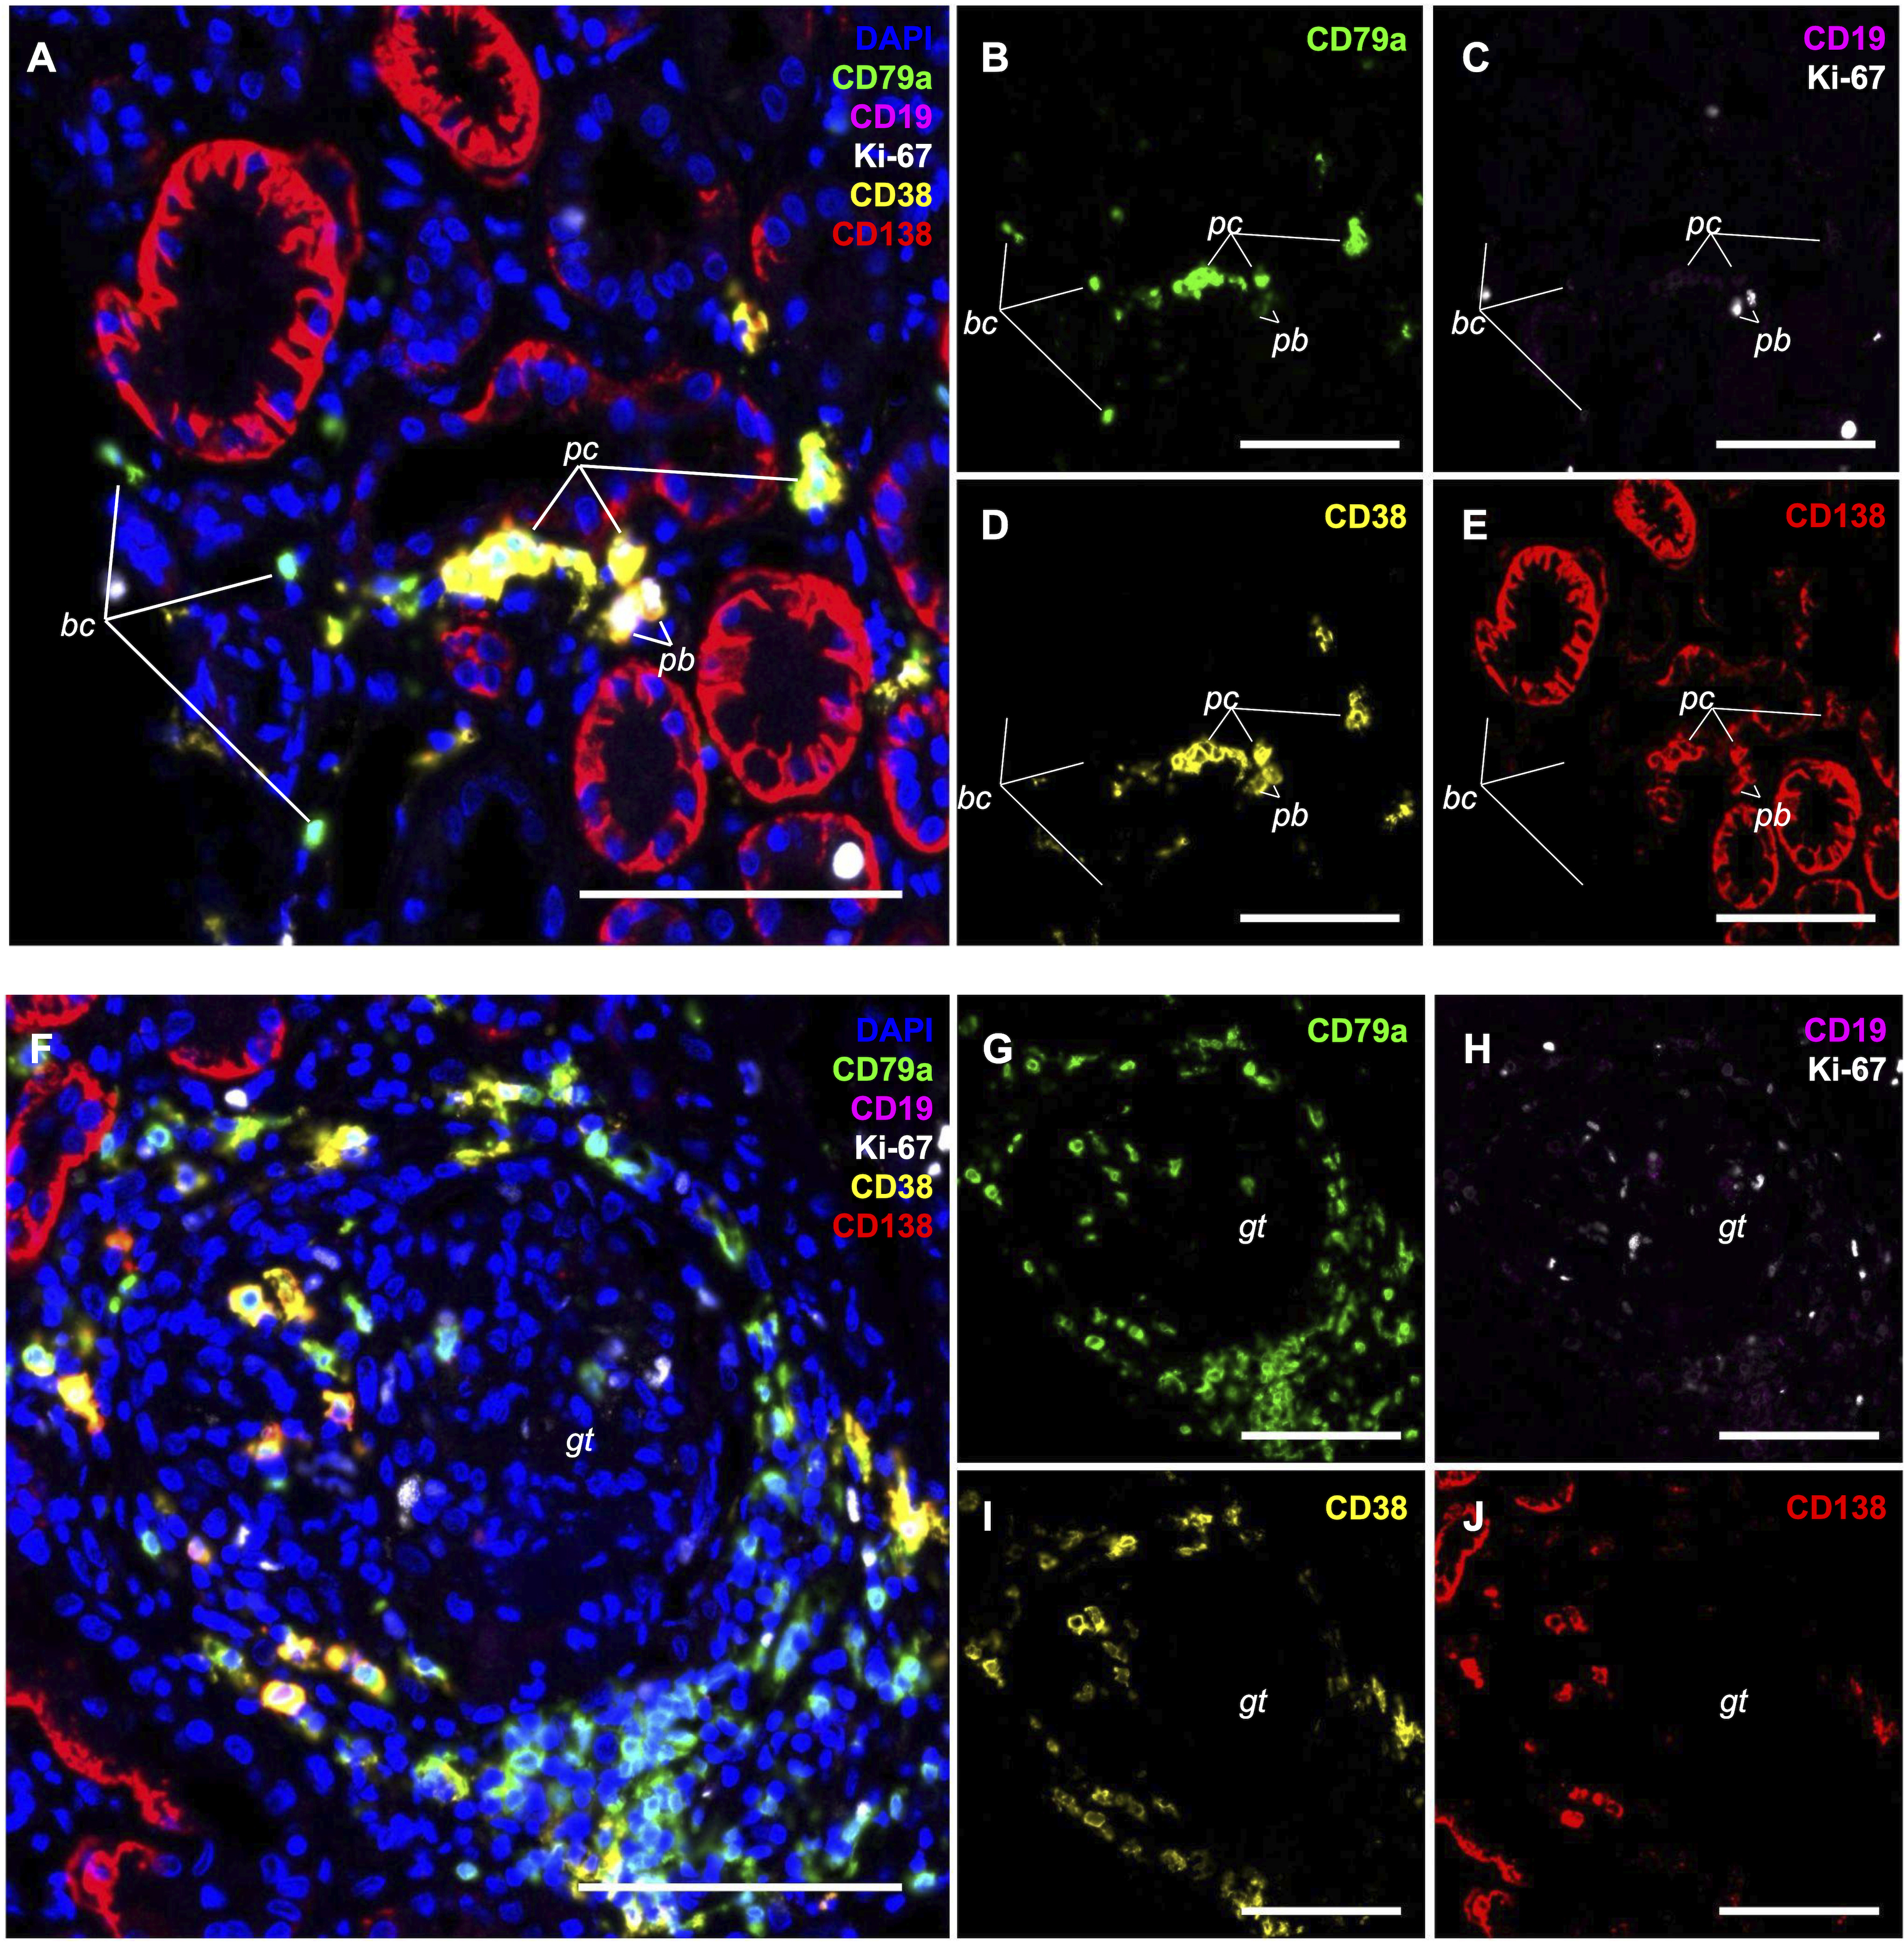
Figure 1. Representative 5-plex immunofluorescence and phenotypic classification in lupus nephritis (LN) kidney. Representative regions of interest (ROIs) from a 4-μm formalin-fixed, paraffin-embedded (FFPE) LN biopsy section illustrate the staining quality and spatial distribution of B-cell and plasma cell lineages. (A–E) Representative tubulointerstitial infiltrate showing a 6-color composite (A) and individual marker channels: CD79a (green), CD19 (magenta), Ki-67 (white), CD38 (yellow), and CD138 (red). (F–J) Representative periglomerular infiltrate, including a glomerular tuft (gt) shown in the composite (F) and individual channels. Specific cell phenotypes are annotated to guide digital analysis: CD79a+/CD138- B cells (bc), CD138+/CD38+/Ki-67- plasma cells (pc), and CD138+/CD38+/Ki-67+ plasmablasts (pb). DAPI (blue) is used as a nuclear counterstain in composites. Scale bars = 100 μm. This figure is adapted from Chan et al. [13] under the terms of the Creative Commons Attribution License (CC BY).
Table 1. Enumerated cells in tonsil and lupus nephritis (LN) kidney tissues by marker-defined class
| Cell classes and marker status | Cumulative TN (N = 2) counts | Cumulative KD (N = 8) counts |
|---|---|---|
| B cells (CD79a+/CD138-) | 355,850 | 3,750 |
| B cells/mm2 tissue | 6,314 | 249 |
| B cells (% all cells) | 45.0% | 3.2% |
| CD19+ B cells (% all B cells) | 15.2% | 2.5% |
| Plasma cells (CD138+/CD38+/Ki-67-) | 31,831 | 3,807 |
| Plasma cells/mm2 tissue | 565 | 253 |
| Plasma cells (% all cells) | 4.0% | 3.3% |
| CD79a+ plasma cells (% plasma cells) | 88.04% | 71.89% |
| Permissively classified plasmablasts (CD38+/Ki-67+) | 3,812 | 282 |
| Permissive plasmablasts/mm2 tissue | 67.6 | 18.7 |
| Permissive plasmablasts (% all cells) | 0.48% | 0.24% |
| CD79a+ permissive plasmablasts (% permissive plasmablasts) | 73.6% | 57.1% |
| Bona fide CD138+ plasmablasts (CD138+/CD38+/Ki-67+) | 3,352 | 212 |
| Bona fide plasmablasts/mm2 tissue | 59.48 | 14.09 |
| Bona fide plasmablasts (% all cells) | 0.42% | 0.18% |
| Bona fide CD138+ plasmablasts (% permissive plasmablasts) | 87.93% | 75.18% |
| Bona fide CD138+ plasmablasts (% Aby-secreting cells) | 9.53% | 5.27% |
| CD79a+/CD138+ B. plasmablasts (% CD138+ B. plasmablasts) | 83.68% | 75.94% |
5-plex immunolabeling on two formalin-fixed, paraffin-embedded (FFPE) TN and eight LN sections was performed, and indicated cell populations classified and enumerated. Raw cumulative cell counts across all TN or LN tissue (bold entries) were tabulated to evaluate the mean frequency of each cell population within each tissue type (non-bold entries). Originally published in and adapted from [13] under the terms of the Creative Commons Attribution License (CC BY).
Validation of protocol
1. Positive tissue controls: FFPE human tonsil or similar lymphoid tissue should serve as the primary biological positive control to confirm appropriate cellular localization and signal specificity for all markers (Figure 2). Normal renal tissue can optionally be used as a second staining control to evaluate the characteristic endogenous CD138 expression on renal tubular epithelium.
a. CD79a: Robustly and uniformly labels B-lineage cells within follicles and extrafollicular regions.
b. CD19: Expect B-lineage cell labeling to be significantly less robust than CD79a, with the strongest signal typically localized within germinal centers.
c. CD138: Robustly labels ASCs (plasma cells and plasmablasts). It also moderately labels epithelium, including tonsillar surface and crypts, and exhibits heterogeneous labeling on renal tubules.
d. CD38: Robustly labels ASCs. It also labels other lymphocyte subsets, including activated B cells (e.g., germinal center centrocytes and memory B cells), NK cells, and activated T cells.
e. Ki-67: Labeling is localized to the nuclei of actively dividing cells (including rare plasmablasts), appearing most prominently as dense clusters of centroblasts within the dark zones of germinal centers.
f. Cell classifications: B cells are classified as CD79a+/CD138-, plasma cells as CD138+/CD38+/Ki-67-, and plasmablasts as CD138+/CD38+/Ki-67+. Notably, many but not all ASCs are CD79a+.
2. Leave-One-Out (LOO) controls: To confirm that the fluorescence signal observed in each channel originates specifically from the intended antibody, a Leave-One-Out (LOO) experiment is conducted on human tonsil tissues (Figure 3). For the 5-plex staining protocol, seven slides are prepared:
a. Full 5-plex staining (positive control): The established protocol with no modifications.
b. Five 4-plex LOOs: Each slide is stained with only four of the five antibodies; the omitted primary antibody is replaced with 3% BSA solution.
c. Five single-plex staining: Each slide is stained with one of the five antibodies.
d. One negative control: All five primary antibodies in the 5-plex protocol are replaced with 3% BSA solution.
Scanning and expected results: All seven slides must be scanned using an identical scanning profile and channel exposure settings to allow for direct comparison of fluorescent intensity. When inspecting the channel where an antibody was omitted, only background autofluorescence should be visible. Any discernible specific signal indicates that the signal of one of the other markers is interfering with that channel.
Interpreting channel-to-channel interference: Unwanted signals generally stem from one or both of two phenomena, as follows:
a. Optical bleedthrough occurs when the emission of one fluorophore is detected in another channel, depending on the degree of spectral overlap of their emission spectra. The bleedthrough will perfectly mirror the spatial pattern and intensity of the signal in the offending (bright) channel. Bleedthrough will similarly be evident on a single-label slide of the offending channel.
b. Detection crosstalk occurs when elution from a prior labeling step is incomplete, leading to unintended signal detection in subsequent steps. This artifact occurs when the primary antibodies are derived from the same host species, allowing the secondary antibody in a later round to bind to any residual primary antibody surviving the elution process. Crosstalk will be absent on a single-label slide of the offending channel.
Acceptance criteria for signal-to-noise: Some degree of autofluorescence background and fluorescence bleedthrough from adjacent channels is unavoidable. The primary consideration is whether the actual target signal can be reliably analyzed. Our guideline dictates that the target signal must be at least three times higher than the background noise (including any bleedthrough signal).
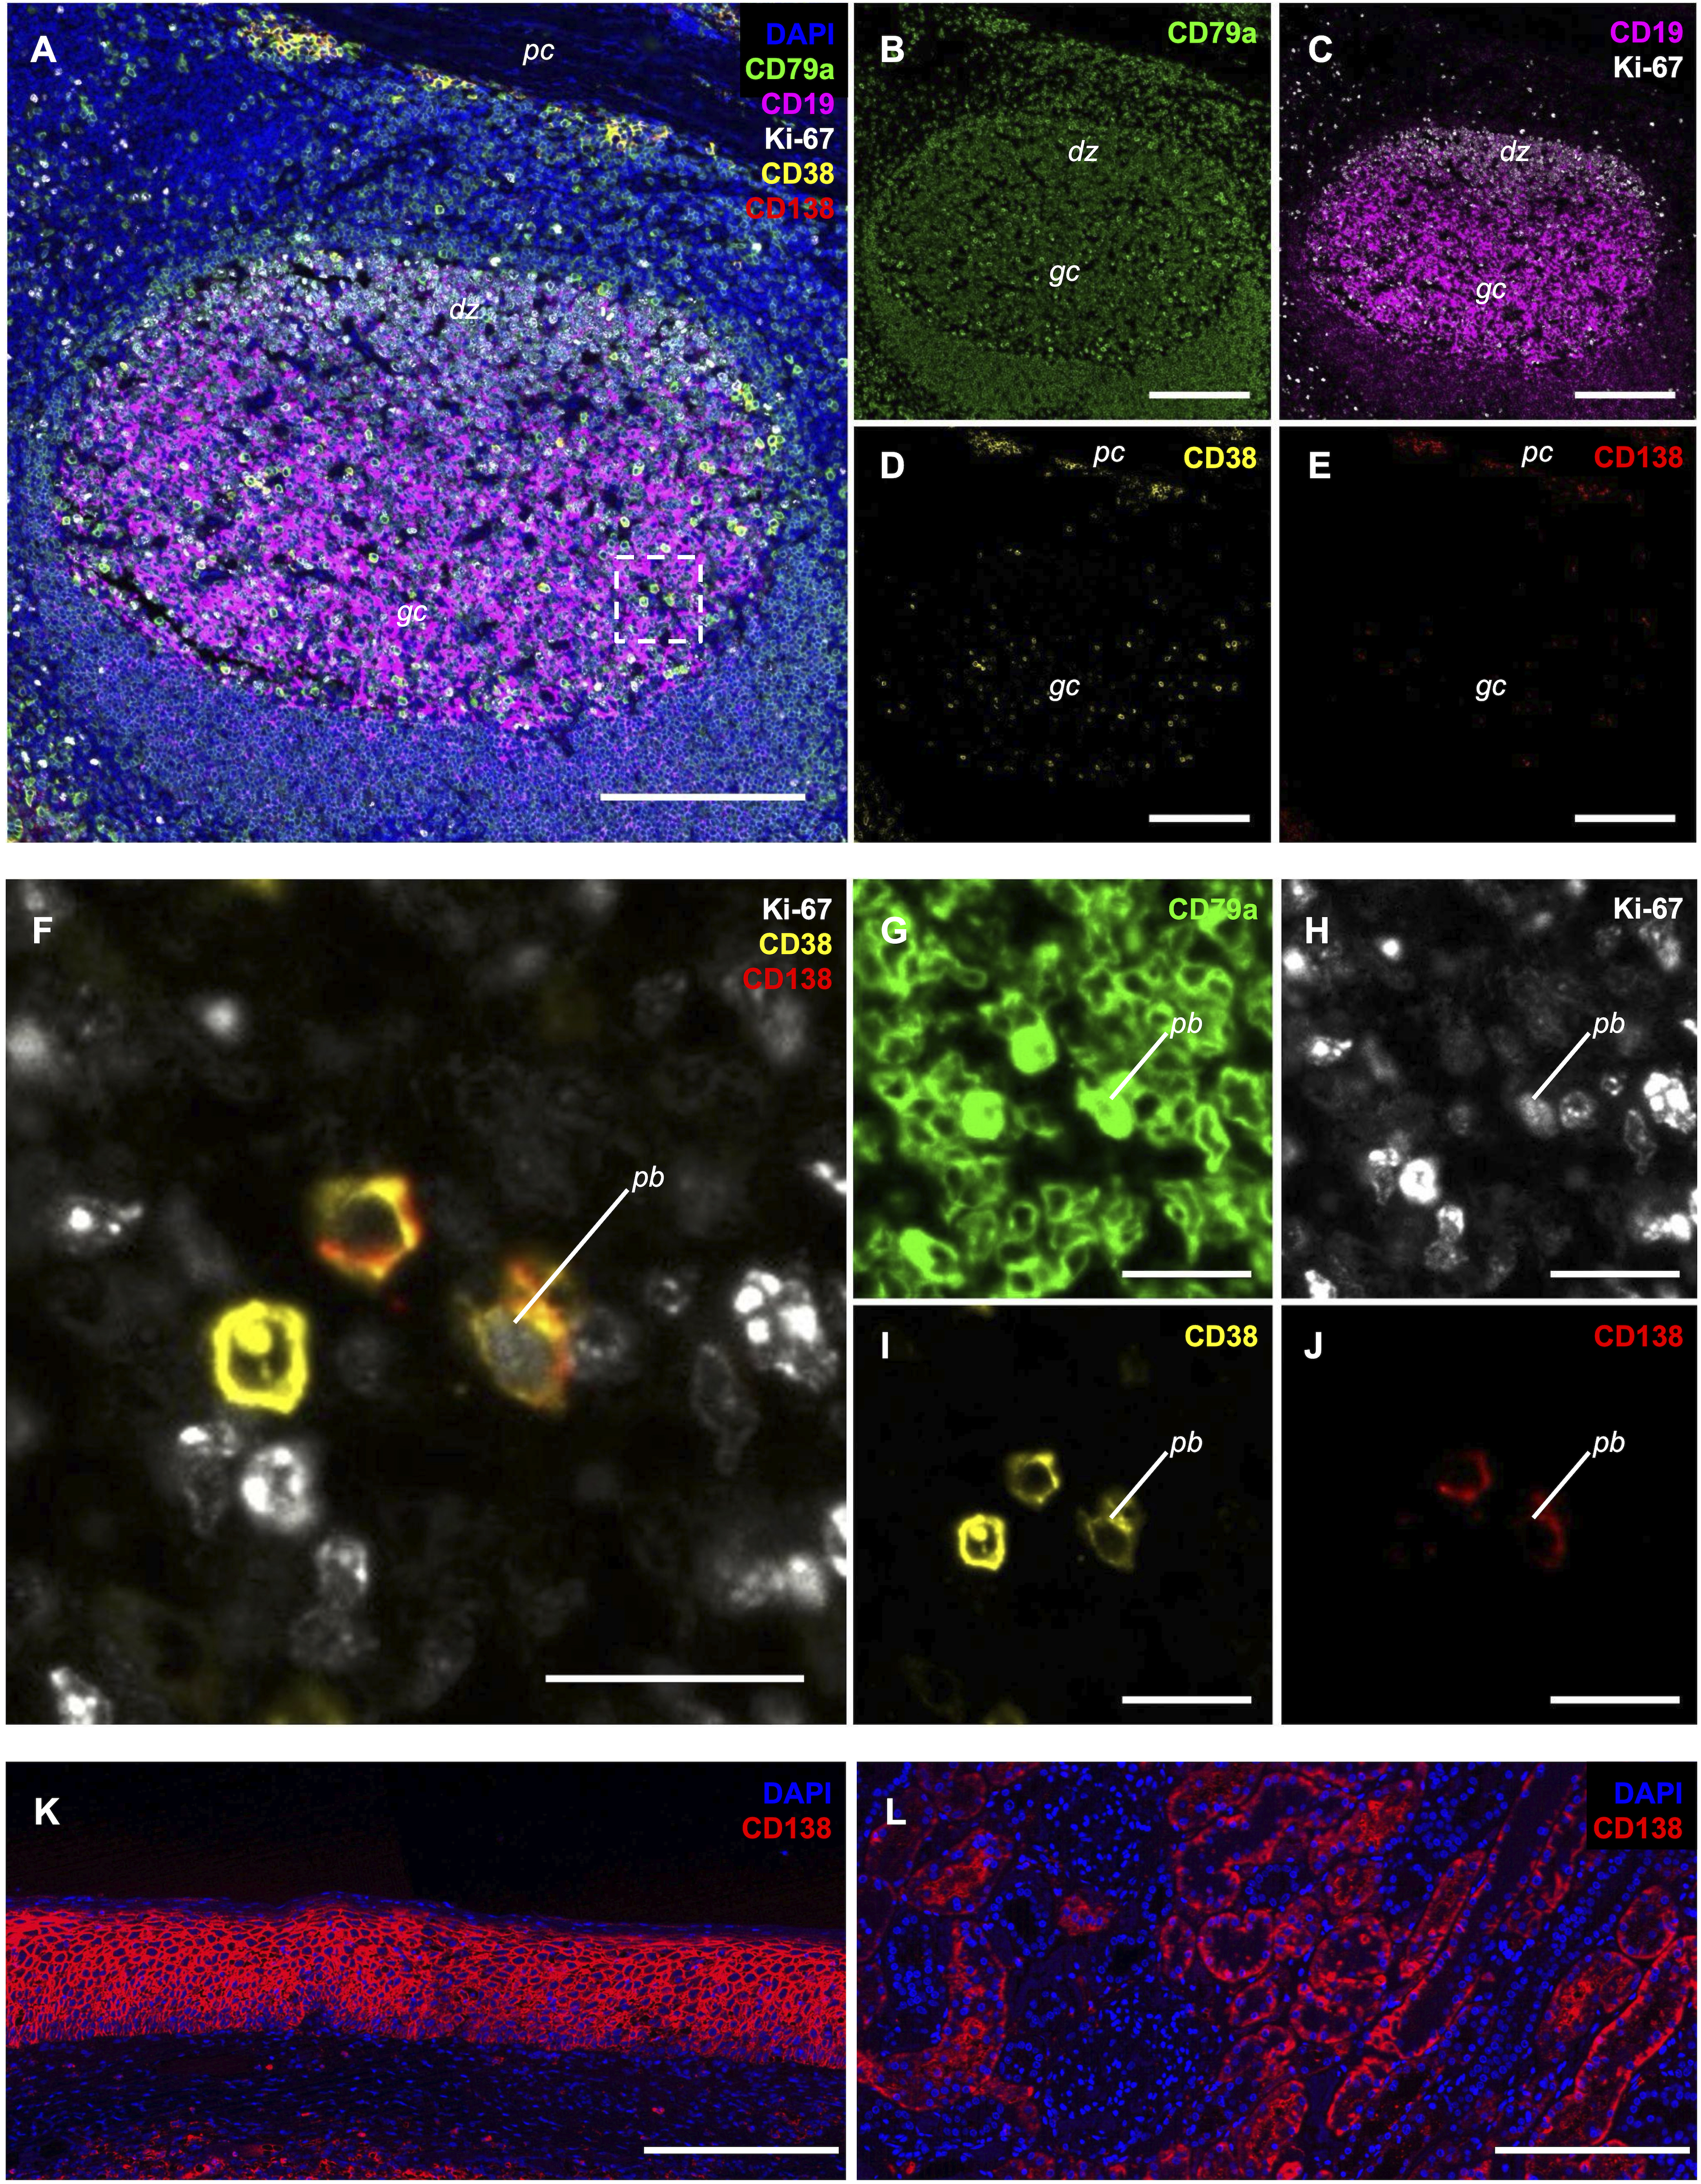
Figure 2. Positive tissue controls and assessment of confounding endogenous CD138 expression. (A–J) 5-plex immunofluorescence immunolabeling on formalin-fixed, paraffin-embedded (FFPE) tonsil sections confirms expected marker localization and expression patterns, serving as the primary biological positive control for the assay. Low magnification views (A–E) and high magnification views (F–J) (inset in A indicates the germinal center region shown in F–J). CD79a (green; A, B, G) immunolabels B lineage cells clustered within follicles and scattered throughout extrafollicular regions. CD19 (magenta; A, C) robustly immunolabels germinal center (gc) B cells but lacks sensitivity for extrafollicular populations. Ki-67 (white; A, C, F, H) immunolabels the nuclei of actively dividing cells, including centroblasts in the dark zone (dz) and rare plasmablasts (pb). CD38 (yellow; A, D, F, I) immunolabels plasma cells (pc) and high expressing activated B cells. CD138 (red; A, E, F, J) immunolabels plasma cells and plasmablasts. Panel (F) is a composite of Ki-67, CD38, and CD138, highlighting a rare bona fide plasmablast (pb) within a germinal center; panels (G–J) show the corresponding single channels. DAPI (blue) is included in the composites (A, K, L) to visualize tissue architecture. (K, L) Anti-CD138 immunoreactivity on tonsillar (K) and renal tubular (L) epithelium (identified by its characteristic morphology of cuboidal cells enclosing a central lumen). This endogenous CD138 expression necessitates the use of CD38 as an obligate co-marker to definitively identify true antibody-secreting cells and prevent false-positive classifications in the renal microenvironment. Scale bars = 200 μm (A–E, K, L) and 25 μm (F–J). This figure is adapted from Chan et al. [13] under the terms of the Creative Commons Attribution License (CC BY).
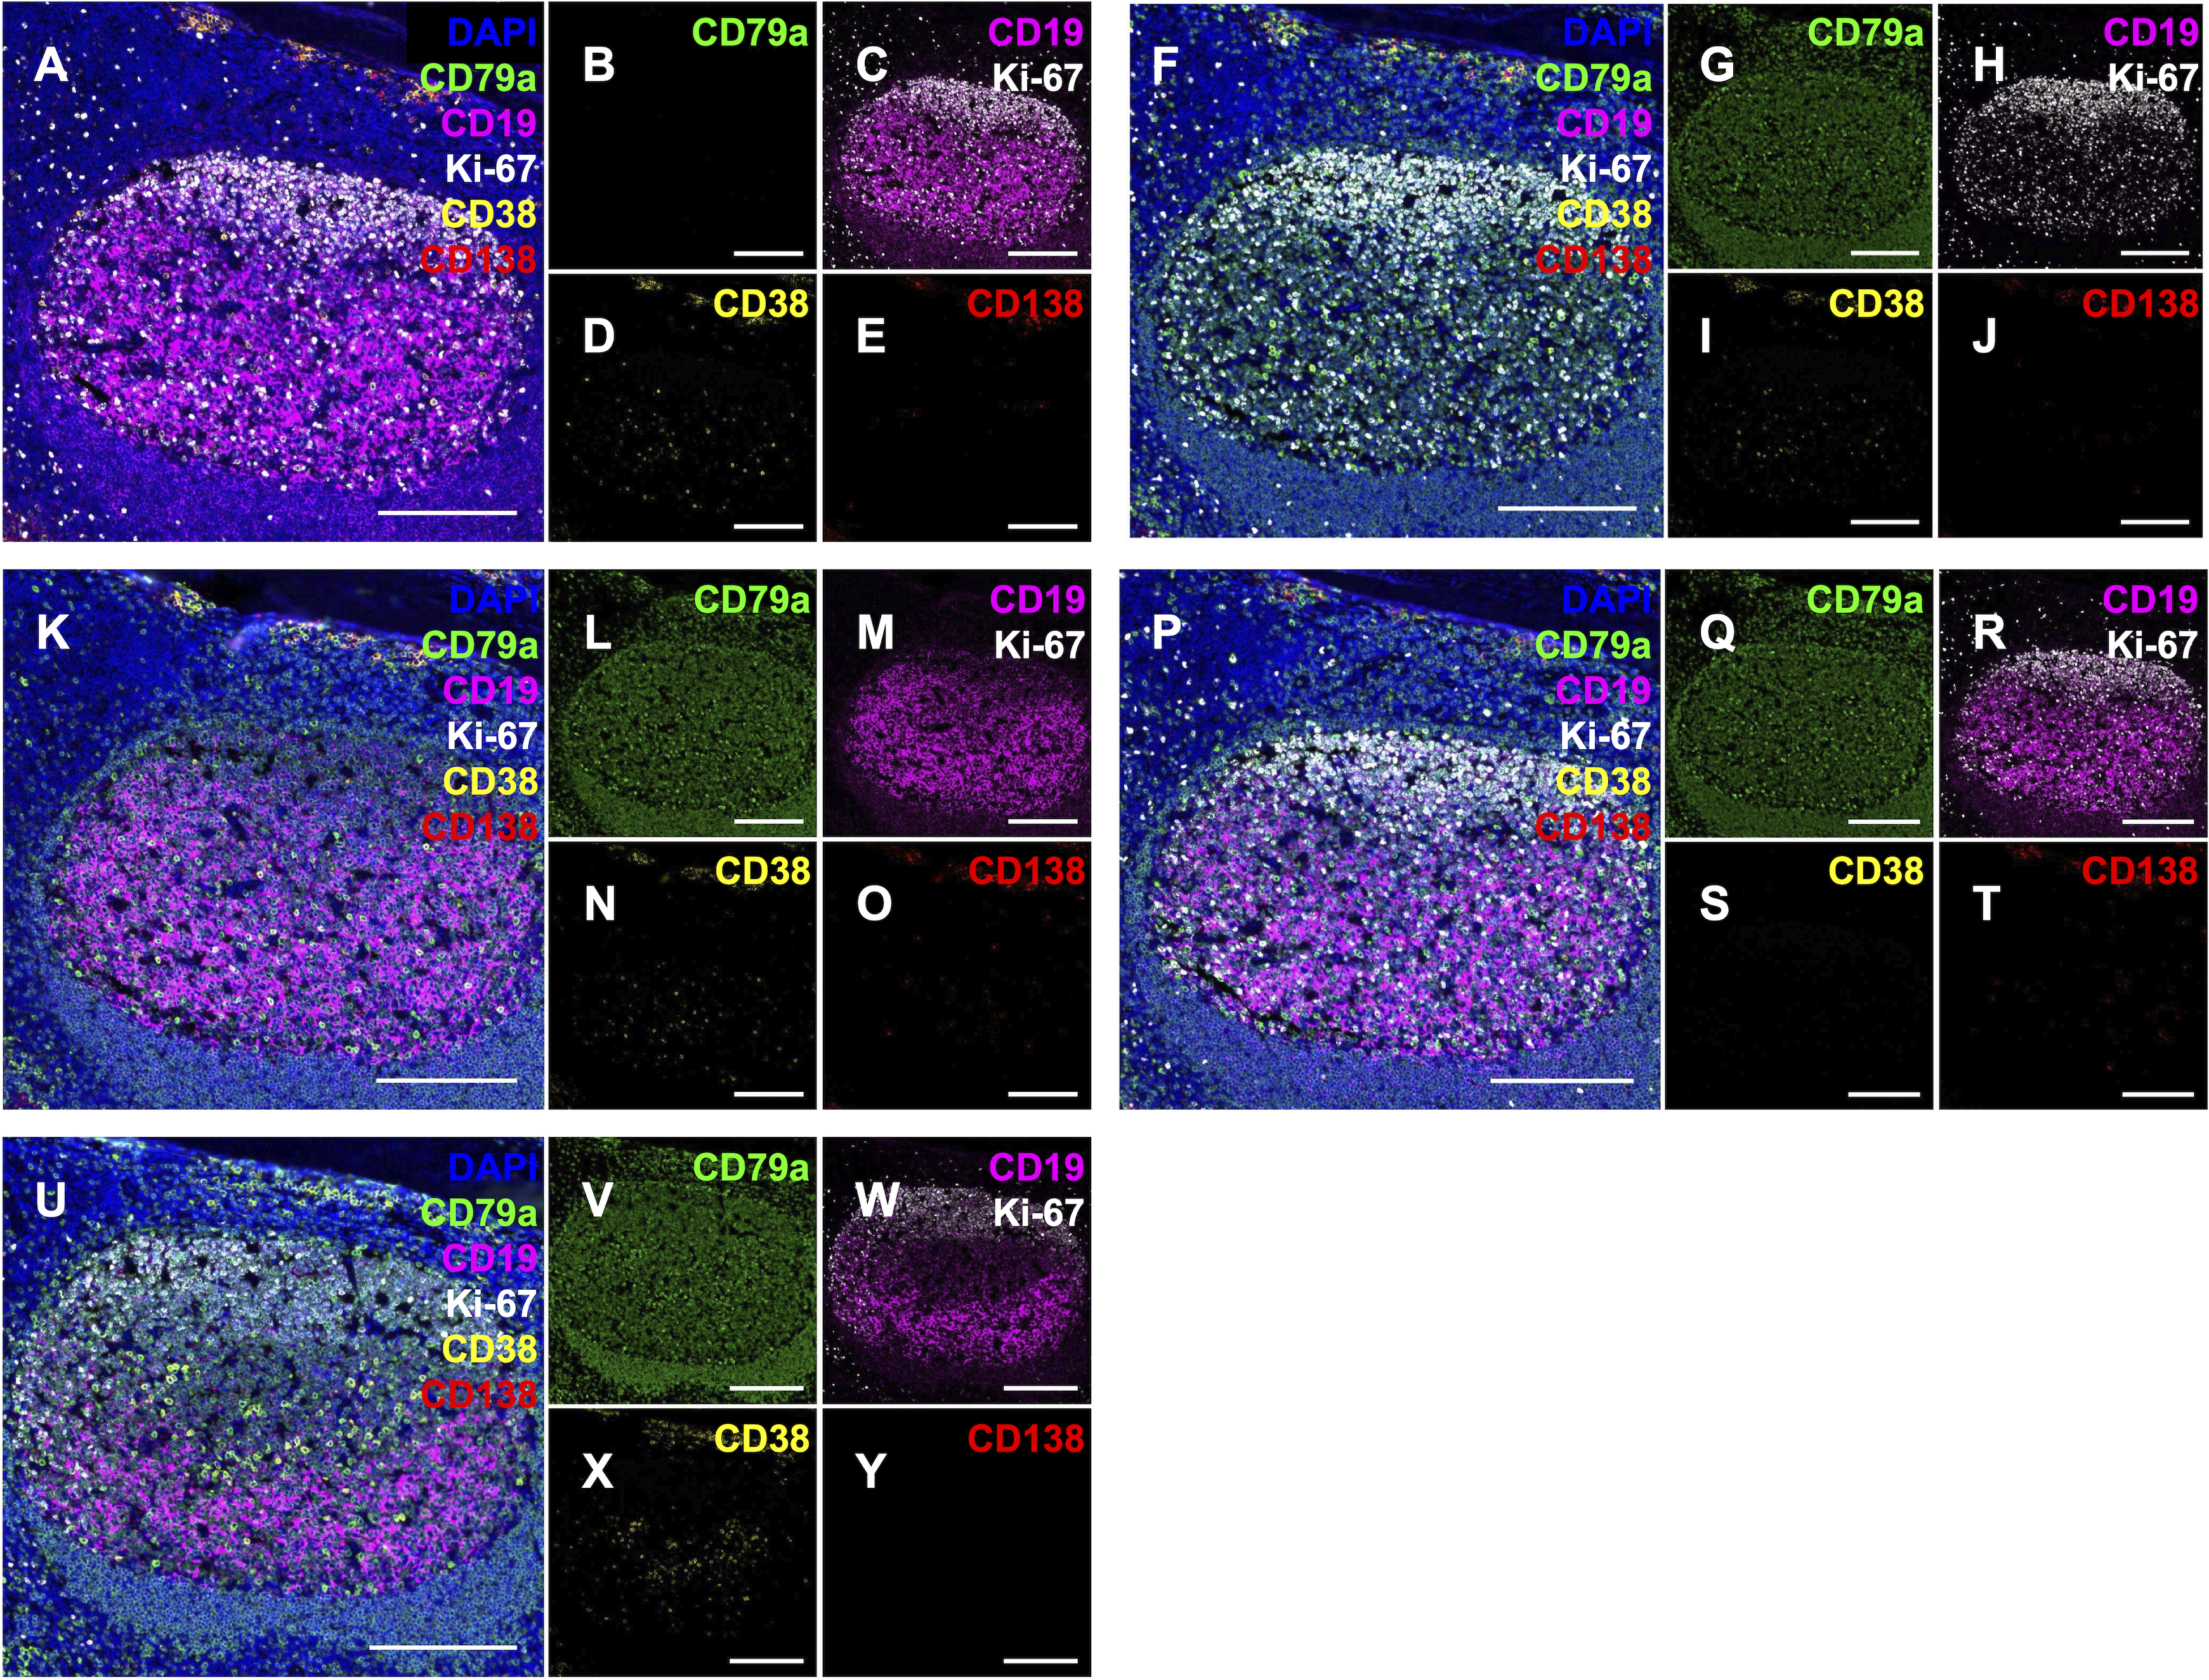
Figure 3. Leave-One-Out (LOO) 5-plex immunofluorescence control immunolabeling. Performed on semi-serial formalin-fixed, paraffin-embedded (FFPE) tonsil sections to confirm the absence of channel-to-channel interference from optical bleedthrough or secondary detection crosstalk. Five control slides are shown, each with one primary antibody omitted from the 5-plex sequence: anti-CD79a (A–E), anti-CD19 (F–J), anti-Ki-67 (K–O), anti-CD38 (P–T), and anti-CD138 (U–Y). Detection channels include: CD79a (green), CD19 (magenta), Ki-67 (white), CD38 (yellow), and CD138 (red). Larger panels (A, F, K, P, U) are 5-plex composites including DAPI (blue) to visualize tissue architecture; smaller panels show single channels to verify the absence of off-target signal, except for dual CD19/Ki-67 displays in panels C, H, M, R, and W. Scale bars = 200 μm. This figure is adapted from Chan et al. [13] under the terms of the Creative Commons Attribution License (CC BY).
General notes and troubleshooting
General notes
1. The Ventana reagent dispenser should have at least 1 mL of volume inside to ensure that a sufficient amount of reagent is applied to the sample slide without introducing bubbles. That is called a dead volume.
Troubleshooting
Problem 1: Tissue sections, especially thin sections, small biopsy fragments, or tissue microarrays (TMAs), may peel, lift, or fold during the staining process. This issue is particularly common in TMAs due to their small, circular core geometry, which offers less adhesive contact.
Possible cause: The multiplex protocol involves repeated cycles of heat and chemical elution that stress the adhesive bonds between the tissue and the slide. The small surface area and exposed edges of TMA cores are easily undercut by buffers, while thin sections are structurally weaker and struggle to withstand the mechanical turbulence from automated reagent dispensing.
Solution: For tissue sections that are susceptible to detachment, it is crucial to bake the slides before starting the automated run. To maximize the tissue-glass bond and ensure exhaustive dehydration, consider extending the baking time to overnight at a lower temperature of 60 °C.
Problem 2: Unwanted channel-to-channel interference is detected on the LOO control slide.
Possible cause: Optical bleedthrough or detection crosstalk. Distinguish between these causes by comparing the problematic LOO slide to a single-plex stained slide of the offending marker imaged under identical conditions. If the interference is present on the single-plex slide and originates from a substantially brighter fluorescence signal, the cause is optical bleedthrough, where an excessively high emission tail from the offending fluorophore passes through the recipient channel’s detection filter. Conversely, if the interference is absent on the single-plex slide, the cause is detection crosstalk. This occurs due to the incomplete heat-induced elution of the primary antibody–HRP complex from a preceding staining round; if the offending and recipient primary antibodies share the same host species, the secondary antibody in the subsequent round will inappropriately bind to these non-eluted residual complexes.
Solution: Corrective actions depend on the identified root cause. For optical bleedthrough, either decrease the offending channel’s primary antibody concentration or incubation time to minimize spectral spillover, and/or increase the recipient channel’s primary antibody concentration to enable lower exposure settings that reduce sensitivity to the offending emission tail. For detection crosstalk, extend the preceding round’s heat-induced elution time in CC2 buffer to ensure complete stripping of the prior antibody–HRP complex. If crosstalk persists, decrease the preceding round’s primary antibody concentration or incubation time to reduce the initial detection complex burden. As with optical bleedthrough, increasing the primary antibody concentration in the recipient channel also improves the overall signal-to-noise ratio.
Problem 3: Unmitigated optical bleedthrough is observed during broader assay deployment, forcing artificially high positivity thresholds that risk excluding dim target signals.
Possible cause: High biological heterogeneity in large sample cohorts. Unexpected extremes in target expression can produce intense fluorescent signals and spectral spillover that exceed the capacity of wet-lab mitigations established during pilot testing.
Solution: Apply a proportional pixel subtraction method post-acquisition. Generate compensated images by subtracting a fraction of the offending channel’s pixel intensity from the corresponding pixel in the recipient channel. Determine this subtraction multiplier empirically using the corresponding LOO control slide. Adjust the fraction until the bleedthrough artifact is eliminated without over-subtraction. This LOO-calibrated correction computationally clears the interference across the experimental cohort, safely restoring classification sensitivity for weakly expressing cells.
Problem 4: Inconsistent DAPI staining quality of selected slides interferes with automated cell segmentation.
Possible cause: The multiple heat denaturation steps in the sequential protocol may induce partial and reversible melting of double-stranded DNA, interfering with DAPI staining.
Solution: Re-stain impacted slides with DAPI. If impacted slides are identified after coverslipping, gently remove the coverslip by extended soaking in PBS and then apply fresh DAPI. This simple re-staining procedure restores the nuclear counterstain.
Problem 5: Outlier slides with high nonspecific CD38 staining, obscuring CD38+ cell classification.
Possible cause: Preanalytical variables, such as inconsistencies in tissue handling, fixation, processing, or storage, altering epitope presentation or increasing nonspecific background binding of anti-CD38.
Solution: Strictly standardize all preanalytical tissue handling steps to minimize these outliers and perform rigorous QC on all stained slides prior to digital analysis to disqualify affected samples. If a high proportion of slides fail CD38 QC, pivot the ASC classification strategy away from CD38 to a lineage-anchored CD79a+/CD138+ signature. Because more than half of ASCs retain CD79a expression, this proxy strategy successfully rescues the analysis by enabling reliable evaluation of the majority of the ASC pool. To execute this secondary data analysis workflow, users simply modify the Python phenotyping script to redefine the ASC logic tree (Figure 1C) as CD79a+/CD138+, effectively bypassing the compromised CD38 channel.
Problem 6: Machine error messages and audible alerts on the VSS platform during the pre-run check, blocking the run from initiating.
Possible cause: These initialization blocks generally fall into two categories: user-correctable system errors or hardware failures. Common user-correctable errors include insufficient tests with the loaded reagent dispensers, protocol changed after the label was printed, or inadequate volumes of bulk reagents for the full multi-cycle run. Conversely, deeper mechanical issues will explicitly prompt the users via an on-screen error message to contact technical support.
Solution: For user-correctable errors, trained lab personnel can follow the on-screen diagnostic prompts to rectify the underlying issue. This includes adding additional pre-filled reagent dispensers to meet the run’s volumetric requirements, applying updated dispenser barcode labels for the custom-filled reagents, re-printing the corrected slide labels, or replenishing bulk reagent reservoirs. Once these adjustments are complete, dismiss the error messages within the VSS interface and restart the pre-run check. Critical hardware failures that cannot be cleared through these manual adjustments typically require a service visit from a Ventana field service engineer.
Acknowledgments
Funding sources: All work was funded by Genentech, Inc. The authors thank Sreedevi Chalasani and Janet Tao for their help in developing the staining protocol, Harini Raghu for scientific input, Margaret Solon and Tyler Risom for editorial input on the manuscript, and the Genentech Research Pathology Core Laboratories (Human Tissue Laboratory, Histopathology Laboratories, and the Digital & Spatial Laboratories) for their support.
Graphical overview was created in BioRender. Austin, C. (https://BioRender.com/r52uczp), licensed under CC BY 4.0.
Author contributions
Specific contributions: Conceptualization, C.D.A.; Investigation, P.C., C.C.; Writing—Original Draft, P.C., C.C., C.D.A.; Writing—Review & Editing, R.J., S.R., C.D.A.
Competing interests
All authors are employees of Genentech, a member of the Roche Group, and may hold stock or stock options in F. Hoffmann-La Roche Ltd. The Ventana DISCOVERY Ultra instrument and associated reagents utilized in this protocol are manufactured by Ventana Medical Systems, Inc., which is also a member of the Roche Group.
Ethical considerations
The human tissues used to validate this protocol were de-identified, archival specimens acquired from Avaden Biosciences. These specimens were procured in full compliance with HIPAA, IRB protocols, and The Common Rule, with written informed consent for research use obtained by the vendor at the time of collection. Because this protocol utilizes the secondary use of de-identified archival specimens, the requirement for ethical approval by a specific Institutional Review Board (IRB) was waived under US Federal Regulation 45 CFR 46.104(d)(4).
References
- Anders, H. J., Saxena, R., Zhao, M., Parodis, I., Salmon, J. E. and Mohan, C. (2020). Lupus nephritis. Nat Rev Dis Prim. 6(1): 7. https://doi.org/10.1038/s41572-019-0141-9
- Beers, S. A., Chan, C. H., French, R. R., Cragg, M. S. and Glennie, M. J. (2010). CD20 as a Target for Therapeutic Type I and II Monoclonal Antibodies. Semin Hematol. 47(2): 107–114. https://doi.org/10.1053/j.seminhematol.2010.01.001
- Lim, S. H., Vaughan, A. T., Ashton-Key, M., Williams, E. L., Dixon, S. V., Chan, H. T. C., Beers, S. A., French, R. R., Cox, K. L., Davies, A. J., et al. (2011). Fc gamma receptor IIb on target B cells promotes rituximab internalization and reduces clinical efficacy. Blood. 118(9): 2530–2540. https://doi.org/10.1182/blood-2011-01-330357
- Debord, C., Wuillème, S., Eveillard, M., Theisen, O., Godon, C., Le Bris, Y. and Béné, M. C. (2020). Flow cytometry in the diagnosis of mature B‐cell lymphoproliferative disorders. Int J Labor Hematol. 42: 113–120. https://doi.org/10.1111/ijlh.13170
- Ozcan, A., Celik, E., Karslioglu, Y. and Basal, S. (2011). Cd138 expression in renal tumors and its usage in the differential diagnosis. Turk J Pathol. 27(2): 110. https://doi.org/10.5146/tjpath.2011.01058
- Celie, J. W., Katta, K. K., Adepu, S., Melenhorst, W. B., Reijmers, R. M., Slot, E. M., Beelen, R. H., Spaargaren, M., Ploeg, R. J., Navis, G., et al. (2012). Tubular epithelial syndecan-1 maintains renal function in murine ischemia/reperfusion and human transplantation. Kidney Int. 81(7): 651–661. https://doi.org/10.1038/ki.2011.425
- Stack, E. C., Wang, C., Roman, K. A. and Hoyt, C. C. (2014). Multiplexed immunohistochemistry, imaging, and quantitation: A review, with an assessment of Tyramide signal amplification, multispectral imaging and multiplex analysis. Methods 70(1): 46–58. https://doi.org/10.1016/j.ymeth.2014.08.016
- Kennedy, G. A., Tey, S., Cobcroft, R., Marlton, P., Cull, G., Grimmett, K., Thomson, D. and Gill, D. (2002). Incidence and nature of CD20‐negative relapses following rituximab therapy in aggressive B‐cell non‐Hodgkin's lymphoma: a retrospective review. Br J Haematol. 119(2): 412–416. https://doi.org/10.1046/j.1365-2141.2002.03843.x
- Looney, C. M., Schroeder, A., Tavares, E., Garg, J., Schindler, T., Vincenti, F., Redfield, R. R., Jordan, S. C., Busque, S., Woodle, E. S., et al. (2023). Obinutuzumab Effectively Depletes Key B-cell Subsets in Blood and Tissue in End-stage Renal Disease Patients. Transplant Direct. 9(2): e1436. https://doi.org/10.1097/txd.0000000000001436
- Mason, D., Cordell, J., Brown, M., Borst, J., Jones, M., Pulford, K., Jaffe, E., Ralfkiaer, E., Dallenbach, F., Stein, H., et al. (1995). CD79a: a novel marker for B-cell neoplasms in routinely processed tissue samples. Blood. 86(4): 1453–1459. https://doi.org/10.1182/blood.v86.4.1453.bloodjournal8641453
- Chu, P. G. and Arber, D. A. (2001). CD79: A Review. Appl Immunohistochem Mol Morphol. 9(2): 97–106. https://doi.org/10.1097/00129039-200106000-00001
- Goldsborough, T., Philps, B., O’Callaghan, A., Inglis, F., Leplat, L., Filby, A., Bilen, H. and Bankhead, P. (2024). InstanSeg: an embedding-based instance segmentation algorithm optimized for accurate, efficient and portable cell segmentation. arXiv. https://doi.org/10.48550/arxiv.2408.15954
- Chan, C., Chang, P. S., Chalasani, S., Tao, J., Raghu, H. and Austin, C. D. (2026). Resolving the renal microenvironment: a 5-plex immunofluorescence workflow to quantify B-lineage cells in FFPE lupus nephritis biopsies. Front Immunol. 17: e1774536. https://doi.org/10.3389/fimmu.2026.1774536
Article Information
Publication history
Received: May 29, 2026
Accepted: Jul 20, 2026
Available online: Aug 12, 2026
Published: Sep 5, 2026
Copyright
© 2026 The Author(s); This is an open access article under the CC BY-NC license (https://creativecommons.org/licenses/by-nc/4.0/).
How to cite
Chang, P. S., Chan, C., Jesudason, R., Rost, S. and Austin, C. D. (2026). An Automated, Ventana Discovery Platform-based Imaging Workflow for Simultaneous Quantification of B Cells, Plasma Cells, and Plasmablasts in FFPE Human Tissues. Bio-protocol 16(17): e5797. DOI: 10.21769/BioProtoc.5797.

 Download Citation in RIS Format
Category
Immunology > Immune cell staining > Immunodetection
Cell Biology > Tissue analysis > Tissue staining
Bioinformatics and Computational Biology
Do you have any questions about this protocol?
Post your question to gather feedback from the community. We will also invite the authors of this article to respond.
 Post a Question


