


- Protocols

- Articles and Issues
- For Authors
- About
- Become a Reviewer


Chemoenzymatic Labeling Method for Detection of O-GlcNAcylated α-Synuclein Proteins by Western Blot

Published: Vol 16, Iss 10, May 20, 2026 DOI: 10.21769/BioProtoc.5692 Views: 359
Reviewed by: Elena A. OstrakhovitchWeidong AnAnonymous reviewer(s)
 PDF
PDF  Ask a question
Original research article
The authors used this protocol in:
Oct 2025
Advertisement



Protocol Collections
Comprehensive collections of detailed, peer-reviewed protocols focusing on specific topics




Related protocols
Abstract
α-Synuclein (α-syn) aggregation has emerged as a key pathogenetic feature in several neurodegenerative disorders. The α-syn protein has various conformational strains, each with unique structural features that influence their cytotoxicity, propagation, and neuroinflammation. A post-translational modification known as O-GlcNAcylation has been found to influence the toxicity of α-syn and its propensity to aggregate. Difficulties in detecting and quantifying this modification are a major challenge to understanding its roles among the conformational forms of α-syn. We now describe a protocol for detecting O-GlcNAcylated α-syn that combines a click chemistry labeling approach and western blotting. This chemoenzymatic method involves the transfer of azido-modified galactose (GalNAz) from UDP-GalNAz to O-GlcNAcylated proteins, enabling their further functionalization with alkyne-containing polyethylene glycol of defined molecular weight. This protocol facilitates the determination of the glycosylation status of varying conformations of α-syn and their stoichiometric ratios.
Key features
• The method outlines a chemoenzymatic mass-tagging approach for the identification and quantification of O-GlcNAcylated α-syn.
• The process involves using GalT 289L for GalNAz transfer, followed by PEG mass tag conjugation, and then subjected to western blotting.
• Visualizable modified α-syn with a noticeable molecular weight shift, enabling estimation of its relative stoichiometry.
• This protocol provides a rapid and simple strategy that can be completed within two or three days.
Keywords: Post-translational modifications O-GlcNAc modification
α-Synuclein
β-1,4-galactosyltransferase 1
Western blot
O-GlcNAc modification
α-Synuclein
β-1,4-galactosyltransferase 1
Western blot
Graphical overview
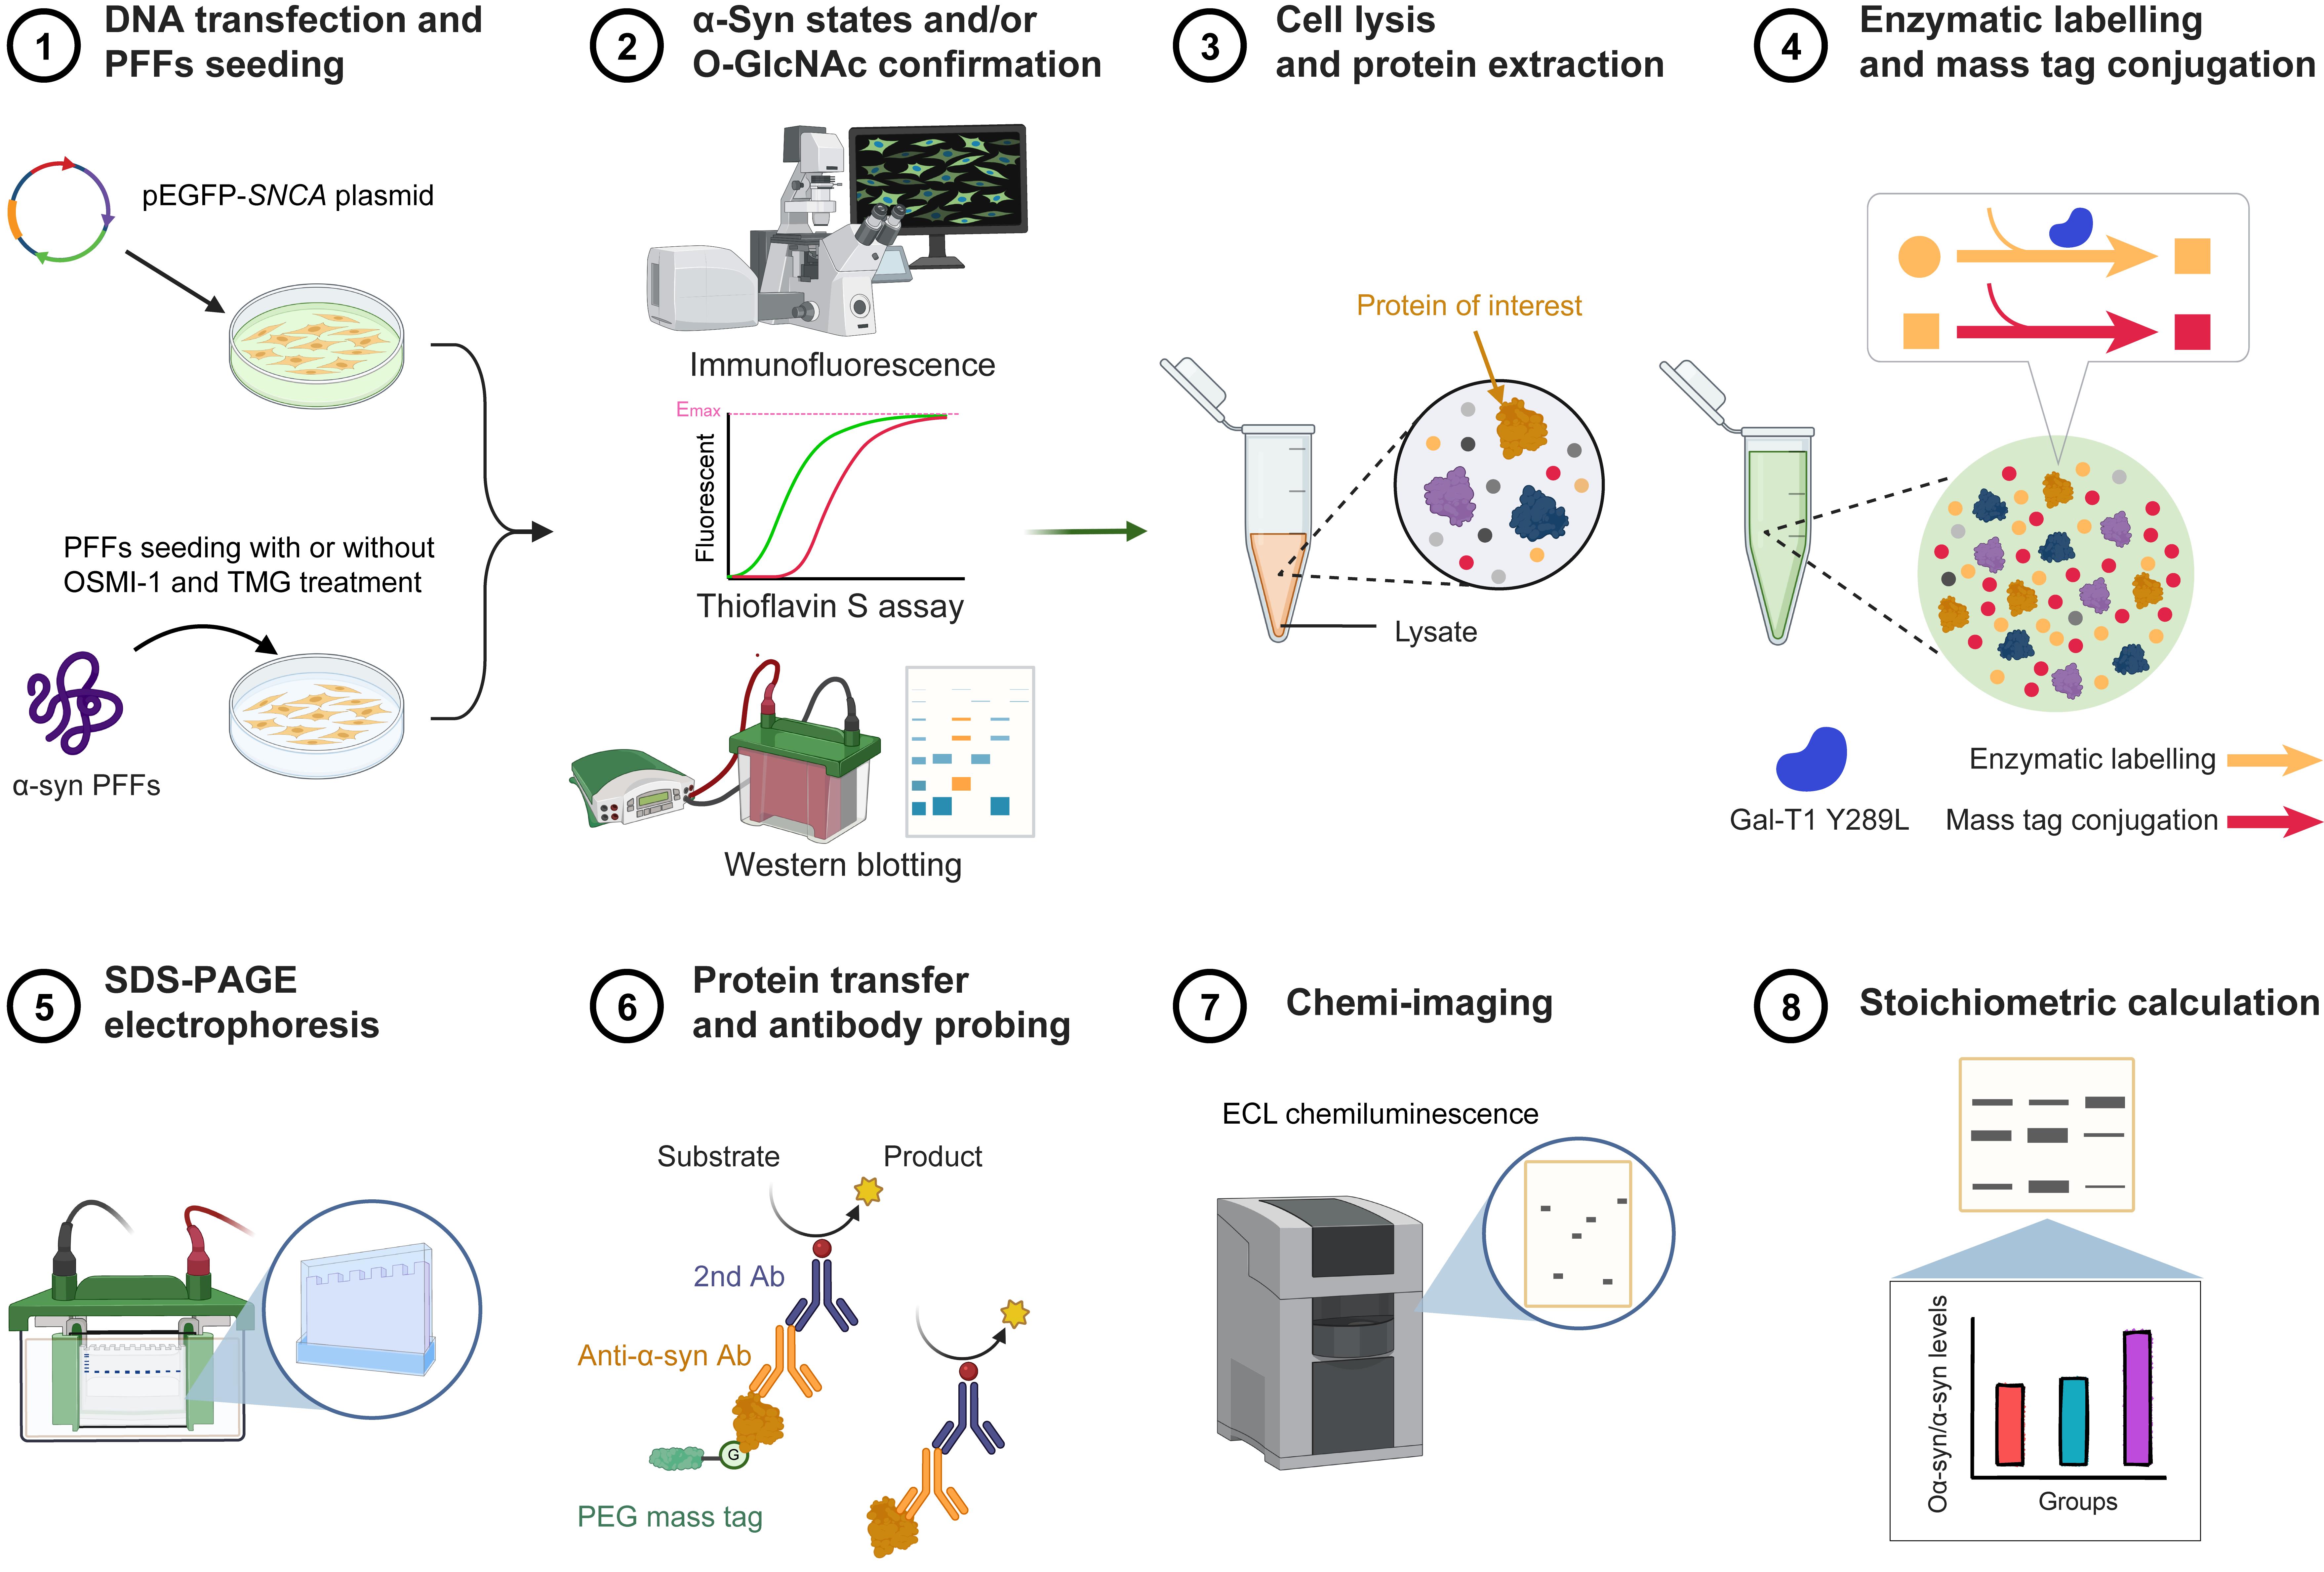
Chemoenzymatic labeling procedure for detecting O-GlcNAcylated α-Synuclein (α-syn) proteins by western blot
Background
Pathological aggregation of α-Synuclein (α-syn) is a defining characteristic of various neurodegenerative disorders, including Parkinson's disease and multiple system atrophy [1]. α-syn, a 140 amino acid protein, exhibits intrinsic disorder and impressive conformational flexibility, allowing it to take on a wide range of structural forms, including oligomers, protofibrils, and mature fibrils [2]. These heterogeneous strains have different conformational structures that are closely related to their diverse cytotoxicity, selective neuronal vulnerability, non-cell-autonomous propagation, and neuroinflammatory effects [3–5]. Emerging evidence implicates post-translational modifications (PTMs) in the modulation of α-syn structure and function, with dysregulated PTMs contributing to its propensity for misfolding and aggregation [6,7].
O-GlcNAcylation is a ubiquitous intracellular process entailing the enzymatic attachment of a single monosaccharide, N-acetylglucosamine, to cytoplasmic, nuclear, and organelle proteins [8,9]. O-GlcNAc transferase (OGT) catalyzes the addition of GlcNAc from uridine diphosphate N-acetylglucosamine (UDP-GlcNAc) to the hydroxyl moiety of serine or threonine residues in proteins, while O-GlcNAcase (OGA) removes it [10]. Regulating the O-GlcNAc modification process can affect the pathology of α-syn by altering the structure of its aggregates, which reduces their cytotoxicity, cell-to-cell propagation, and neuroinflammation [11–13] (Figure 1). A deeper understanding of the interplay of roles of O-GlcNAcylation in α-syn pathology in disease pathways could lead to targeted therapies. However, investigation of the functions of O-GlcNAcylation is challenging due to complexities associated with the detection and quantification of this modification [14,15]. Development of reliable detection methods is crucial for investigating O-GlcNAcylated α-syn and to understand its pivotal roles in regulating α-syn proteins, associated cellular processes, and disease pathology [11].
An effective method for observing O-GlcNAcylated proteins involves a chemoenzymatic labeling approach that utilizes recombinant bovine β-1,4-galactosyltransferase 1 (GalT Y289L) to tag O-GlcNAcylated proteins with an N-azidoacetylgalactosamine (GalNAz) group [16]. This method enables accurate, unbiased, and comprehensive labeling of O-GlcNAcylated proteins by combining them with a peptide. A versatile set of tags can be fused and combined with the proteins using copper-catalyzed or strain-promoted azide-alkyne cycloaddition, allowing them to be visualized [17,18]. By adding polyethylene glycol (PEG) of defined molecular weight, the modification status of two O-GlcNAcylated proteins, nucleoporin 62 (Nup62) and cyclic AMP-response element binding protein (CREB), was determined in protein lysate based on observed elevated molecular weight bands. This approach facilitates the investigation of the O-GlcNAcylation status of various strains of amyloid α-syn with different conformational states.
In this protocol, we describe a chemoenzymatic method to rapidly and sensitively assess O-GlcNAcylated α-syn. By labeling O-GlcNAcylated proteins with GalNAz using the GalT Y289L enzyme, followed by conjugation with defined DBCO-PEG mass tags via alkyne functional groups, the modification of α-syn can be identified and quantified by use of a specific antibody. This method, employed in models of α-syn ectopic expression and preformed fibril seeding, rapidly, sensitively, and quantitatively detected changes in O-GlcNAc modification of α-syn following inhibition of OGA and OGT.
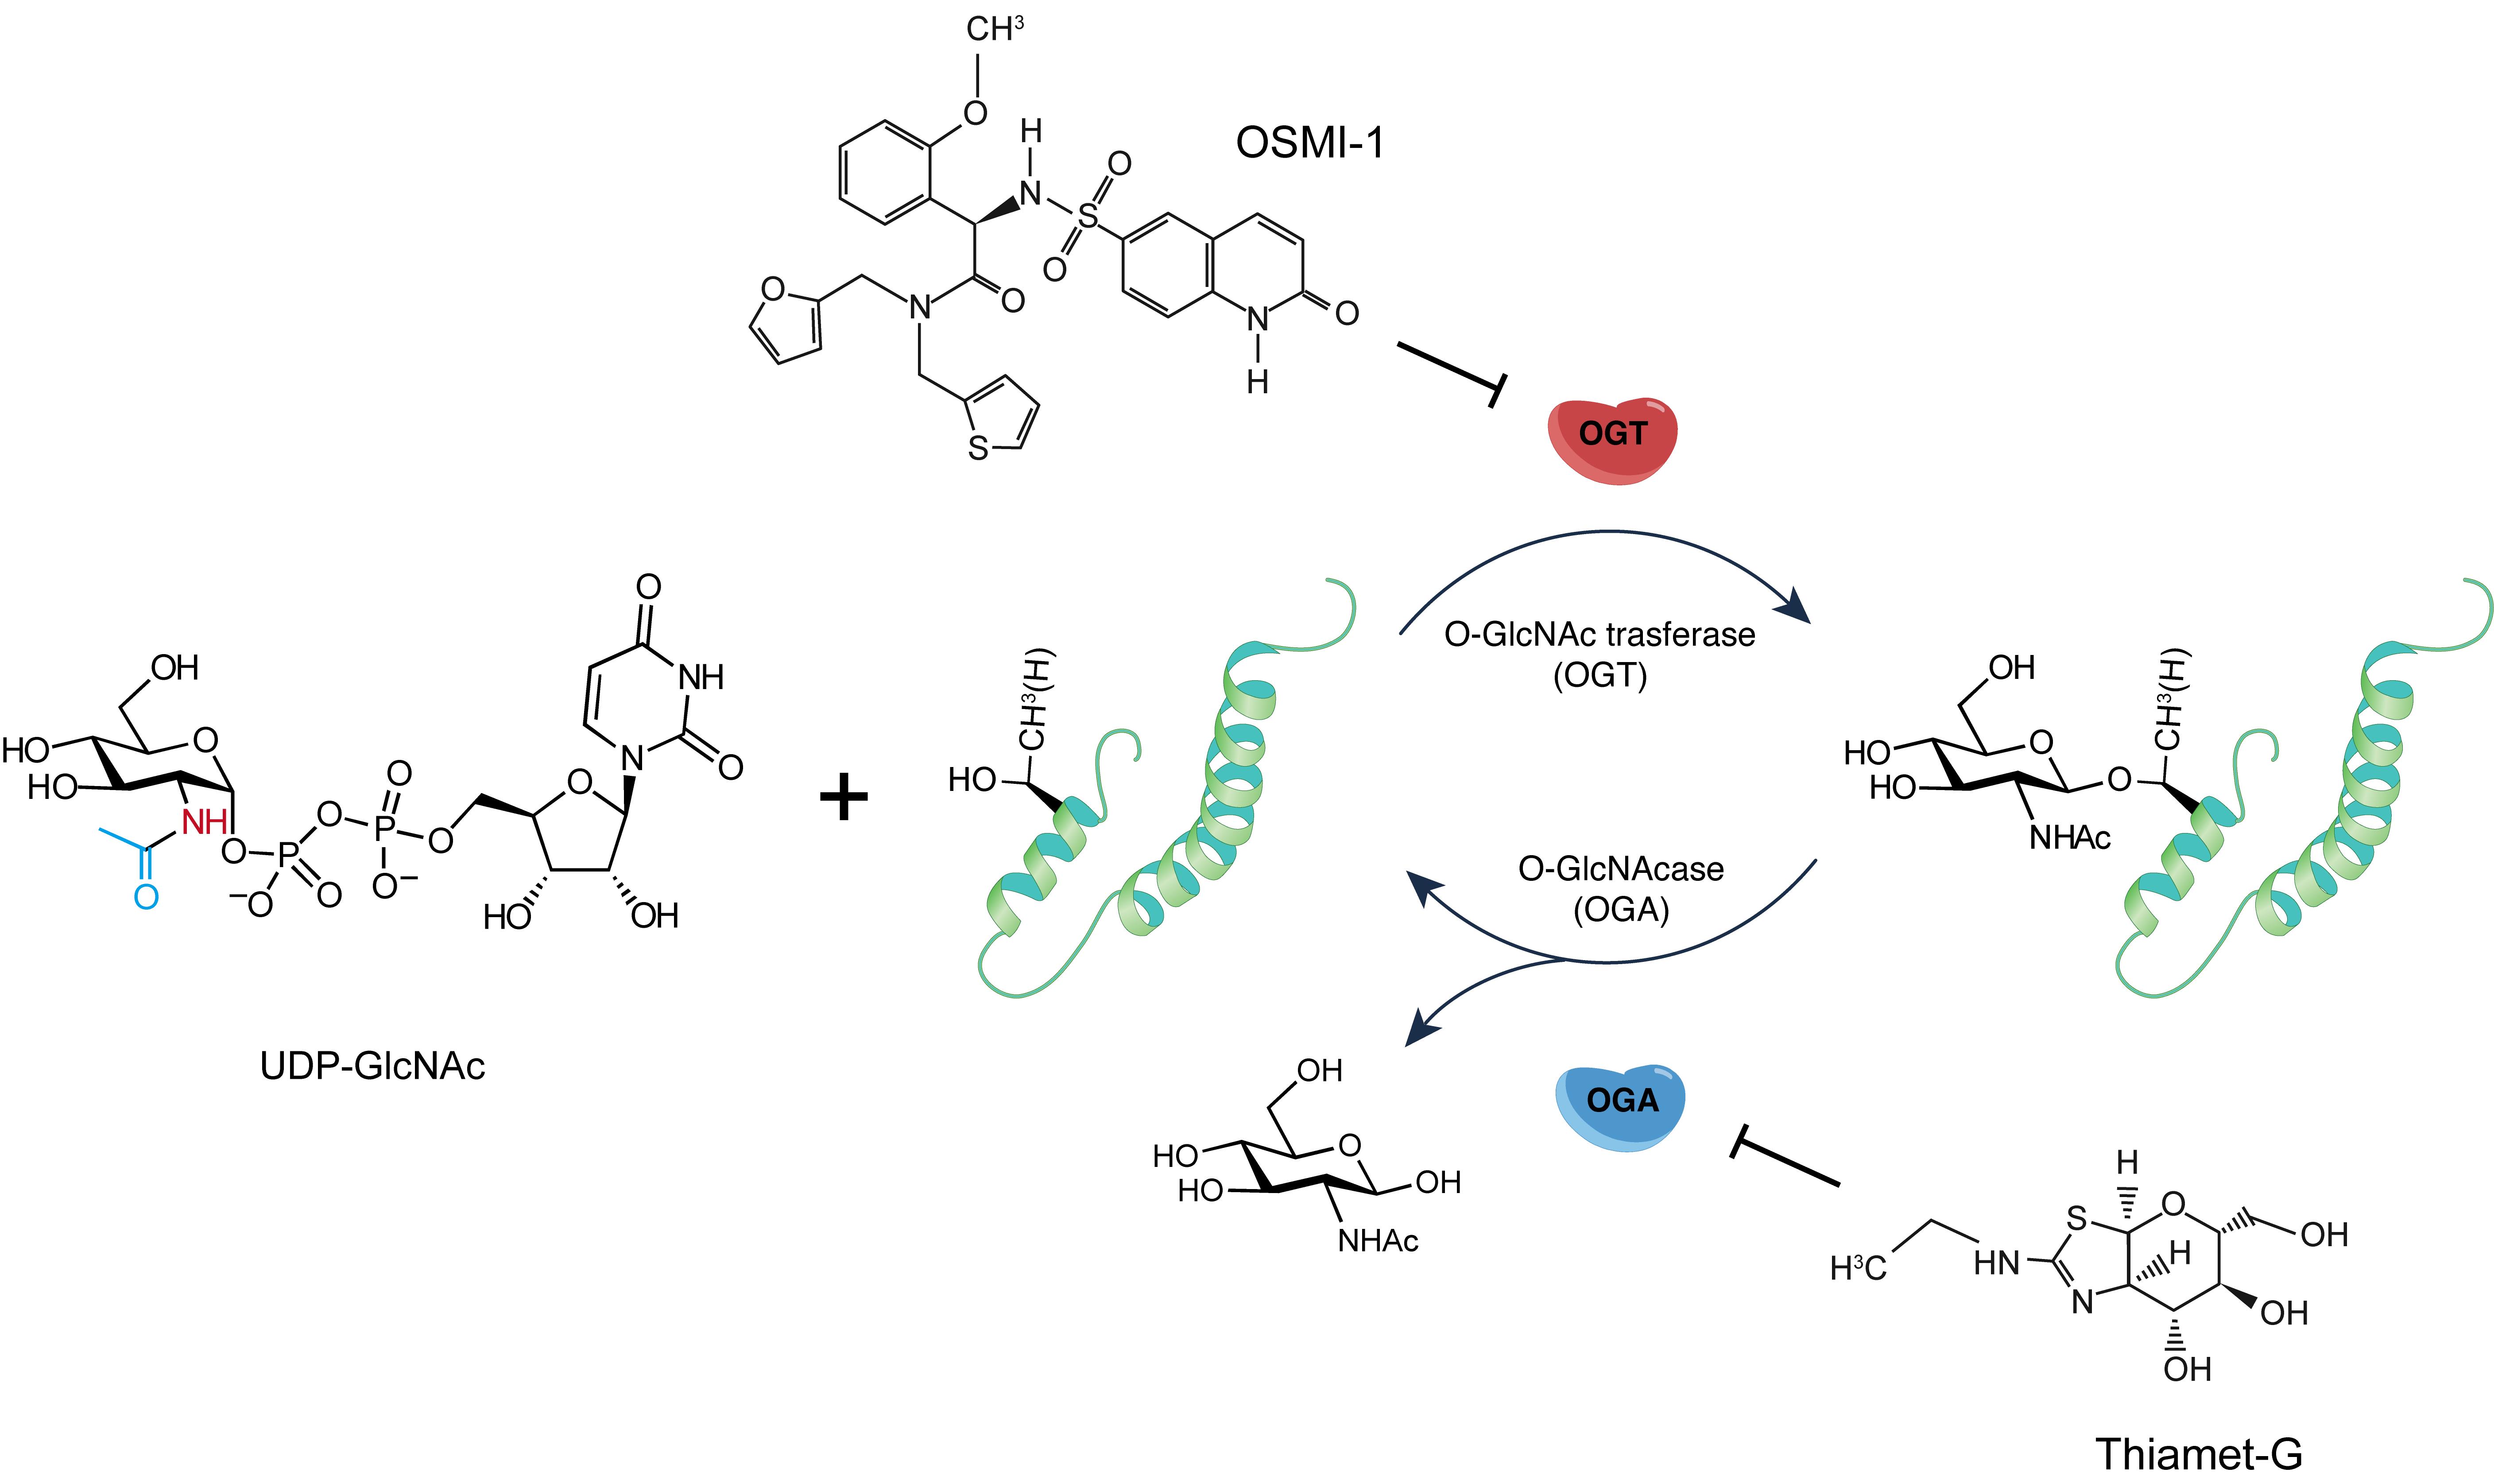
Figure 1. Schematic of protein O-GlcNAcylation cycling. O-GlcNAc modification installs a monosaccharide onto proteins catalyzed by O-GlcNAc transferase (OGT). Removal is catalyzed by O-GlcNAcase (OGA) [19]. Thiamet-G (TMG), a potent chemical inhibitor of OGA, increases O-GlcNAcylation. OSMI-1, a cell-permeable inhibitor of OGT, reduces O-GlcNAcylation without affecting other glycosyltransferases.
Materials and reagents
Biological materials
1. SH-SY5Y cells (YaJi Biological, catalog number: YS267C)
2. pEGFP-SNCA plasmids (Addgene ID: 40822)
3. Recombinant human α-Synuclein proteins
Note: The plasmid was transformed into BL21(DE3) cells, and proteins were expressed and purified using Capto Q ion-exchange chromatography resin [13].
4. Recombinant Gal-T1 Y289L proteins
Note: The construction of the Gal-T1 Y289L mutant plasmid and the purification of the recombinant protein were performed as described in the previous report [20].
5. PVDF membrane (Millipore, catalog number: IPVHO0010)
6. Thiamet G (TargetMol, catalog number: T6056)
7. OSMI-1 (TargetMol, catalog number: T16409)
Reagents
1. DMEM complete medium (Corning, catalog number: 10-013-CVRC)
2. Fetal bovine serum (Gibco, catalog number: 10099141C)
3. Penicillin-streptomycin solution (Gibco, catalog number: 15140122)
4. NaCl (Yonghua Chemical Co., Ltd., catalog number: S105802)
5. KCl (Sigma-Aldrich, catalog number: 7447-40-7)
6. Na2HPO4 (Aladdin, catalog number: D743055)
7. KH2PO4 (Aladdin, catalog number: P434887)
8. 1M Tris-HCl pH8.0 (Servicebio, catalog number: T1150)
9. 1M Tris-HCl pH7.5 (Servicebio, catalog number: T1140)
10. NP-40 (Macklin, catalog number: N885725)
11. Sodium deoxycholate (Beyotime, catalog number: ST2049)
12. jetPRIME DNA transfection reagent (Polyplus, catalog number: 101000046)
13. 50 mM iodoacetamide (IAA) (Accela, catalog number: SY009900)
14. Methanol (Yonghua Chemical Co., Ltd., catalog number: M104903)
15. Chloroform (Sigma, catalog number: 102442)
16. Thioflavin S (Sigma, catalog number: T1892-25G)
17. MOPS (Beyotime, catalog number: ST302)
18. SDS (Servicebio, catalog number: GC204005)
19. 100 mM MnCl2 (Merck, catalog number: 20-309)
20. 0.5 mM UDP-GalNAz (NewCan BioTech, catalog number: NC13303) in 10 mM HEPES, pH 7.9
21. DBCO-PEG 5 kDa (TargetMol, catalog number: T17753)
22. 500 U/μL PNGase F (UA BIOSCIENCE, catalog number: UA070014) in H2O
23. 4% paraformaldehyde (PFA) (Fdbio Science, catalog number: FD9679)
24. Dithiothreitol (DTT) (Fdbio Science, catalog number: FD7927)
25. Skim milk (Fdbio Science, catalog number: FD0080)
26. Tween-20 (Fdbio Science, catalog number: FD0020)
27. Triton X-100 (Solar bio, catalog number: T8200)
28. PUGNAc (TargetMol, catalog number: T38722)
29. Triethanolamine (Macklin, catalog number: 102-71-6)
30. Glycine (Aladdin, catalog number: A110749)
31. Bovine serum albumin (BSA) (Aladdin, catalog number: A104912)
32. Rabbit anti-GFP (Abcam, catalog number: ab209)
33. Mouse anti-α-syn LB509 (Abcam, catalog number: ab27766)
34. Rabbit anti-α-syn MJFR1 (Abcam, catalog number: ab138501)
35. Rabbit anti-α-syn pS129 antibody (Abcam, catalog number: ab51253)
36. Mouse anti-O-GlcNAc RL2 antibody (Invitrogen, catalog number: MA1-072)
37. Fluoromount-G slide mount agent (SouthernBiotech, catalog number: 0100-20)
38. Mouse anti-GAPDH (Fdbio Science, catalog number: FD0063)
39. Goat anti-mouse HRP (Fdbio Science, catalog number: FDM007)
40. Goat anti-rabbit HRP (Fdbio Science, catalog number: FDR007)
41. Goat anti-rabbit IgG (H+L) cross-adsorbed secondary antibody, FITC (Invitrogen, catalog number: F2765)
42. F(ab')2-goat anti-mouse IgG (H+L) cross-adsorbed, Alexa FluorTM 594 (Invitrogen, catalog number: A-11020)
43. Donkey anti-mouse IgG H&L (Alexa Fluor® 647) (Abcam, catalog number: ab150107)
44. BCA protein assay kit (Fdbio Science, catalog number: FD2001)
45. Fdbio-Femto ECL kit (Fdbio Science, catalog number: FD8030)
46. Pre-stained protein ladder marker (Vazyme, catalog number: MP201-02)
Solutions
1. Cell culture medium (see Recipes)
2. Phosphate-buffered saline (PBS) pH 7.4 (see Recipes)
3. Lysis buffer (see Recipes)
4. Homogenization buffer (see Recipes)
5. Mass-labeling buffer (see Recipes)
6. 2.5× labeling buffer pH 7.9 (see Recipes)
7. Resuspension solution A (see Recipes)
8. Resuspension solution B (see Recipes)
9. 1× PBST wash buffer (see Recipes)
10. Permeabilization solution (see Recipes)
11. Blocking buffer (see Recipes)
12. 4× SDS loading buffer (see Recipes)
13. TBST pH 7.6 (see Recipes)
14. Transfer buffer (see Recipes)
15. 10× running buffer for SDS-PAGE electrophoresis (see Recipes)
16. Blocking buffer (see Recipes)
17. Primary antibody dilution (see Recipes)
18. Primary antibody dilution (see Recipes)
Recipes
1. Cell culture medium
| Reagent | Final concentration | Amount |
|---|---|---|
| DMEM | 1× | 500 mL |
| Fetal bovine serum | 10% | 50 mL |
| 100× Penicillin-streptomycin | 1× | 5.5 mL |
| Total | n/a | 555.5 mL |
2. PBS pH 7.4
| Reagent | Final concentration | Amount |
|---|---|---|
| NaCl | 137 mM | 8 g |
| KCl | 2.7 mM | 0.2 g |
| Na2HPO4 | 10 mM | 1.44 g |
| KH2PO4 | 2 mM | 0.24 g |
| Milli-Q H2O | n/a | 800 mL |
| Total | n/a | 1,000 mL |
3. Lysis buffer
| Reagent | Final concentration | Amount |
|---|---|---|
| NaCl (5 M) | 150 mM | 3 mL |
| 1 M Tris-HCl (pH 8.0) | 25 mM | 2 mL |
| NP-40 | 1% | 1 mL |
| Sodium deoxycholate | 1% | 1 mL |
| SDS | 0.1% | 0.1 mL |
| Milli-Q H2O | n/a | up to 100 mL |
| Total | n/a | 100 mL |
Note: Add protease and phosphatase inhibitors before use.
4. Homogenization buffer
| Reagent | Final concentration | Amount |
|---|---|---|
| 1 M Tris-HCl (pH 7.5) | 25 mM | 2 mL |
| NaCl (5 M) | 150 mM | 3 mL |
| Triton X-100 | 1% | 1 mL |
| PUGNAc | 20 μM | 0.707 mg |
| Milli-Q H2O | n/a | up to 100 mL |
| Total | 100 mL |
Note: Add protease and phosphatase inhibitors before use.
5. Mass-labeling buffer
| Reagent | Final concentration | Amount |
|---|---|---|
| Triethanolamine (TEA) (pH 7.4) | 10 mM | 1.49 mg |
| NaCl | 150 mM | 8.77 mg |
| SDS | 1% | 10 mg |
| DBCO-PEG | 1 mM | 5 mg |
| Milli-Q H2O | n/a | up to 1 mL |
| Total | 1 mL |
6. 2.5× labeling buffer pH 7.9
| Reagent | Final concentration | Amount |
|---|---|---|
| HEPES | 50 mM | 11.9 mg |
| NaCl | 125 mM | 73 mg |
| NP-40 | 5% | 0.5 mL |
| Milli-Q H2O | n/a | up to 10 mL |
| Total | n/a | 10 mL |
7. Resuspension solution A
| Reagent | Final concentration | Amount |
|---|---|---|
| HEPES | 20 mM | 47.7 mg |
| SDS | 1% | 100 mg |
| Milli-Q H2O | n/a | up to 10 mL |
| Total | n/a | 10 mL |
8. Resuspension solution B
| Reagent | Final concentration | Amount |
|---|---|---|
| Triethanolamine (TEA) (pH 7.4) | 10 mM | 14.9 mg |
| NaCl | 150 mM | 87.7 mg |
| SDS | 1% | 100 mg |
| Milli-Q H2O | n/a | up to 10 mL |
| Total | n/a | 10 mL |
9. 1× PBST wash buffer
0.05% (v/v) Tween 20 detergent
1× PBS
10. Permeabilization solution
0.1% (v/v) Triton X-100 detergent
1× PBS
11. Blocking buffer
1% BSA (w/v)
1× PBS
12. 4× SDS loading buffer
250 mM Tris-HCl (pH 6.8)
8% (w/v) sodium dodecyl sulfate (SDS)
50% (v/v) glycerol
0.2% (w/v) bromophenol blue
20% (v/v) β-mercaptoethanol (β-ME)
13. TBST pH 7.6
20 mM Tris-HCl
137 mM NaCl
0.1% (v/v) Tween-20
14. Transfer buffer
25 mM Tris
192 mM glycine
20% (v/v) methanol
15. 10× running buffer for SDS-PAGE electrophoresis
250 mM Tris
1.91 M glycine
1% (w/v) SDS
16. Blocking buffer
5% (w/v) skim milk
10 mL of TBST
17. Primary antibody dilution
Dilute each primary antibody in TBST
18. Primary antibody dilution
Dilute each HRP-conjugated secondary antibody in TBST
Equipment
1. Cell culture incubator (Thermo Scientific, model: 905-ULTS)
2. High-speed centrifuge (Thermo Scientific, model: Sorvall LegendTM Micro 17R)
3. Ultrasonic cell crusher (Shanghai Jingxin Industrial Development Co., Ltd, model: XM-150T)
4. Thermostatic shaker (Shanghai Jingxin Industrial Development Co., Ltd, model: JXH-200)
5. Vortex mixer (M&S Instruments, model: VORTEX-GENIE 2 Mixer)
6. Mini LabRollerTM rotator (Sigma-Aldrich BS, model: Z674591-1EA)
7. Nunc Lab-Tek II CC2 Chamber slide system (Thermo Scientific, model: 154917)
8. Ultrasonic cell crusher (Shanghai Jingxin Industrial Development Co., Ltd, model: XM-150T)
9. Mini vertical gel electrophoresis cell (Tanon, model: VE-180)
10. Mini transfer cell (Tanon, model: VE-586)
11. Power supply (Tanon, model: EPS-600)
12. Digital systems for imaging western blotting (Bio-Rad, model: ChemiDoc MP Imaging System)
13. Microplate reader (TECAN, model: INFINITE 200 PRO)
14. Confocal laser scanning microscope (ZEISS, model: LSM900)
Software and datasets
1. Fiji/ImageJ, https://imagej.nih.gov/, https://imagej.net/software/fiji/
2. Microsoft Excel, https://www.microsoft.com/en-in/microsoft-365/excel
3. GraphPad Prism, https://www.graphpad.com/scientific-software/prism/
Procedure
A. Cell culture
1. Take SH-SY5Y cells from liquid nitrogen storage.
2. Place cells immediately in a 37 °C water bath to thaw rapidly.
3. Add five times the volume of complete medium and centrifuge at 300× g for 5 min.
4. Discard the supernatant and resuspend the cells in fresh medium.
5. Inoculate 1 × 10⁵ SH-SY5Y cells into a 6-well plate and culture at 37 °C in a humidified atmosphere containing 5% CO2 until they reach 80%–90% confluence.
B. α-syn plasmid transfection and delivery of preformed fibrils (PFFs)
In this section, models expressing exogenous α-syn and PFFs seeding-induced aggregate formation were used to examine the enzymatic labeling method, which effectively identifies O-GlcNAcylated α-syn in different states. PFFs were synthesized in vitro from α-syn monomers, and the formation of aggregates was detected using the Thioflavin S fluorescent assay [21,22].
1. Plasmid transfection
a. Dilute 2 μg of pEGFP-SNCA plasmids in 200 μL of jetPRIME buffer, gently vortex for 10 s, and spin down.
Note: Dilute the DNA using jetPRIME buffer instead of Opti-MEM.
b. Add 4 μL of jetPRIME reagent to the diluted plasmid solution.
c. Vortex for 1 s, spin down, and incubate at room temperature for 10 min.
d. Add 200 μL of transfection mixture to the cells.
e. Incubate the cells for 36–48 h at 37 °C and 5% CO2.
Note: The transfection reagent is compatible with serum and antibiotics; there is no need to change the medium after transfection.
2. α-syn expression confirmation by immunofluorescent staining
a. After washing with PBS, fix the cells by adding 1 mL of 4% PFA for 20 min.
b. Treat the cells for permeabilization with 0.5% Triton X-100 for 20 min.
c. Block the cells by incubating them with 1% BSA for 1 h at room temperature.
d. Incubate the cells with rabbit anti-GFP and mouse anti-α-syn (LB509) diluted in 0.1% BSA in PBS at room temperature for 3 h or 4 °C overnight.
e. Dilute the secondary antibodies [goat anti-rabbit IgG (H+L) FITC and donkey anti-mouse IgG H&L Alexa Fluro® 647] in blocking buffer and incubate them with the cells at room temperature for 1 h.
f. View the cells under a ZEISS LSM900 confocal fluorescence microscope after mounting with Fluoromount-G.
g. Images representing anti-α-syn staining are shown in Figure 2A.
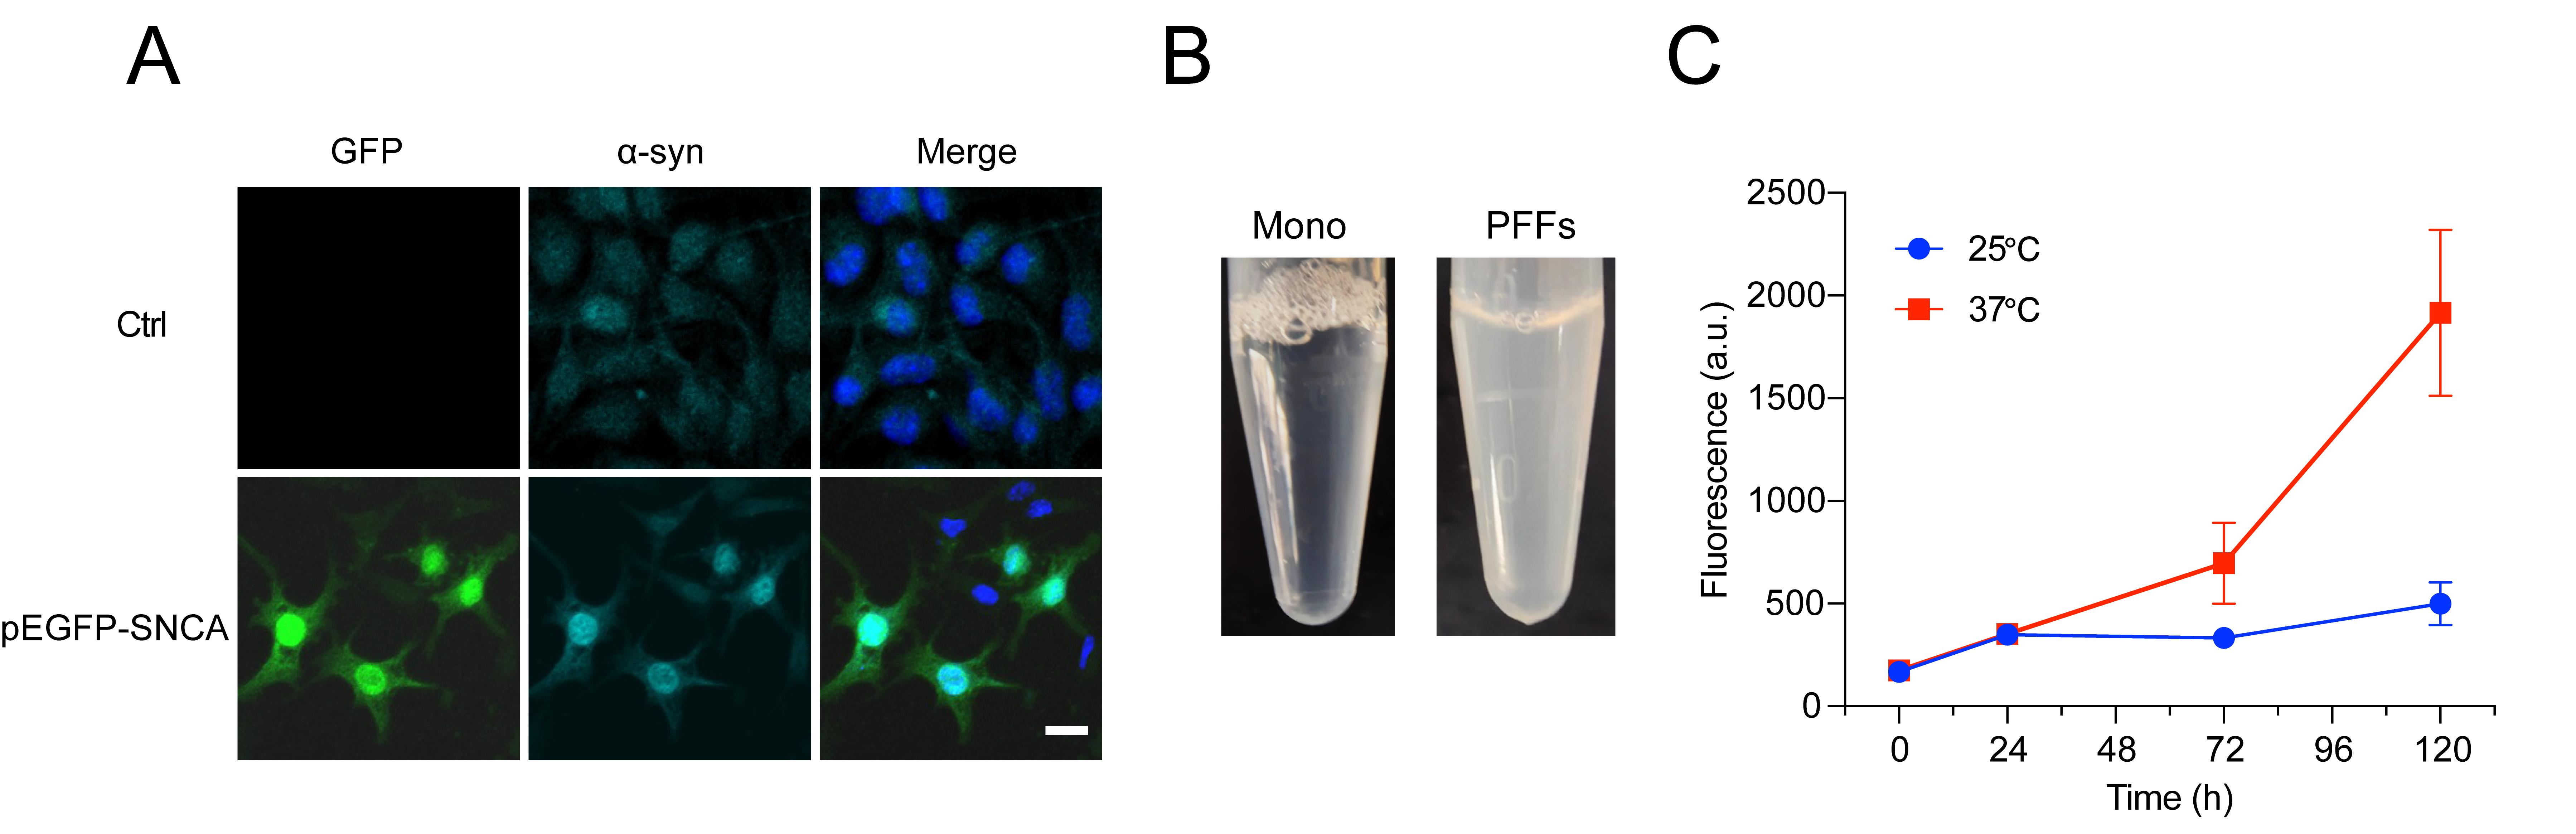
Figure 2. Appearance of preformed fibrils (PFFs) and Thioflavin S assay for testing synthetic PFFs. (A) Immunofluorescent staining of α-syn expression in SH-SY5Y cells transfected with pEGFP-SNCA. Scale: 20 μm. (B) Appearance of α-syn monomer (left) and semi-transparent PFFs (right). (C) Relative fluorescence intensity changes of α-syn monomer shaking at 25 °C (blue) or 37 °C (red) from 0 to 120 h. Samples obtained at timepoints of 0, 24, 72, and 120 h were tested. Experiments included three replicates, and each sample was tested in duplicate. Results are expressed as mean ± SEM.
3. PFF preparation and seeding
a. Add 2.5 mg recombinant human α-syn to 30 mM Tris-HCl (pH 7.4) containing 100 mM NaCl, bringing the final volume to 500 μL.
Note: The recombinant α-syn was produced by expressing the SNCA gene sourced from E. coli and purifying it by ion exchange chromatography [13].
b. Place the tubes in the thermostatic shaker and shake at 1,000 rpm for 5–7 days at 37 °C to induce the formation of PFFs.
Note: PFFs should have a translucent and slightly turbid appearance (Figure 2B).
c. Measure PFFs concentration using the BCA Protein Assay kit.
d. Seed the cells with 40 μg/mL PFFs or vehicle PBS (as a control) and cultivate for 24 h before transferring to fresh medium.
e. Cultivate for a further 24 h before harvesting the cells (i.e., 48 h post-PFFs seeding).
4. Thioflavin S fluorescent assay
a. Dilute thioflavin S stock solution (5 mM) with 20 mM MOPS to 5 μM.
b. Transfer 100 μL of thioflavin S into a 96-well black plate.
c. Introduce 5 μL of α-syn into the wells, and let the plate sit in the dark for 30 min.
d. Measure fluorescence using the INFINITE 200 PRO TECAN plate reader with excitation at 436 nm and emission at 535 nm.
e. The fluorescence intensity gradually increases when the α-syn monomer is shaken at 37 °C, with minimal change observed at 25 °C (Figure 2C).
C. O-GlcNAc modulation and seeding aggregate confirmation
1. Regulating the intracellular O-GlcNAc cycle by inhibiting OGA and OGT can affect the modification level of α-syn. To verify the effectiveness in detecting modified α-syn, PFFs-seeded SH-SY5Y cells are treated with the OGA inhibitor (Thiamet-G, TMG) and the OGT inhibitor (OSMI-1) to alter α-syn modification levels. Immunofluorescence staining is also used to confirm the formation of aggregates in the PFFs-seeded cells.
a. Following a 24-h seeding period with PFFs, change to medium containing 25 μM OSMI-1 or 10 μM TMG.
b. Continue cultivation for 48 h.
2. Immunofluorescent staining
a. Discard the culture medium by tapping the plate on a paper towel.
b. Fix the cells by adding 1 mL of 4% PFA in PBS for 20 min at room temperature.
c. Discard the PFA solution and wash the cells three times with 2 mL of PBS.
d. Permeabilize the cells using 0.5% Triton X-100 for 20 min.
e. Discard the permeabilization solution and wash the cells three times with PBS.
f. Block the cells using 1% BSA for 1 h at room temperature.
g. Incubate the cells with rabbit anti-pS129 α-syn and mouse anti-α-syn (LB509) antibody diluted in 0.1% BSA in PBS at room temperature for 3 h or 4 °C overnight.
h. Discard the primary antibody solution and wash the cells three times with PBST.
i. Incubate the cells with goat anti-rabbit IgG (H+L) FITC and goat anti-mouse IgG (H+L) Alexa FluorTM 594 secondary antibody diluted in 0.1% BSA in PBS at room temperature for 1 h.
j. Wash the cells three times with PBST and once with PBS.
k. Mount the cells using Fluoromount-G slide mount agent and cover with a coverslip.
l. Observe the cells under a ZEISS LSM900 confocal fluorescence microscope.
D. Protein extraction and pre-labeling preparation
1. Before enzymatic labeling, total proteins are extracted from cells transfected with pEGFP-SNCA plasmids or seeded with PFFs.
a. Discard the medium and wash the sample once with ice-cold PBS.
b. Add 2–3 mL of ice-cold PBS per well and harvest the cells using a cell scraper.
c. Transfer cells to 1.5 mL tubes and centrifuge at 300× g for 5 min.
d. Discard the supernatant and wash the cells twice with ice-cold PBS.
e. Add lysis buffer or homogenization buffer at approximately 10 times the volume of the cell pellet.
Note: It is recommended to use the lysis buffer for cells transfected with plasmids and the homogenization buffer for cells treated with PFFs, respectively.
f. Incubate on ice for 30 min.
g. Centrifuge at 13,800× g for 20 min at 4 °C.
h. Transfer the supernatant to a clean tube and keep it on ice.
i. Determine protein concentration in a BCA assay using BSA as the standard. Normalized the protein concentration to 2.5 μg/μL.
2. Protein extract reduction and alkylation: The protein extracts should be reduced and alkylated to avoid side reactions between free cysteine residues and the alkyne probes. This treatment will reduce nonspecific background and artificial inflation of the O-GlcNAcylation stoichiometry.
a. Add iodoacetamide to a final concentration of 50 mM.
b. Incubate the mixture at room temperature on a rotator for 1 h.
Note: Protect from light during incubation.
3. Protein precipitation
a. Add 600 μL of methanol to the 200 μL protein solution.
b. Add 150 μL of chloroform.
c. Add 400 μL of Milli-Q H2O.
d. Centrifuge at 13,800× g for 15 min at 15 °C and discard the upper aqueous phase, while leaving the interface layer intact.
e. Add 450 μL of methanol.
f. Centrifuge at 13,800× g for 15 min at 15 °C and discard the supernatant.
g. Allow the protein pellet to air-dry for 5 min.
Note: Do not allow the pellet to over-dry.
h. Add 40 μL of resuspension solution (20 mM HEPES, pH 7.9, with 1% SDS) and incubate for 5 min at 90 °C.
i. Vortex briefly, then keep on ice for 3 min.
j. Perform a BCA assay, normalizing protein concentration to 2.5 μg/μL.
Note: Prolonged exposure to ice leads to the formation of SDS precipitates, which can be redissolved at room temperature.
E. Enzymatic GalNAz labeling and PEG mass tagging
Y289L-mutated bovine β-1,4-galactosyltransferase 1 (GalT) catalyzes the addition of N-azidoacetyl-galactosamine (GalNAz) from UDP-GalNAz to O-GlcNAc residues. Bioorthogonal chemistry is then used to conjugate a defined molecular mass of DBCO-mPEG to the GalNAz (Figure 3).
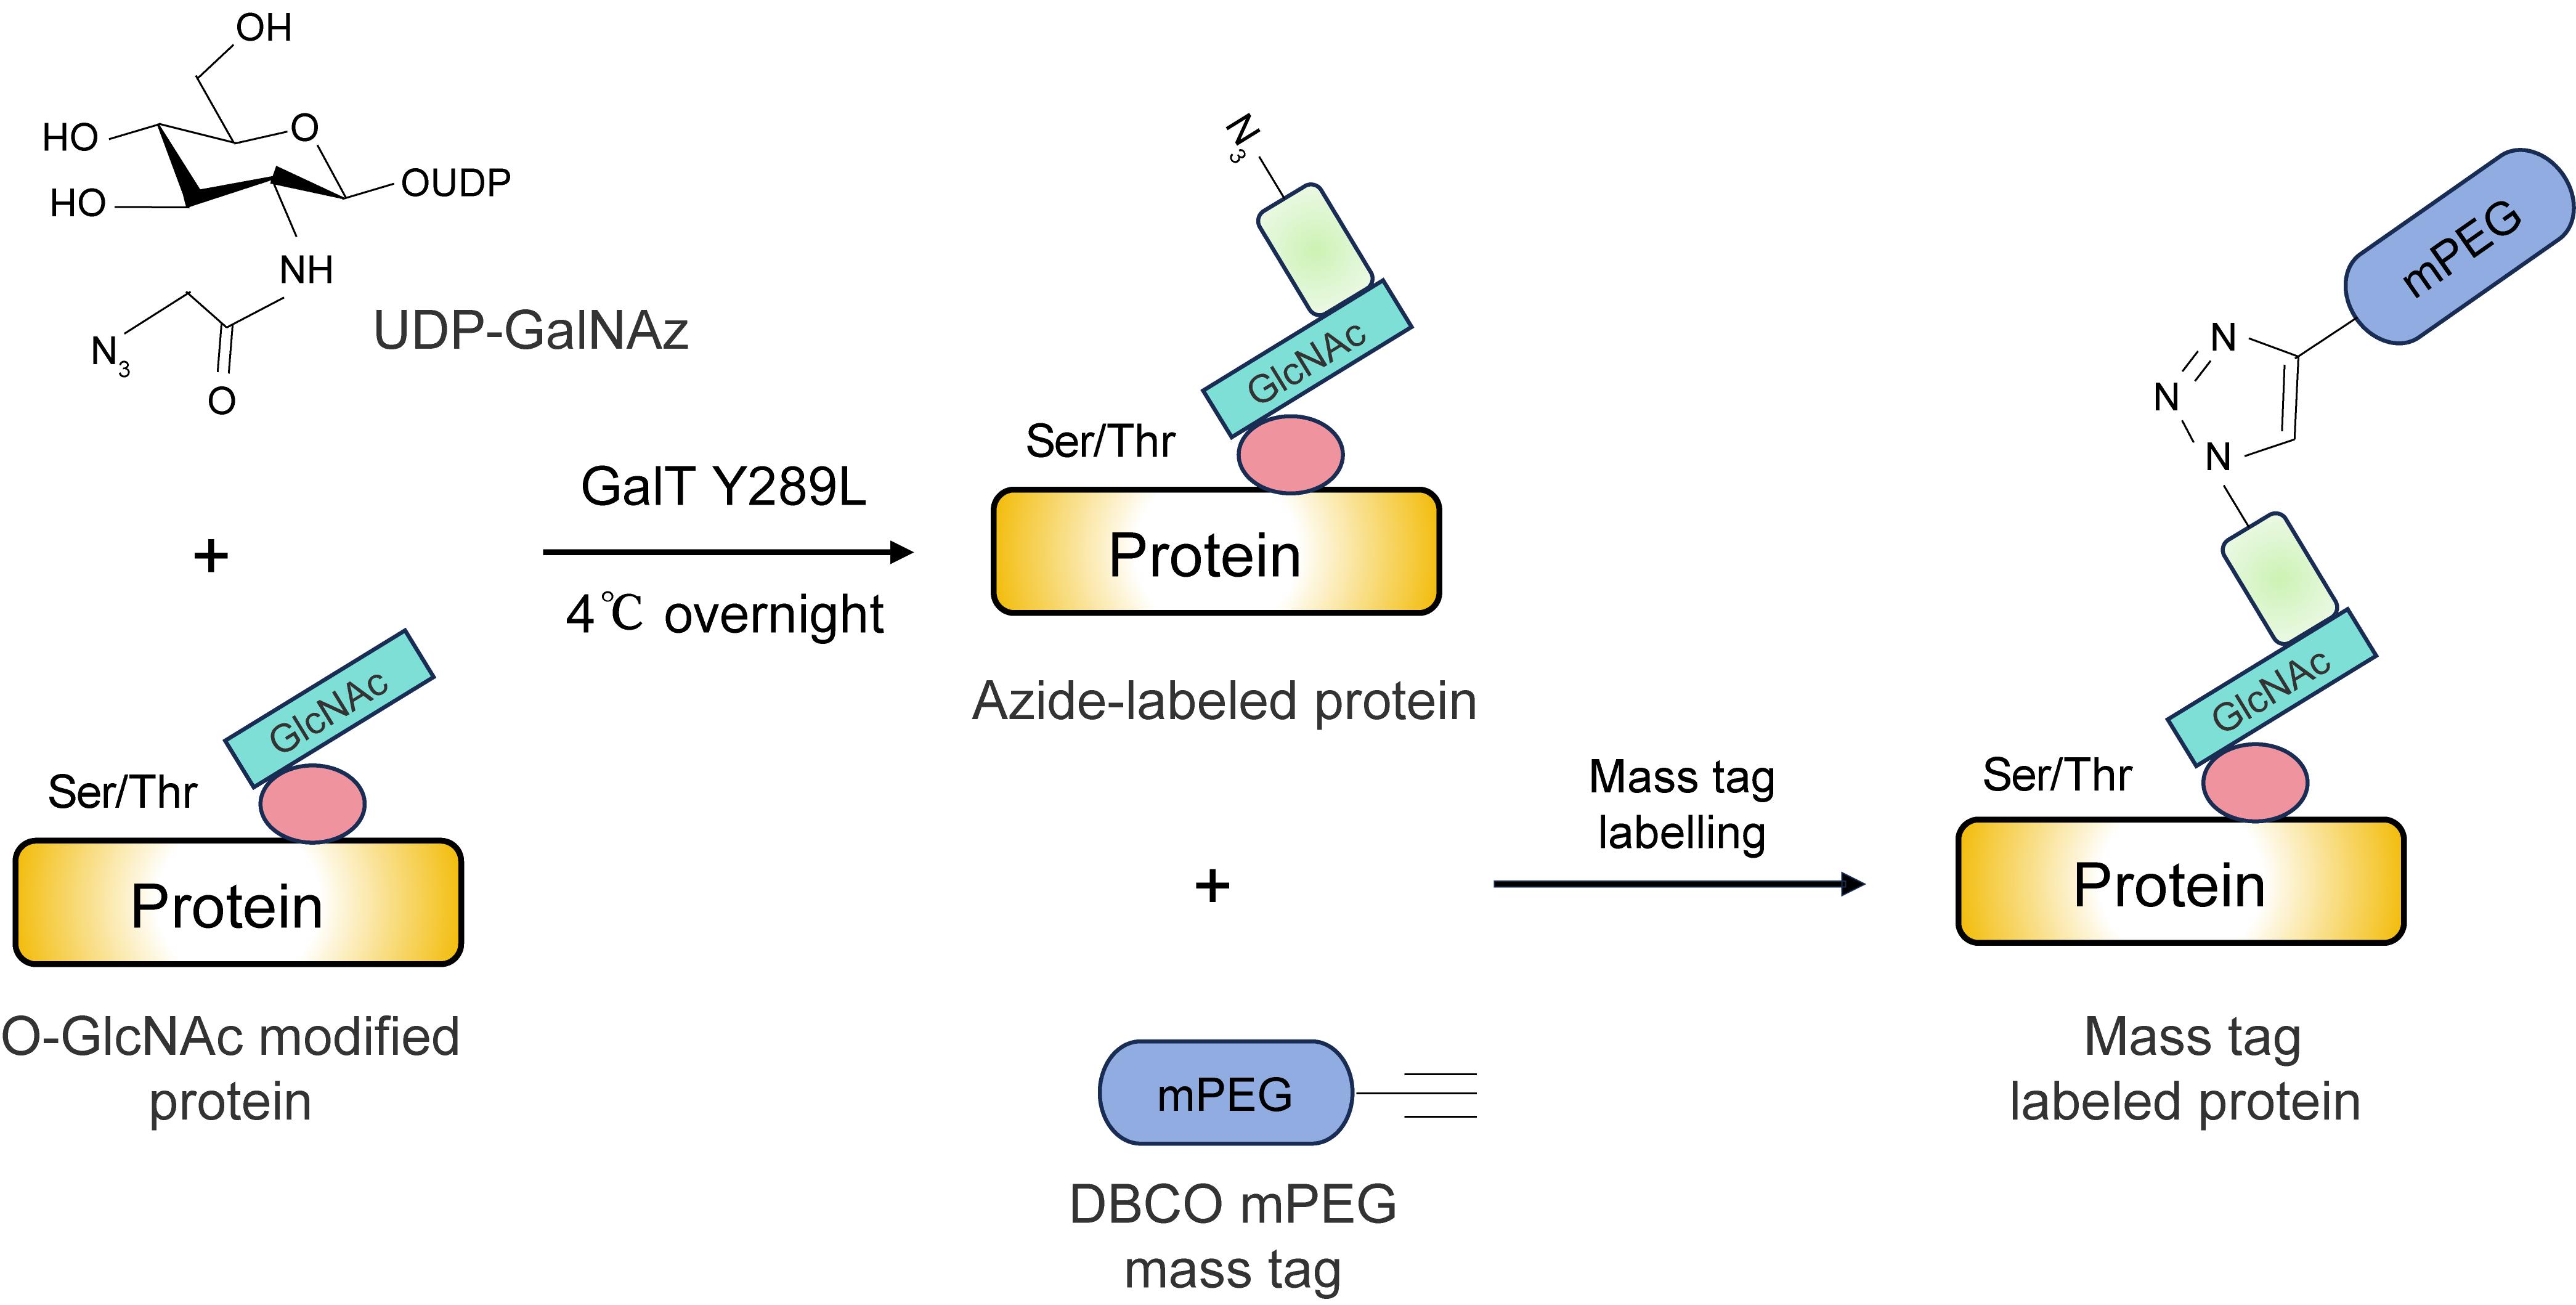
Figure 3. Chemoenzymatic labeling and click chemistry reactions for O-GlcNAc-modified proteins. The preparation for detecting protein O-GlcNAcylation consists of a two-step procedure. The Y289L mutation of bovine β-1,4-galactosyltransferase 1 (GalT) enables the enzyme to use UDP-N-azidoacetyl-galactosamine (UDP-GalNAz) to modify O-GlcNAc residues in the protein. Bioorthogonal chemistry is then used to tag the GalNAz with a defined molecular mass of BDCO-mPEG, allowing separation and recognition of O-GlcNAc-modified proteins using a specific antibody.
1. GalNAz labeling
a. Prepare the enzymatic GalNaz labeling reaction mixture as outlined in Table 1.
b. Place the labeling reaction mixture on a rotator at 4 °C for 20 h.
c. Add 7.5 μL of iodoacetamide and incubate for 30 min on a rotator.
Note: Dissolve the iodoacetamide (50 mM) in Milli-Q H2O immediately before use.
d. Rotate the sample at 4 °C for 20 h.
e. Add 7.5 μL of iodoacetamide to a final concentration of 50 mM and rotate in the dark for 30 min.
Table 1. Reaction solutions for the enzymatic labeling of proteins with GalNAz
| Reaction components | Volume (μL) | Final concentration |
| Labeling buffer (2.5×) | 40 | 1× |
| 100 mM MnCl2 | 5.5 | 7.3 mM (1×) |
| 0.5 mM UDP-GalNAz | 5 | 33 μM |
| 2 mg/mL Gal-T1 (Y289L) | 5 | 0.1 mg/mL |
| Protease inhibitor cocktail (50×) | 2 | 1× |
| Milli-Q H2O# | 21 | n/a |
| Cell lysate (2–5 μg/μL) in 1% SDS, 20 mM HEPES, pH 7.9 | 20 | 0.5–1.3 μg/μL |
| Total | 100 | n/a |
#Since the solution contains GlcNAc residues that may be labeled by GalT Y289L, it is recommended to remove N-glycans by adding 1.5 μL of 500 U/μL PNGase F dissolved in 19.5 μL of Milli-Q H2O.
2. PEG mass tagging
a. Precipitate the protein with methanol/chloroform to remove UDP-GlcNAz as described in step D3.
b. Add 100 μL of mass-labeling buffer (10 mM triethanolamine, pH 7.4, 150 mM NaCl, 1% SDS, and 1 mM DBCO-PEG) and incubate at 98 °C for 5 min.
c. Precipitate the protein with methanol/chloroform again as described in step D3.
d. Dissolve the pellet in 20 μL of resuspension solution B (10 mM triethanolamine, pH 7.4, 150 mM NaCl, and 1% SDS).
F. Western blotting
1. Denature the protein in 1× loading buffer at 95 °C for 5 min.
2. Load samples onto a 12% or 15% SDS-PAGE gel in a mini vertical gel electrophoresis cell at 15 mA (constant current).
3. Following electrophoresis, transfer the separated proteins in the gel onto a methanol-activated PVDF membrane for 2 h using the Mini transfer cell at 90 V (constant voltage).
4. Incubate the membrane with 5% skimmed milk in TBST for 1 h at room temperature.
5. Wash the membrane three times for 5 min with TBST.
6. Incubate the membrane in primary antibody solution for 2 h or at 4 °C overnight.
Note: The diluted primary antibody solution must contain 5% skimmed milk to avoid increasing the background signal. For semi-quantification, a loading control, e.g., anti-GAPDH, must be included.
7. Wash the membrane three times for 5 min with TBST.
8. Incubate with secondary antibody (HRP-conjugated anti-mouse or rabbit IgG) in TBST for 2 h.
9. Wash the membrane three times for 10 min with TBST.
10. Visualize the antibody-recognized proteins on the membrane using an ECL chemiluminescent kit.
G. Relative abundance of O-GlcNAcylated α-syn
Following labeling and mass tagging, a specific antibody is used to identify and visualize O-GlcNAcylated α-syn. This is seen as a higher mass-shifted band corresponding to the additional molecular weight of the PEG tag conjugated to the α-syn protein. The relative abundance of an individual O-GlcNAcylated variant of α-syn is given by the ratio of the intensity of the mass-altered band of the variant to the total band specific to that protein.
Data analysis
In accordance with our previous observation, the band of O-GlcNAcylated α-syn, which has a molecular mass addition, shifted above the band position of the non-O-GlcNAcylated α-syn, corresponding to the lack of enzymatic labeling. The fraction of O-GlcNAcylated protein to the total α-syn protein signal can then be calculated to determine the approximate O-GlcNAcylation stoichiometry. Utilize the Fiji/ImageJ software to analyze the western blot images, quantify the signals, and compare the discrepancies; conduct statistical analysis using the GraphPad Prism software.
1. Open the western blot image in Fiji and convert it to grayscale.
Note: Change the unsaturated images to 8-bit type by using Image > Type > 8-bit.
2. Use the Rectangle Tool to select the region of each western blot strip of O-GlcNAcylated α-syn (O-α-syn) and non-O-GlcNAcylated α-syn.
3. Measure the mean gray value of interest using Analyze > Measure.
4. Copy the measurements from Fiji and paste them into the Excel worksheet to proceed with calculations.
5. Quantify the proportion (%) of O-α-syn using the following formula:
Proportion (%) O-α-syn = gray value of O-α-syn/total gray value (i.e., O-α-syn + nO-α-syn) × 100%
6. To evaluate the differences between matched groups, plot graphs and perform statistical analysis using GraphPad Prism software.
Validation of protocol
To evaluate O-GlcNAc modification of α-syn in an overexpression model, SH-SY5Y cells were transfected with the plasmid pEGFP-SNCA, which carries the wild-type human α-syn gene (SNCA) and fused eGFP at its N-terminal. Inhibition of OGT using OSMI-1 led to a reduction in overall protein O-GlcNAcylation. By contrast, this increased following OGA inhibition by TMG, as detected using the O-GlcNAc antibody RL2 (Figure 4A). This elevation of O-GlcNAcylation in the presence of TMG confirmed that the upshifted western blot bands represented O-GlcNAcylated α-syn. This was possible by previously conjugating 5 kDa PEG mass tags onto azide-labeled proteins using a click chemistry approach. O-GlcNAcylated α-syn was then identifiable as the novel band with a higher molecular weight (~58 kDa) than unmodified α-syn-EGFP (43 kDa) (Figure 4B). In vehicle-treated cells, O-GlcNAcylated α-syn represented 20% of the total α-syn, which increased to 35% following TMG treatment (Figure 4C).
This approach was also used to evaluate the status of amyloid α-syn O-GlcNAcylation in cell models seeded with PFFs. As expected, seeding with α-syn amyloid fibrils triggered aggregation of the corresponding native protein, resulting in the formation of high-molecular-weight polymers (Figure 5A). These aggregates were recognized by an antibody against S129-phosphorylated α-syn (Figure 5B). Total protein O-GlcNAcylation was reduced by seeding with PFFs, but it recovered following TMG treatment (Figure 5C), which enhanced the new α-syn band at a higher molecular weight of ~55 kDa (corresponding, theoretically, to the addition of four mass tags to the polymer) (Figure 5D). In vehicle-treated cells, O-GlcNAcylated represented 58% of the total α-syn, which increased to 75% following TMG treatment (Figure 5E).
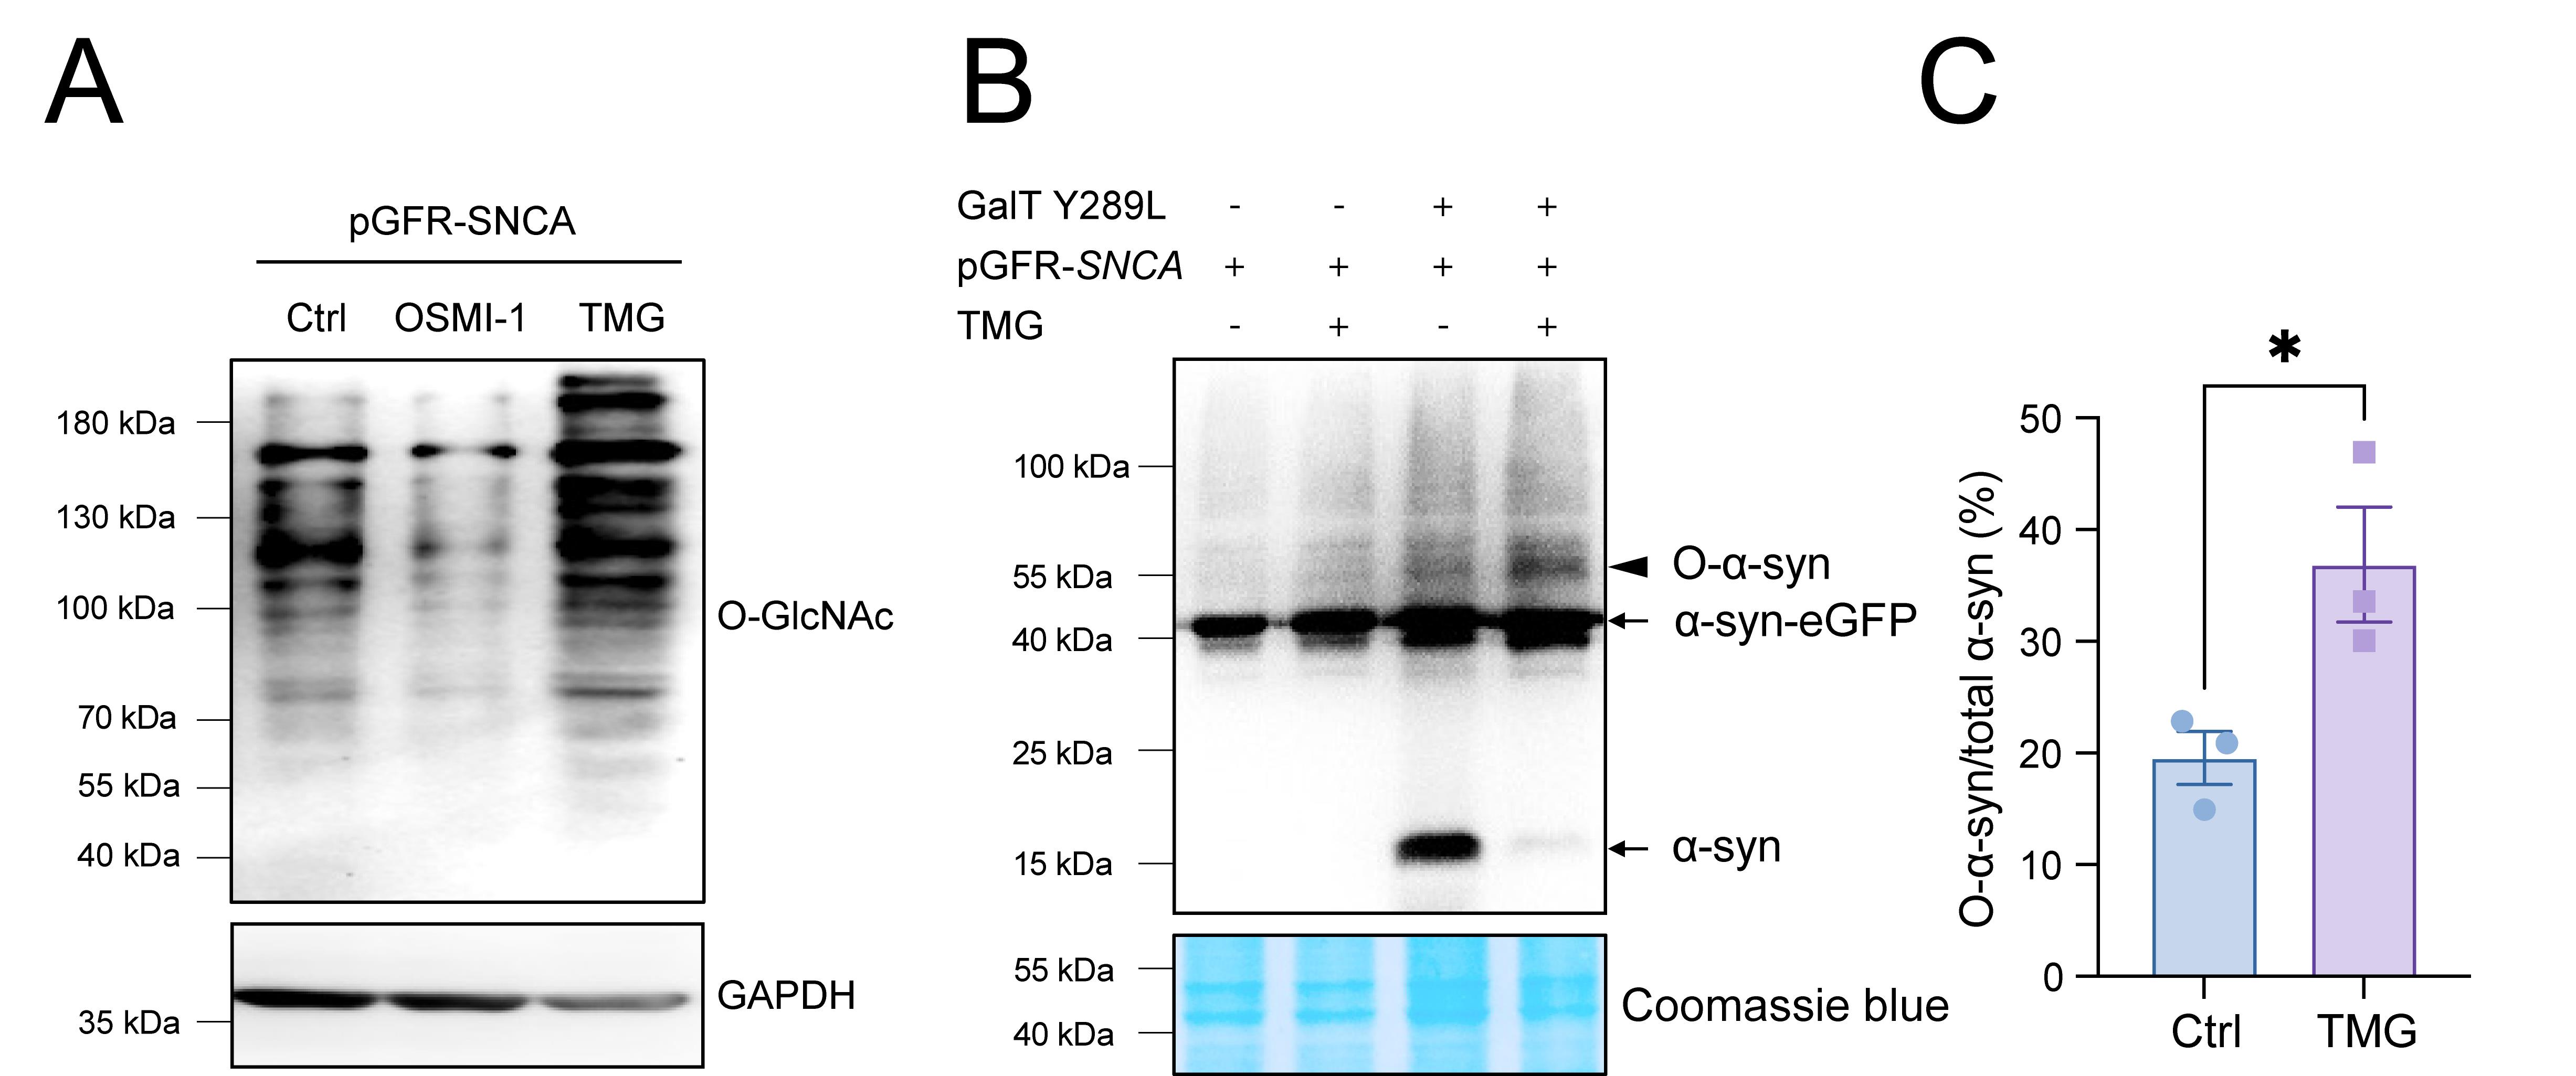
Figure 4. Evaluation of protein O-GlcNAcylation in cells ectopically expressing α-syn. (A) Total O-GlcNAcylation levels were visualized by western blotting using an anti-O-GlcNAc RL-2 antibody. Regulation of protein O-GlcNAcylation levels was confirmed by treating cells with OSMI-1 and Thiamet-G (TMG) for 48 h. Levels of pEGFP-SNCA plasmid expression were probed with rabbit anti-α-syn (MJFR1) antibody. GAPDH served as a loading control. (B) Immunoblot analysis of O-GlcNAcylated α-syn (O-α-syn) in pEGFP-SNCA-transfected SH-SY5Y cells. Arrowhead indicates the O-α-syn bands that shifted from ~42 kDa to a higher molecular weight of ~55 kDa in the presence of GalT1 (Y289L). TMG treatment enhanced the levels of O-GlcNAcylated α-syn. Coomassie blue staining served as a loading control. (C) Quantification of the proportion (%) of O-GlcNAcylated α-syn in the total α-syn in cells treated with TMG compared to untreated (Ctrl) cells. N = 3 independent experiments. Values are shown as mean ± SEM. *P < 0.05, unpaired Student’s t-test.
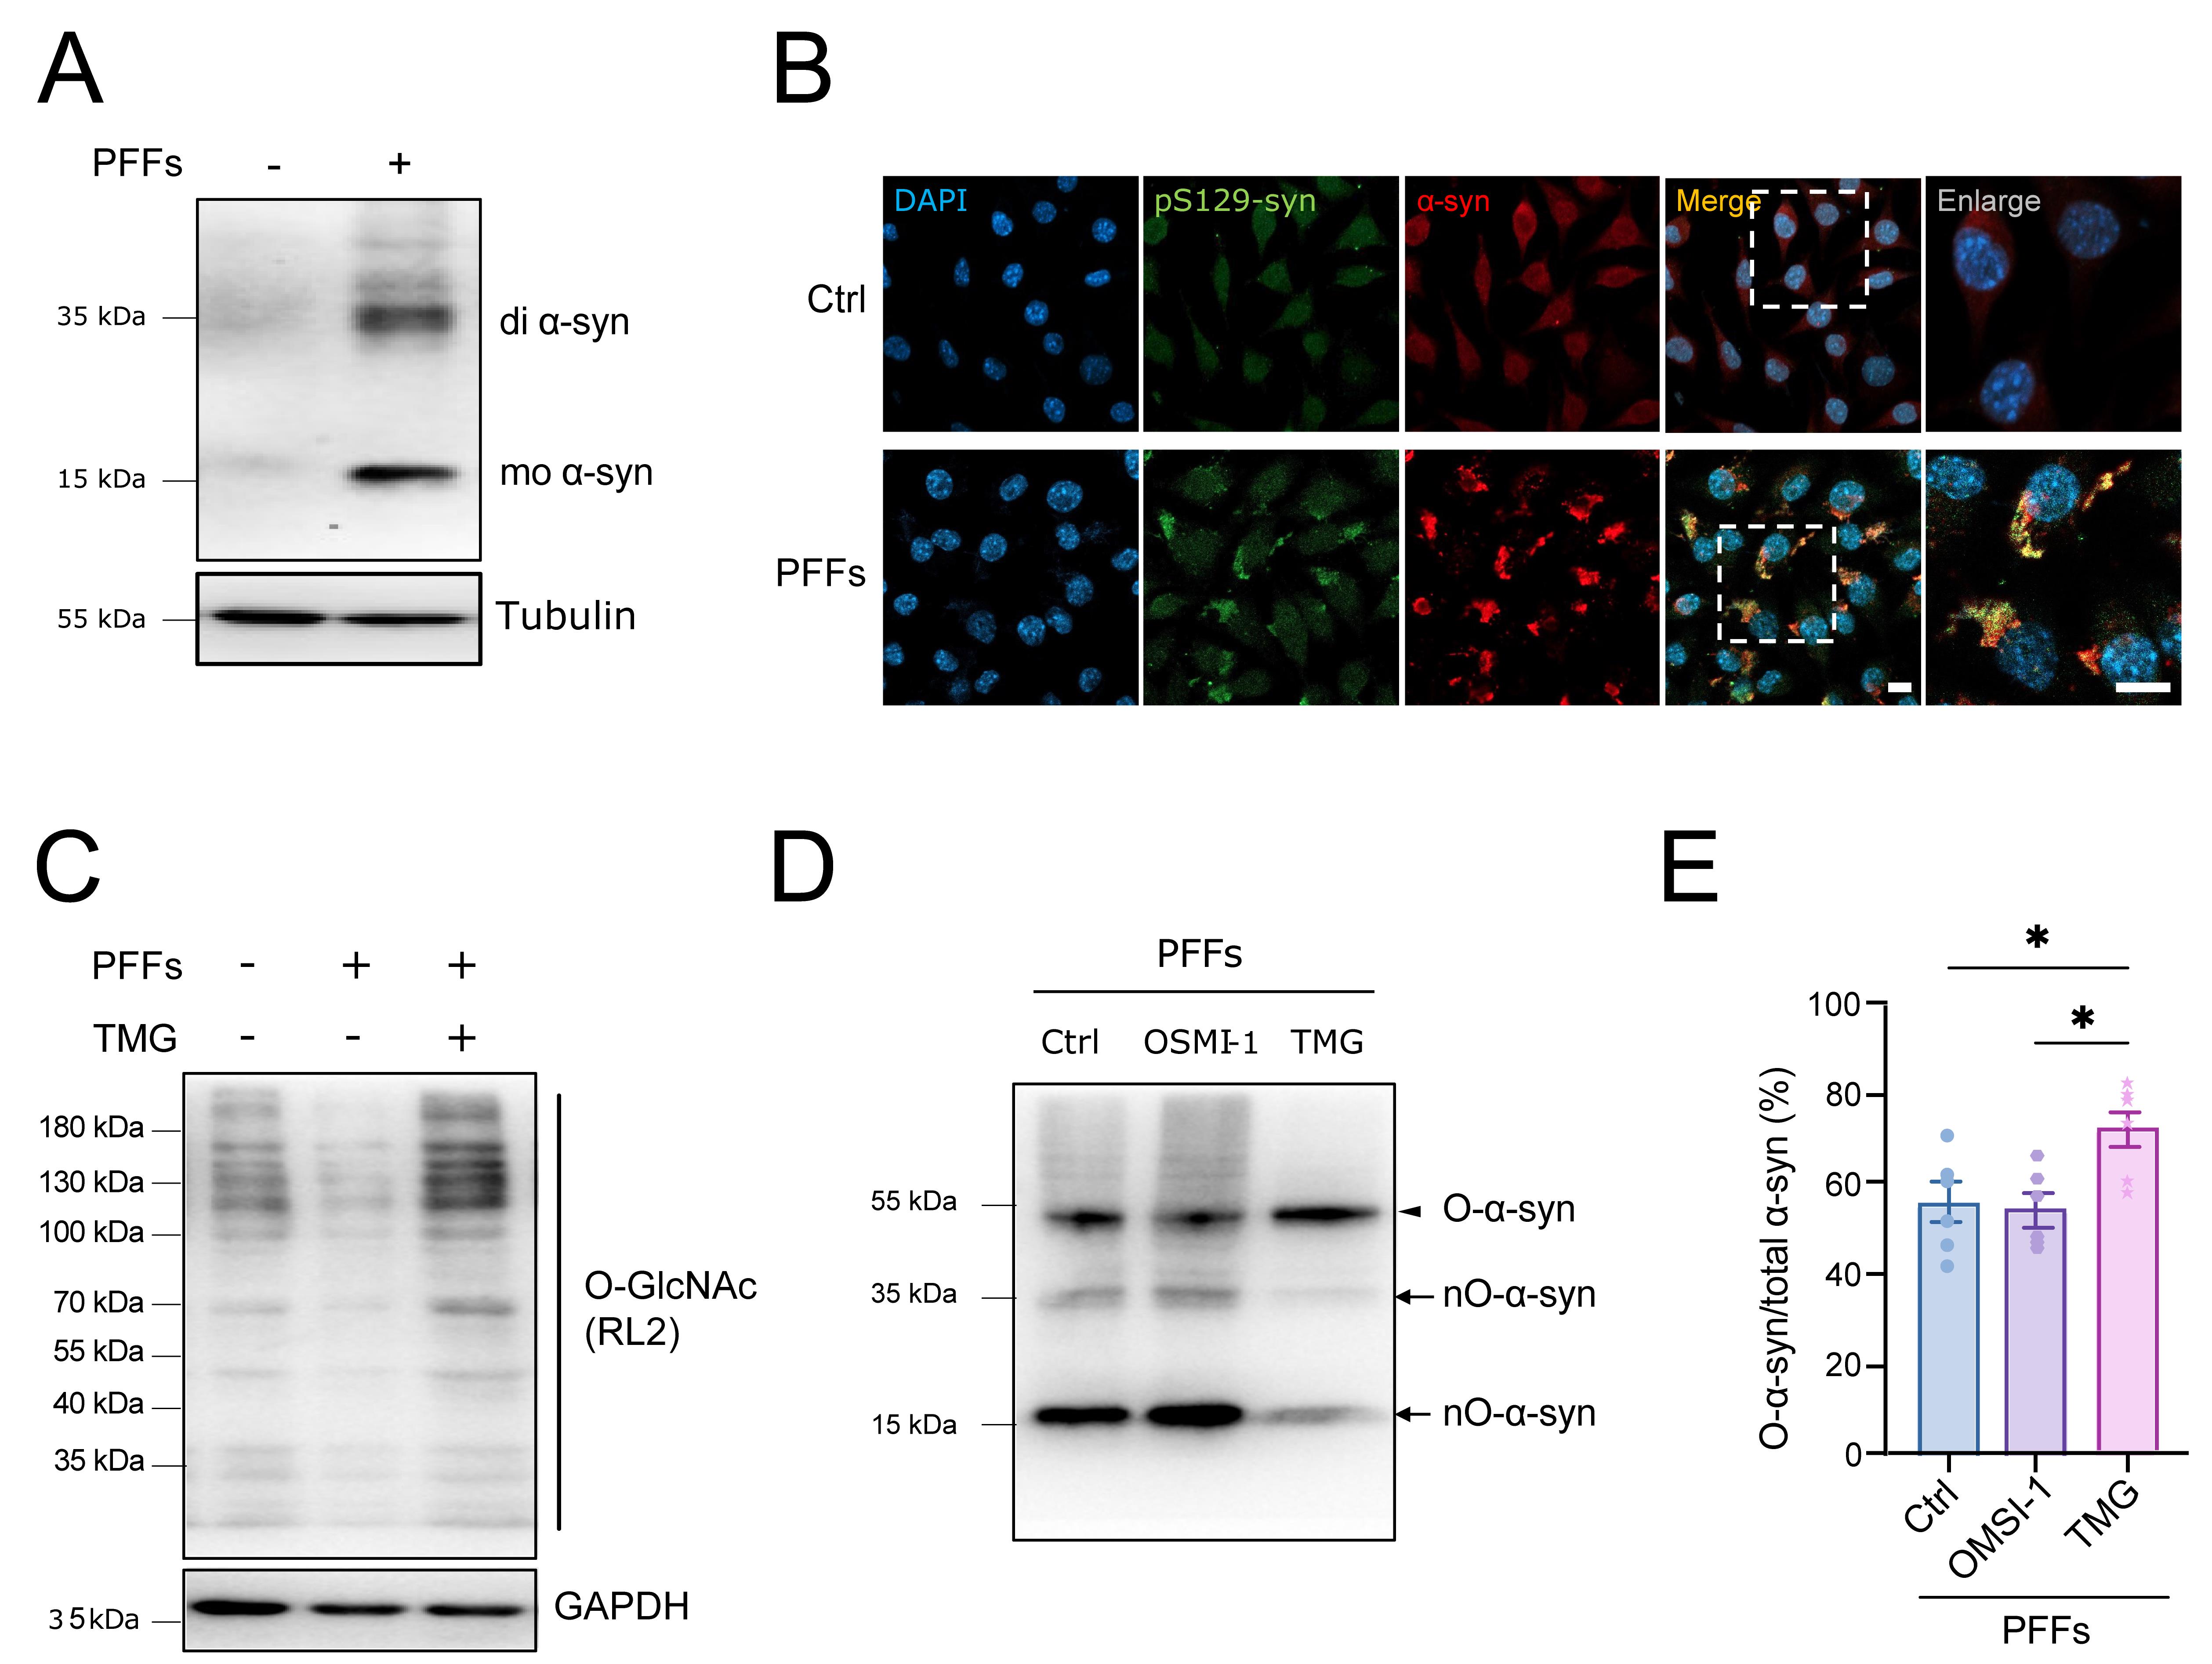
Figure 5. Evaluation of O-GlcNAc modification of α-syn protein in a preformed fibril (PFF)-seeded cell model. (A) Western blot analysis of α-syn in SH-SY5Y cells treated with PFFs. (B) Immunofluorescent staining of aggregated α-syn using rabbit anti-pS129 α-syn and mouse anti-α-syn (LB509) antibody probes. Scale: 20 μm (left) and 10 μm (right). (C) Western blot analysis of total protein O-GlcNAcylation in PFF-seeded SH-SY5Y cells treated with or without Thiamet-G (TMG). GAPDH served as a loading control. (D) Western blot analysis of O-GlcNAcylated α-syn (O-α-syn) in PFF-seeded SH-SY5Y cells. Arrowhead indicates O-α-syn bands that shifted from ~35 kDa (attributed to dimeric α-syn) to a higher molecular weight of ~55 kDa in the presence of GalT1 (Y289L). OSMI-1 and TMG were used to modulate protein O-GlcNAcylation. Arrows indicate non-O-GlcNAcylated α-syn bands (nO-α-syn). (E) Quantification of the proportion (%) of O-α-syn in the total α-syn of cells in the presence and absence of TMG. Experiments encompassed three biological replicates, and each group underwent repeated tests. Results are expressed as mean ± SEM. Significance levels were set at *P < 0.05 through a one-way ANOVA using Tukey's post-hoc test.
This protocol or parts of it have been utilized and validated in the subsequent research article:
• Miao et al. [13]. Modulation of O-GlcNAc cycling influences α-synuclein amplification, degradation, and associated neuroinflammatory pathology. Mol Neurodegener 20(1): 113. https://doi.org/10.1186/s13024-025-00904-2.
General notes and troubleshooting
General notes
1. After fixing cells with 4% PFA/PBS, quench the reaction with 50 mM NH4Cl for 15 min at room temperature to remove free aldehyde groups that could lead to nonspecific antibody binding.
2. Complete labeling is essential for accurate assessment of O-GlcNAcylation stoichiometry as it ensures precise identification and quantification of O-GlcNAc protein modifications.
3. The GalT Y289L enzyme is commercially available as a reagent in the Click-IT O-GlcNAc Enzymatic Labeling System (Thermo Fisher, catalog number: C33368).
4. Allowing the protein pellet to over-dry during precipitation can make resuspension more difficult.
5. Ensure that all buffers are supplemented with a protease inhibitor cocktail, and store samples at 4 °C (or on ice) to prevent degradation. Similarly, all centrifugation steps must be carried out at 4 °C.
6. It should be noted that antibodies may mask internal aggregate-related proteins. In such cases, setting up a control, i.e., a reaction without enzyme addition, is necessary.
Troubleshooting
1. Over-confluence of culture cells can severely affect sampling for labeling and immunostaining. Ensure that cell confluence reaches ~80%–90% before proceeding with transfection, staining, and treatments (related to Section A).
2. N-glycans may contain terminal GlcNAc residues that could affect the labeling reaction catalyzed by GalT. It is recommended that 500 U/μL PNGase F be added to remove N-glycans after the addition of the GalT Y289L enzyme (related to step E1).
3. Incubating for an additional 24 h may improve DBCO-PEG mass tag labeling efficiency. Prolonging the incubation time may increase the level of PEG conjugation (related to step E2b).
Acknowledgments
We thank David Rubinsztein for providing the EGFP-alpha-synuclein-WT plasmid. We express our gratitude to Dr. Y. Imai from Juntendo University for providing valuable suggestions. The authors would like to express their gratitude to EditSprings (https://www.editsprings.com) for the expert linguistic services provided. This work was supported by the Natural Science Foundation of China (NSFC) (82571634, 82171414), the Science and Technology Program of Suzhou (2022SS02), and the Special Launch Fund from Soochow University. This protocol was devised as a part of the published article: Miao et al. [13]. Molecular Neurodegeneration (2025) 20:113 (doi.org/10.1186/s13024-025-00904-2).
Competing interests
The authors declare that they have no conflicts of interest.
References
- Goedert, M., Jakes, R. and Spillantini, M. G. (2017). The Synucleinopathies: Twenty Years On. J Parkinsons Dis. 7(s1): S51-S69. https://doi.org/10.3233/JPD-179005
- Wong, Y. C. and Krainc, D. (2017). alpha-synuclein toxicity in neurodegeneration: mechanism and therapeutic strategies. Nat Med. 23(2): 1–13. https://doi.org/10.1038/nm.4269
- Sulzer, D. and Surmeier, D. J. (2013). Neuronal vulnerability, pathogenesis, and Parkinson's disease. Mov Disord. 28(6): 715-724. https://doi.org/10.1002/mds.25187
- Miao, Y. and Meng, H. (2024). The involvement of alpha-synucleinopathy in the disruption of microglial homeostasis contributes to the pathogenesis of Parkinson's disease. Cell Commun Signal. 22(1): 31. https://doi.org/10.1186/s12964-023-01402-y
- Harackiewicz, O. and Grembecka, B. (2024). The Role of Microglia and Astrocytes in the Pathomechanism of Neuroinflammation in Parkinson's Disease-Focus on Alpha-Synuclein. J Integr Neurosci. 23(11): 203. https://doi.org/10.31083/j.jin2311203
- Zhang, S., Zhu, R., Pan, B., Xu, H., Olufemi, M. F., Gathagan, R. J., Li, Y., Zhang, L., Zhang, J., Xiang, W., et al. (2023). Post-translational modifications of soluble alpha-synuclein regulate the amplification of pathological alpha-synuclein. Nat Neurosci. 26(2): 213–225. https://doi.org/10.1038/s41593-022-01239-7
- Hassanzadeh, K., Liu, J., Maddila, S. and Mouradian, M. M. (2024). Posttranslational Modifications of alpha-Synuclein, Their Therapeutic Potential, and Crosstalk in Health and Neurodegenerative Diseases. Pharmacol Rev. 76(6): 1254–1290. https://doi.org/10.1124/pharmrev.123.001111
- Hardiville, S. and Hart, G. W. (2014). Nutrient regulation of signaling, transcription, and cell physiology by O-GlcNAcylation. Cell Metab. 20(2): 208–213. https://doi.org/10.1016/j.cmet.2014.07.014
- Yang, X. and Qian, K. (2017). Protein O-GlcNAcylation: emerging mechanisms and functions. Nat Rev Mol Cell Biol. 18(7): 452–465. https://doi.org/10.1038/nrm.2017.22
- Bond, M. R. and Hanover, J. A. (2015). A little sugar goes a long way: the cell biology of O-GlcNAc. J Cell Biol. 208(7): 869–880. https://doi.org/10.1083/jcb.201501101
- Marotta, N. P., Lin, Y. H., Lewis, Y. E., Ambroso, M. R., Zaro, B. W., Roth, M. T., Arnold, D. B., Langen, R. and Pratt, M. R. (2015). O-GlcNAc modification blocks the aggregation and toxicity of the protein alpha-synuclein associated with Parkinson's disease. Nat Chem. 7(11): 913–920. https://doi.org/10.1038/nchem.2361
- Balana, A. T., Mahul-Mellier, A. L., Nguyen, B. A., Horvath, M., Javed, A., Hard, E. R., Jasiqi, Y., Singh, P., Afrin, S., Pedretti, R., et al. (2024). O-GlcNAc forces an alpha-synuclein amyloid strain with notably diminished seeding and pathology. Nat Chem Biol. 20(5): 646–655. https://doi.org/10.1038/s41589-024-01551-2
- Miao, Y., Zhang, T., Ma, Z., Du, H., Gu, Q., Jiang, M., Xiong, K., Liu, C. F. and Meng, H. (2025). Modulation of O-GlcNAc cycling influences alpha-synuclein amplification, degradation, and associated neuroinflammatory pathology. Mol Neurodegener. 20(1): 113. https://doi.org/10.1186/s13024-025-00904-2
- Wang, Z., Park, K., Comer, F., Hsieh-Wilson, L. C., Saudek, C. D. and Hart, G. W. (2009). Site-specific GlcNAcylation of human erythrocyte proteins: potential biomarker(s) for diabetes. Diabetes. 58(2): 309–317. https://doi.org/10.2337/db08-0994
- Alfaro, J. F., Gong, C. X., Monroe, M. E., Aldrich, J. T., Clauss, T. R., Purvine, S. O., Wang, Z., Camp, D. G., 2nd, Shabanowitz, J., Stanley, P., et al. (2012). Tandem mass spectrometry identifies many mouse brain O-GlcNAcylated proteins including EGF domain-specific O-GlcNAc transferase targets. Proc Natl Acad Sci USA. 109(19): 7280–7285. https://doi.org/10.1073/pnas.1200425109
- Ramakrishnan, B. and Qasba, P. K. (2013). In vitro folding of beta-1,4galactosyltransferase and polypeptide-alpha-N-acetylgalactosaminyltransferase from the inclusion bodies. Methods Mol Biol. 1022: 321–333. https://doi.org/10.1007/978-1-62703-465-4_24
- Thompson, J. W., Griffin, M. E. and Hsieh-Wilson, L. C. (2018). Methods for the Detection, Study, and Dynamic Profiling of O-GlcNAc Glycosylation. Methods Enzymol. 598: 101–135. https://doi.org/10.1016/bs.mie.2017.06.009
- Darabedian, N., Thompson, J. W., Chuh, K. N., Hsieh-Wilson, L. C. and Pratt, M. R. (2018). Optimization of Chemoenzymatic Mass Tagging by Strain-Promoted Cycloaddition (SPAAC) for the Determination of O-GlcNAc Stoichiometry by Western Blotting. Biochemistry. 57(40): 5769–5774. https://doi.org/10.1021/acs.biochem.8b00648
- Fehl, C. and Hanover, J. A. (2022). Tools, tactics and objectives to interrogate cellular roles of O-GlcNAc in disease. Nat Chem Biol. 18(1): 8–17. https://doi.org/10.1038/s41589-021-00903-6
- Ramakrishnan, B. and Qasba, P. K. (2002). Structure-based design of beta 1,4-galactosyltransferase I (beta 4Gal-T1) with equally efficient N-acetylgalactosaminyltransferase activity: point mutation broadens beta 4Gal-T1 donor specificity. J Biol Chem. 277(23): 20833–20839. https://doi.org/10.1074/jbc.M111183200
- Espargaro, A., Sabate, R. and Ventura, S. (2012). Thioflavin-S staining coupled to flow cytometry. A screening tool to detect in vivo protein aggregation. Mol Biosyst. 8(11): 2839–2844. https://doi.org/10.1039/c2mb25214g
- Ikeda, A., Nishioka, K., Meng, H., Takanashi, M., Hasegawa, I., Inoshita, T., Shiba-Fukushima, K., Li, Y., Yoshino, H., Mori, A., et al. (2019). Mutations in CHCHD2 cause alpha-synuclein aggregation. Hum Mol Genet. 28(23): 3895–3911. https://doi.org/10.1093/hmg/ddz241
Article Information
Publication history
Received: Jan 26, 2026
Accepted: Apr 3, 2026
Available online: Apr 29, 2026
Published: May 20, 2026
Copyright
© 2026 The Author(s); This is an open access article under the CC BY-NC license (https://creativecommons.org/licenses/by-nc/4.0/).
How to cite
Meng, H., Ma, Z., Miao, Y. and Liu, C. (2026). Chemoenzymatic Labeling Method for Detection of O-GlcNAcylated α-Synuclein Proteins by Western Blot. Bio-protocol 16(10): e5692. DOI: 10.21769/BioProtoc.5692.

 Download Citation in RIS Format
Category
Neuroscience > Nervous system disorders > Neurodegeneration
Biochemistry > Protein > Posttranslational modification
Biochemistry > Protein > Labeling
Do you have any questions about this protocol?
Post your question to gather feedback from the community. We will also invite the authors of this article to respond.
 Post a Question


