


- Protocols

- Articles and Issues
- For Authors
- About
- Become a Reviewer


Assessment of Epithelial Barrier Integrity by TEER and FITC-Dextran Permeability Assays

Published: Vol 16, Iss 8, Apr 20, 2026 DOI: 10.21769/BioProtoc.5673 Views: 1124
Reviewed by: Joyce ChiuHsih-Yin TanAnonymous reviewer(s)
 PDF
PDF  Ask a question
Original research article
The authors used this protocol in:

Oct 2025
Advertisement



Protocol Collections
Comprehensive collections of detailed, peer-reviewed protocols focusing on specific topics




Related protocols
Abstract
The integrity of epithelial barriers is essential for maintaining tissue homeostasis, particularly in the intestinal tract, where it separates the host from the complex luminal environment. Two complementary, standard methods for assessing this barrier are transepithelial electrical resistance (TEER), which provides a rapid, non-destructive measure of ionic conductance across tight junctions, and the fluorescein isothiocyanate (FITC)-dextran assay, which directly quantifies paracellular macromolecule flux. This protocol details a robust and reproducible method for performing both assays using intestinal epithelial cell monolayers (e.g., Caco-2, T84) cultured on permeable Transwell supports. We outline the procedure from cell culture and monolayer differentiation to TEER measurement with an Epithelial Volt/Ohm Meter 3 (EVOM3) and the subsequent FITC-dextran permeability assay. By combining these techniques, this protocol provides a comprehensive assessment of barrier function, making it ideal for studying tight junction dynamics and regulation under various experimental conditions, such as cytokine stimulation, drug screening, or microbial challenges.
Key features
• Combines electrical resistance (TEER) and macromolecular flux (FITC-dextran) assays for a comprehensive assessment of intestinal epithelial barrier integrity.
• Applicable to various intestinal models, including Caco-2 and T84 cell lines; can be applied to other immortalized or primary epithelial and endothelial cells.
• Utilizes the Epithelial Volt/Ohm Meter 3 (EVOM3) for accurate, non-destructive, and rapid TEER measurements in intestinal epithelial cell monolayers.
• Provides clear guidelines for EVOM3 electrode handling and measurement to ensure reproducible results.
Keywords: Intestinal barrier TEER
Transepithelial Electrical Resistance
FITC-dextran
Permeability
Caco-2
T84
EVOM3
TEER
Transepithelial Electrical Resistance
FITC-dextran
Permeability
Caco-2
T84
EVOM3
Graphical overview
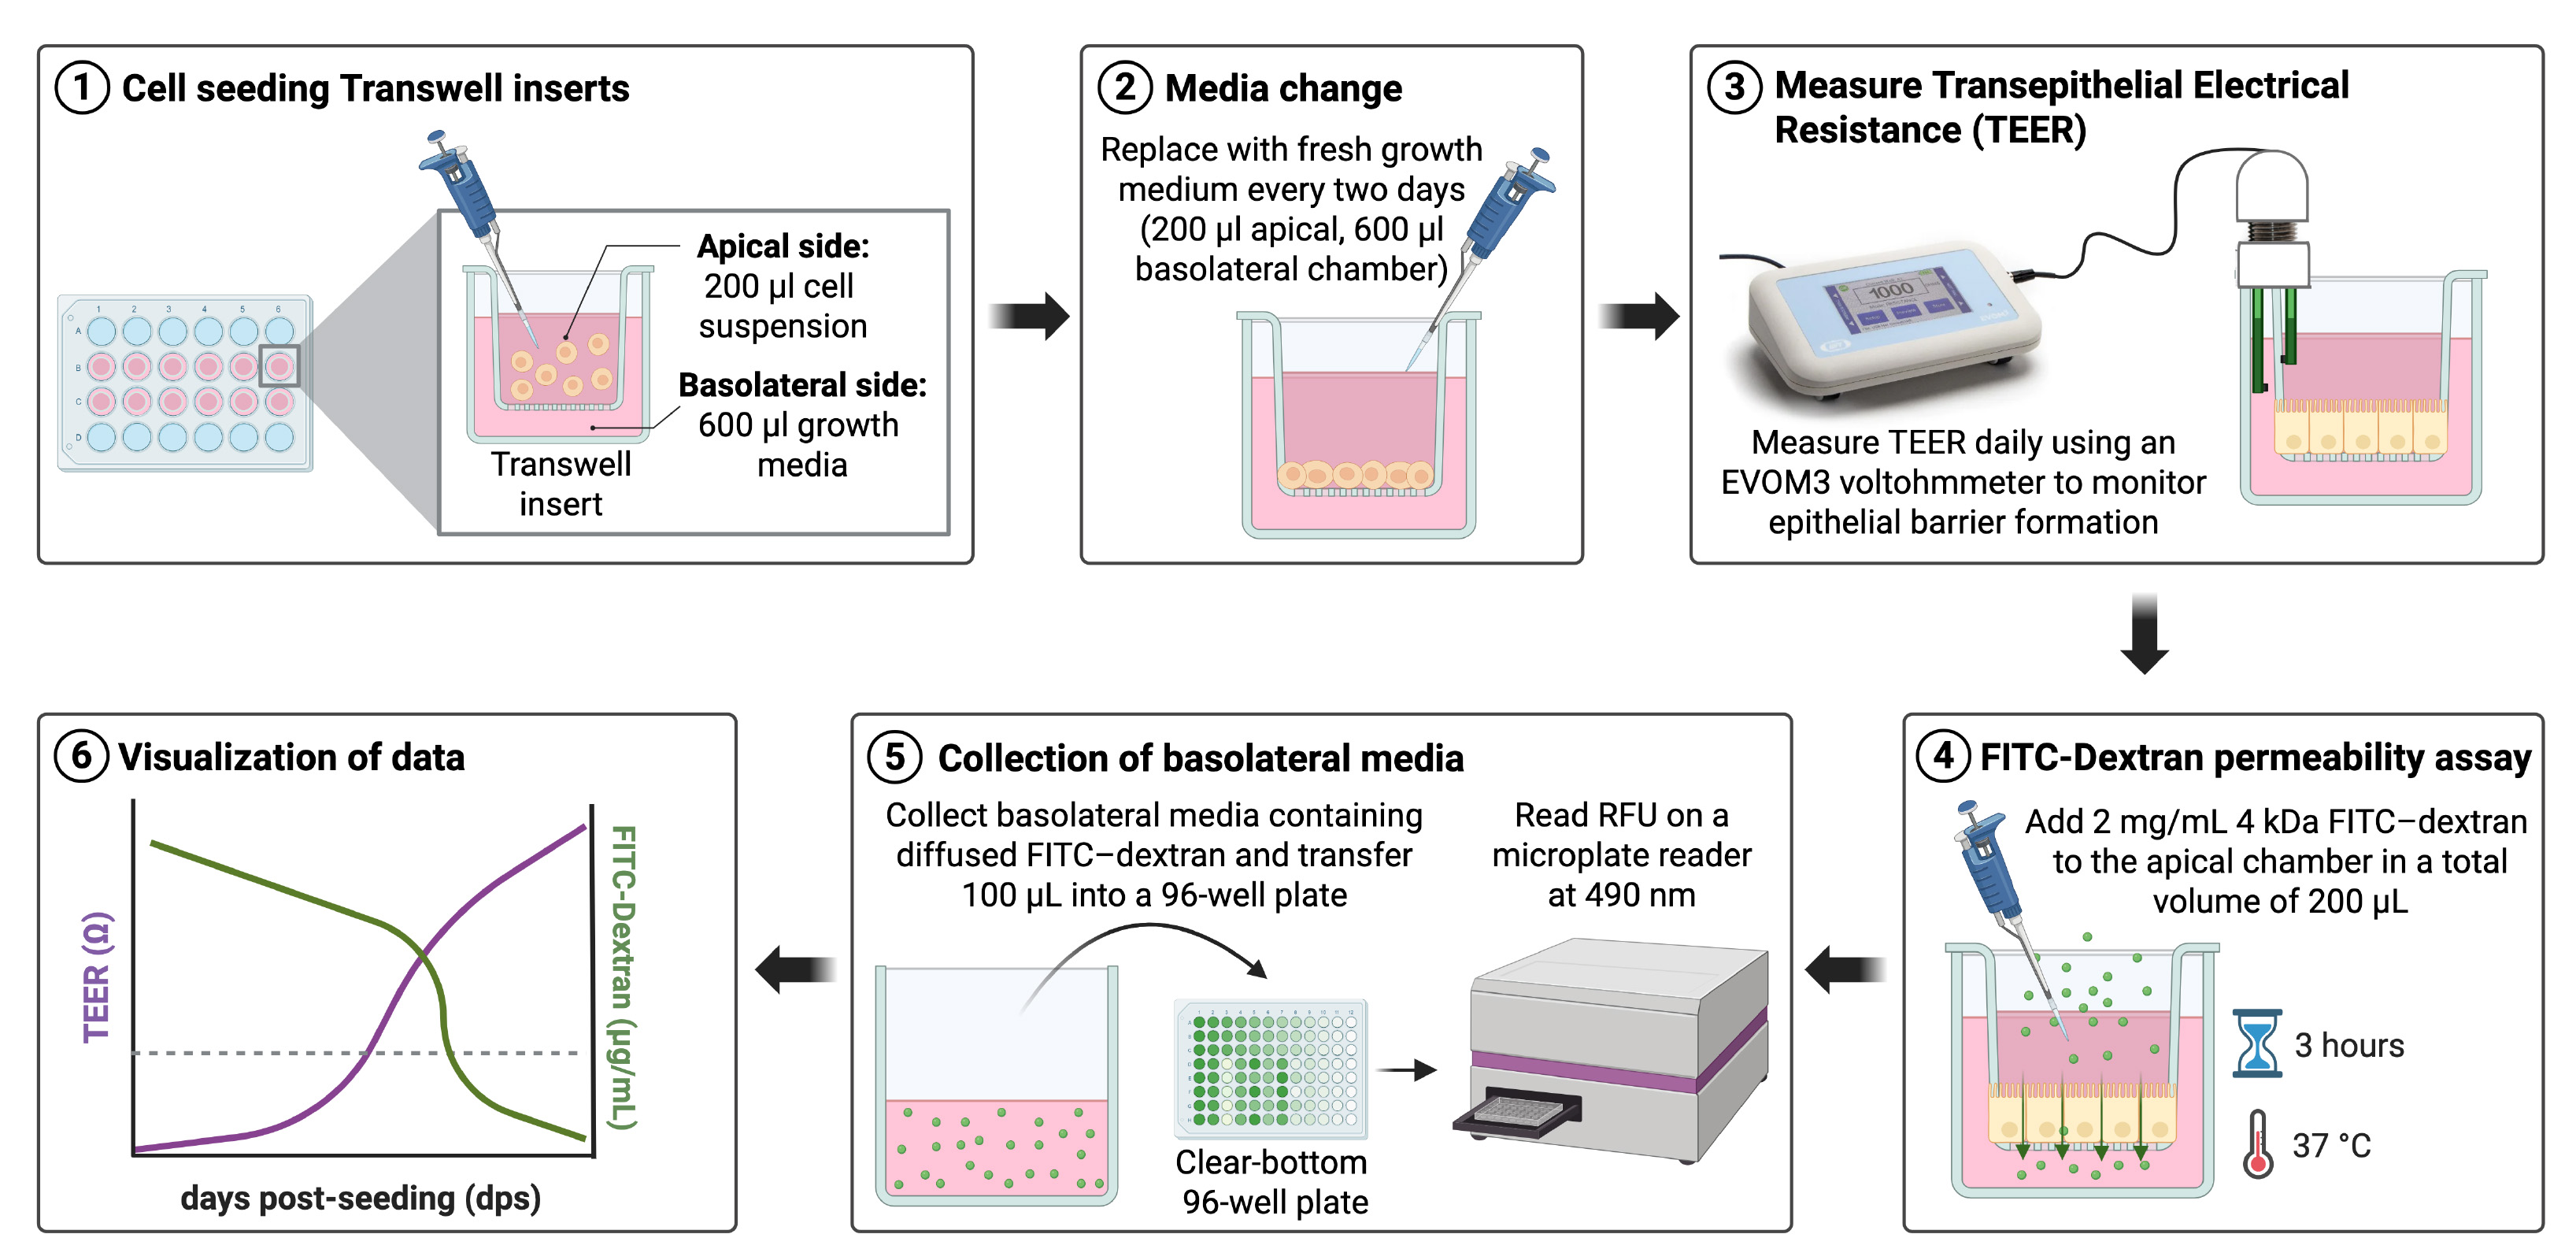
Graphical overview of transepithelial electrical resistance (TEER) measurement and fluorescein isothiocyanate (FITC)-dextran permeability assay. Schematic workflow illustrating the experimental setup and readouts used to monitor epithelial barrier integrity and function. (1) Cells are seeded onto Transwell inserts, with the cell suspension added to the apical chamber (200 μL) and growth medium to the basolateral chamber (600 μL). (2) Growth medium is replaced with fresh medium every two days in both compartments, starting one day post-seeding. (3) TEER is measured daily using an EVOM3 voltmeter to monitor the establishment and maturation of the epithelial barrier. (4) Once the monolayer is established, paracellular permeability is assessed by adding 4 kDa FITC-dextran (2 mg/mL) to the apical chamber in a total volume of 200 μL, followed by incubation for 3 h at 37 °C. (5) Basolateral media containing diffused FITC-dextran are collected and transferred (100 μL) into a clear-bottom 96-well plate, and fluorescence is measured at 490 nm using a microplate reader. (6) TEER values and FITC-dextran flux are visualized over time to assess epithelial barrier formation and permeability.
Background
A fundamental characteristic of intestinal epithelial cells is their highly polarized structure, which establishes two distinct membrane domains: an apical surface facing the intestinal lumen and a basolateral surface facing the underlying tissue [1–3]. This structural and functional asymmetry is essential for the epithelium's dual roles: nutrient absorption and formation of a highly selective barrier against harmful luminal contents like toxins and pathogens [1–3]. This critical barrier function is maintained by the coordinated assembly of intercellular protein complexes, including tight junctions (TJs), which regulate the paracellular pathway, the space between adjacent cells [4–6]. Disruption of the intestinal barrier is a hallmark of various gastrointestinal diseases, including inflammatory bowel disease (IBD) [5,6]. Therefore, accurately quantifying barrier integrity is crucial for both basic research and preclinical studies.
In vitro models using intestinal epithelial cells cultured on porous membrane inserts (e.g., Transwell) are invaluable for these studies, as they recapitulate key features of epithelial polarity and allow for functional assessment [7]. To quantify barrier integrity, two complementary methods are widely employed. The first, transepithelial electrical resistance (TEER), measures the resistance to ion flow across the cell monolayer and serves as a highly sensitive indicator of TJ integrity [7–10]. However, TEER primarily reflects ionic conductance and does not directly measure permeability to larger, non-charged macromolecules [10]. The paracellular flux assay addresses this limitation [11]. By quantifying the passage of inert, fluorescently labeled molecules of a defined size, such as fluorescein isothiocyanate (FITC)-dextran, from the apical to the basolateral compartment, the assay provides direct information on the size-selective properties of the paracellular pathway [11]. This protocol combines both methods, using the EVOM3 Voltohmmeter for sensitive TEER readings and a standard FITC-dextran flux assay, to provide a comprehensive and reliable evaluation of intestinal epithelial barrier function and permeability.
Materials and reagents
Biological materials
1. T84 human colorectal carcinoma cells [American Type Culture Collection (ATCC), catalog number: CCL-248]
2. Caco-2 human colorectal adenocarcinoma cells [American Type Culture Collection (ATCC), catalog number: HTB-37]
Reagents
1. Dulbecco's modified Eagle medium/F12 (DMEM/F12) (Corning, catalog number: MT10092CV)
2. DMEM, high glucose, GlutaMAX supplement, pyruvate (Gibco, catalog number: 10569044)
3. Fetal bovine serum (FBS), heat-inactivated (Sigma-Aldrich, catalog number: 12306C)
4. Penicillin-streptomycin solution (10,000 U/mL) (Thermo Fisher Scientific, catalog number: 15140122)
5. Rat tail collagen type I (Thermo Fisher Scientific, catalog number: CB354249)
6. Phosphate-buffered saline (PBS), 10× powder pH 7.4 (Thermo Fisher Scientific, catalog number: BP665-1)
7. Trypsin-EDTA (0.25%) (Thermo Fisher Scientific, catalog number: 25200056)
8. Trypan Blue solution (0.4%) (Gibco, catalog number: 15250061)
9. Tergazyme, enzyme-active powdered detergent (Thermo Fisher Scientific, catalog number: 16000115)
10. Ethanol, 99.5% (Thermo Fisher Scientific, catalog number: 615090040)
11. FITC-dextran, 4 kDa (Sigma-Aldrich, catalog number: 46944)
12. Sterile distilled water (dH2O) (Thermo Fisher Scientific, catalog number: 10977015)
Solutions
1. Complete growth medium (for T84 cells) (see Recipes)
2. Complete growth medium (for Caco-2 cells) (see Recipes)
3. 1× PBS (see Recipes)
4. 60% EtOH (see Recipes)
5. 70% EtOH (see Recipes)
6. Rat tail collagen coating solution (see Recipes)
7. FITC-dextran working stock (see Recipes)
8. Tergazyme solution (1%) (see Recipes)
Recipes
1. Complete growth medium (for T84 cells)
| Reagent | Final concentration | Quantity (for 500 mL) |
|---|---|---|
| DMEM/F12 | n/a | 445 mL |
| FBS | 10% (v/v) | 50 mL |
| Penicillin-Streptomycin | 100 U/mL | 5 mL |
The prepared media can be stored at 4 °C and used for a month. Warm to 37 °C in a water bath before use.
2. Complete growth medium (for Caco-2 cells)
| Reagent | Final concentration | Quantity (for 500 mL) |
|---|---|---|
| DMEM-GlutaMAX | n/a | 445 mL |
| FBS | 10% (v/v) | 50 mL |
| Penicillin-Streptomycin | 100 U/mL | 5 mL |
The prepared media can be stored at 4 °C and used for a month. Warm to 37 °C in a water bath before use.
3. 1× PBS
| Reagent | Final concentration | Quantity (for 500 mL) |
|---|---|---|
| 10× PBS | 1/10 | 10 mL |
| Sterile dH2O | n/a | 90 mL |
| Total | n/a | 100 mL |
10× PBS powder is used to prepare a 10× PBS stock solution, which can be stored at room temperature for several months.
4. 60% EtOH
| Reagent | Final concentration | Quantity (for 500 mL) |
|---|---|---|
| EtOH, 99.5% | 60% (w/v) | 60 mL |
| Sterile dH2O | n/a | 40 mL |
| Total | n/a | 100 mL |
5. 70% EtOH
| Reagent | Final concentration | Quantity (for 500 mL) |
|---|---|---|
| EtOH, 99.5% | 70% (w/v) | 70 mL |
| Sterile dH2O | n/a | 30 mL |
| Total | n/a | 100 mL |
6. Rat tail collagen coating solution
| Reagent | Final concentration | Quantity (for 100 mL) |
|---|---|---|
| 100× rat tail collagen stock (1 mg/mL) | 10 μg/mL | 1 mL |
| 60% ethanol | n/a | 99 mL |
| Total | n/a | 100 mL |
This is the final working solution used for coating tissue culture flasks and Transwell inserts. The prepared solution can be stored at 4 °C and used for a month.
7. FITC-dextran working stock
| Reagent | Final concentration | Quantity (for 100 mL) |
|---|---|---|
| FITC-dextran | 10 mg/mL | 500 mg |
| Sterile dH2O | n/a | 50 mL |
This is the working stock at 10 mg/mL. Aliquot in microcentrifuge tubes and store at 4 °C in the dark.
8. Tergazyme solution (1%)
| Reagent | Final concentration | Quantity (for 50 mL) |
|---|---|---|
| Tergazyme powder | 1% (w/v) | 0.5 g |
| Sterile dH2O | n/a | to 50 mL |
Laboratory supplies
1. T-25 tissue culture flasks (CellTreat, catalog number: 229331)
2. 24-well cell culture plates (Corning, catalog number: 3527)
3. 6.5 mm Transwell® with 3.0 μm pore polycarbonate membrane insert, sterile (Thermo Fisher Scientific, catalog number: 3415)
4. Clear-bottom 96-well plates (Corning, catalog number: 3595)
5. 15 mL conical tubes (Thermo Fisher Scientific, catalog number: 14955237)
6. Microcentrifuge tubes, 1.5 mL (Thermo Fisher Scientific, catalog number: 05408129)
7. Serological pipettes (5, 10, 25 mL) (MedSupplyPartner, catalog numbers: CT-229005B, CT-229010B, CT-1367811)
8. Pipette tips (p20, p200, p1000), sterile (Thermo Fisher Scientific, catalog number: 12111136)
9. Aspirating pipette (Thermo Fisher Scientific, catalog number: 14955135)
10. Cell counting slides (Bio-Rad, catalog number: 1450015)
11. Aluminum foil
Equipment
1. EVOM3 Voltohmmeter with STX2 electrode (World Precision Instruments)
2. Class II Biological Safety Cabinet (Nuaire, model: NU-425-500)
3. Humidified cell culture incubator (37 °C, 5% CO2) (ThermoFisher, model: HERAcell vios 160i)
4. Automated cell counter (Bio-Rad, model: TC20)
5. 800TS microplate reader (BioSPX, model: BioTek 800TS)
6. Water bath (37 °C) (BioLab)
Procedure
A. Maintain stock cell cultures
1. Flask coating procedure
a. Add 2 mL of rat tail collagen coating solution to a new T-25 tissue culture flask, ensuring the entire bottom surface is covered.
b. Gently rock the flask to distribute the solution evenly across the growth surface.
c. Incubate the flask for either 2 h at 37 °C for same-day use or overnight in the refrigerator (4 °C).
2. Passaging and maintenance
a. Aspirate the cell medium from a confluent flask of T84 or Caco-2 cells and wash the monolayer once with 8–10 mL of sterile PBS.
b. Aspirate the PBS, add 2 mL of 0.25% trypsin-EDTA to the flask, and incubate at 37 °C for 10–25 min. Cells should be checked every 5 min by gently rocking the flask to determine when all cells have detached. If unsure, you can check for detachment by using a cell culture microscope.
Critical: Do not tap the side of the flask. This can cause cells to clump together and fall out of solution.
c. While the cells are trypsinizing, prepare the new coated flask. Aspirate the collagen solution completely, wash the surface twice with 8–10 mL of sterile PBS, aspirate the PBS, and then add 5 mL fresh, prewarmed complete medium.
d. Once the cells have detached, neutralize the trypsin by adding 4 mL of complete medium. Gently pipette up and down to create a single-cell suspension.
e. Transfer the appropriate volume of the cell suspension to the new flask. For example, for a 1:3 split, transfer one-third of the total cell suspension.
Critical: A typical maintenance schedule involves splitting cells 1:3 once or twice per week. Over-splitting (e.g., >1:5) or splitting cells under 70% confluence can cause growth problems. As a complementary method, cell counting can be performed prior to splitting, and cells should be seeded at a density of 2–3 million per flask to ensure optimal growth conditions.
f. Top up media in the flask to a total of 10 mL.
g. The day after splitting, completely aspirate the medium and replace it with 10 mL of fresh, prewarmed complete medium.
Critical: This step is essential for reducing cell stress from cellular debris and ensuring a healthy culture.
B. Cell seeding onto Transwell inserts
1. Coat Transwell inserts
a. Add 100 μL of rat tail collagen coating solution to the apical chamber (inside the insert).
Critical: Ensure the apical surface has enough liquid to prevent the membrane from drying out. An even coating is critical for uniform cell confluence.
b. Incubate the plate for either 2 h at 37 °C for same-day use or overnight at 4 °C.
c. Immediately before seeding, aspirate the coating solution from both chambers and wash twice with sterile PBS, using 300 μL for the apical side and 800 μL for the basolateral side. Remove PBS after the final wash.
Critical: When aspirating from the apical chamber, use a vacuum line fitted with a 200 μL pipette tip and avoid touching the membrane to prevent damage.
2. Prepare and count cell suspension
a. Aspirate the medium from a confluent flask of cells and wash the monolayer once with 8–10 mL of sterile PBS.
b. Remove the PBS, add 2 mL of 0.25% trypsin-EDTA to the flask, and incubate at 37 °C for 10–25 min or until cells have detached.
Critical: Do not shake or tap the flask during the trypsinization process, as this can cause cell clumping and lead to inaccurate cell counting.
c. Neutralize the trypsin by adding 4 mL of complete medium. Gently pipette up and down to create a single-cell suspension.
d. Transfer the cell suspension to a 15 mL Falcon tube.
e. To determine cell viability and concentration, mix 50 μL of the cell suspension with 50 μL of Trypan Blue.
f. Load 10 μL of this mixture into a cell counting chamber and count the cells.
3. Seed cells onto prepared inserts
a. Using the cell count from the previous step, calculate the volume needed to achieve a final density of 1.0–1.5 × 10⁵ cells per insert. Resuspend the required cell pellet in enough complete medium to deliver this density in 200 μL per insert.
b. Add 600 μL of fresh medium to the basolateral chamber of each well.
c. Add 200 μL of the prepared cell suspension to the apical chamber of each insert.
Critical: Pipette the cell suspension gently into the center of the insert to ensure an even monolayer. Avoid touching the membrane with the pipette tip.
4. Differentiate and maintain the monolayer
a. Place the plate in a humidified incubator (37 °C, 5% CO2).
b. Change the medium in both apical and basolateral chambers every 2 days starting day one post-seeding. Aspirate the old media, add 600 μL of fresh medium to the basolateral chamber of each well, and then add 200 μL of fresh medium to the apical chamber of each well.
Critical: When aspirating from the apical chamber, use a vacuum line fitted with a 200 μL pipette tip and avoid touching the membrane to prevent damage.
c. Culture the cells for 1–3 weeks (or according to experimental timeline). Monitor monolayer integrity by measuring TEER (see sections C and D), beginning one day post-seeding.
C. Electrode handling and preparation for TEER measurement
1. Weekly maintenance
Note: This deep cleaning procedure should be performed once a week to remove protein buildup and ensure the electrode remains sensitive and accurate. In this step, the EVOM3 does not need to be connected to the STX2 electrode connector, and a Transwell insert is not required.
a. Take a new, sterile 24-well plate and prepare a cleaning station by adding 1.5 mL of 1% Tergazyme to one well and 1.5 mL of sterile dH2O to an adjacent well.
b. Carefully place only the metal tips of the STX2 electrode into the well containing 1% Tergazyme.
c. Set a timer and allow the tips to soak for 15 min.
d. After the soak, move the electrode tips into the well containing sterile dH2O. Rinse the tips thoroughly by dipping them up and down five times.
Critical: Handle the STX2 electrode carefully to ensure accurate readings and long-term use: never immerse the electrode head, cable, or connector (only the tips), always lift the electrode by its body, and do not soak it in alcohol for more than 30 min to avoid damaging the protective coating.
e. Lift the electrode out of the water and let it air-dry completely inside a biosafety cabinet before starting the measurement or storing it in its original box.
2. Daily maintenance and measurement preparation
Note: This procedure should be performed each day before taking TEER measurements to ensure the electrode is sterile and equilibrated and provides accurate readings.
a. Take a new, sterile 24-well plate. Add 1.5 mL of each of the following solutions to separate wells: 70% ethanol (for disinfection), sterile dH2O (for rinsing), sterile PBS (for equilibration).
b. Connect the EVOM3 to the STX2 electrode cable and turn on the EVOM3.
c. Place only the metal tips of the electrode into the well with 70% ethanol and let them soak for 10 min.
d. After 10 min, move the electrode tips into the well with sterile dH2O. Rinse the tips thoroughly by dipping them up and down five times.
e. Move the rinsed tips into the well with sterile PBS. Allow the electrode to equilibrate for at least 5 min.
Note: After 5 min of equilibration in PBS, check the reading on the EVOM3 meter. It should display a low resistance value (e.g., 0–40 Ω). If the reading is inaccurate, calibrate and re-equilibrate the electrode according to the manufacturer’s protocol before proceeding with measurements.
f. Proceed with the TEER measurement (see Section D) and perform the final cleanup procedure after all measurements (steps C2g–j).
g. Soak the electrode tips in 70% ethanol for 10 min.
h. Rinse the tips thoroughly with sterile distilled water by dipping them up and down five times.
i. Let the electrode air-dry completely inside a biosafety cabinet.
j. Once completely dry, store the electrode in its original box, protected from light, to prepare it for the next use.
D. TEER measurement procedure
Note: Measurements should be performed on at least three biological replicates per condition, with technical consistency ensured by using the same electrode positioning and measurement conditions across all wells to allow a reliable comparison between experimental groups. Barrier formation kinetics and absolute TEER values can vary substantially between different epithelial cell lines and should therefore be interpreted in a cell line–specific manner.
1. Remove the cell culture plate from the incubator and allow it to equilibrate to room temperature for 15–20 min inside a biosafety cabinet. This is critical for obtaining stable and reproducible resistance readings.
Notes:
1. Do not change the cell medium before TEER measurement, as this may cause inconsistent day-to-day readings. If a medium change is required, perform it only after completing the TEER measurement.
2. For immediate TEER measurements performed after experimental stimulation (e.g., infection or treatment), always include an untreated control group for proper comparison of TEER values.
2. Meanwhile, prepare the EVOM3 and STX2 electrode for measurement as described in step C2.
3. To measure a sample well, carefully position the electrode so that the shorter tip is inside the apical chamber, and the longer tip is in the basolateral chamber (Figure 1).
Critical: Ensure the electrode is positioned consistently in the same location for every well and is not touching the cell monolayer or the bottom of the plate. The tips must be fully submerged in the medium.
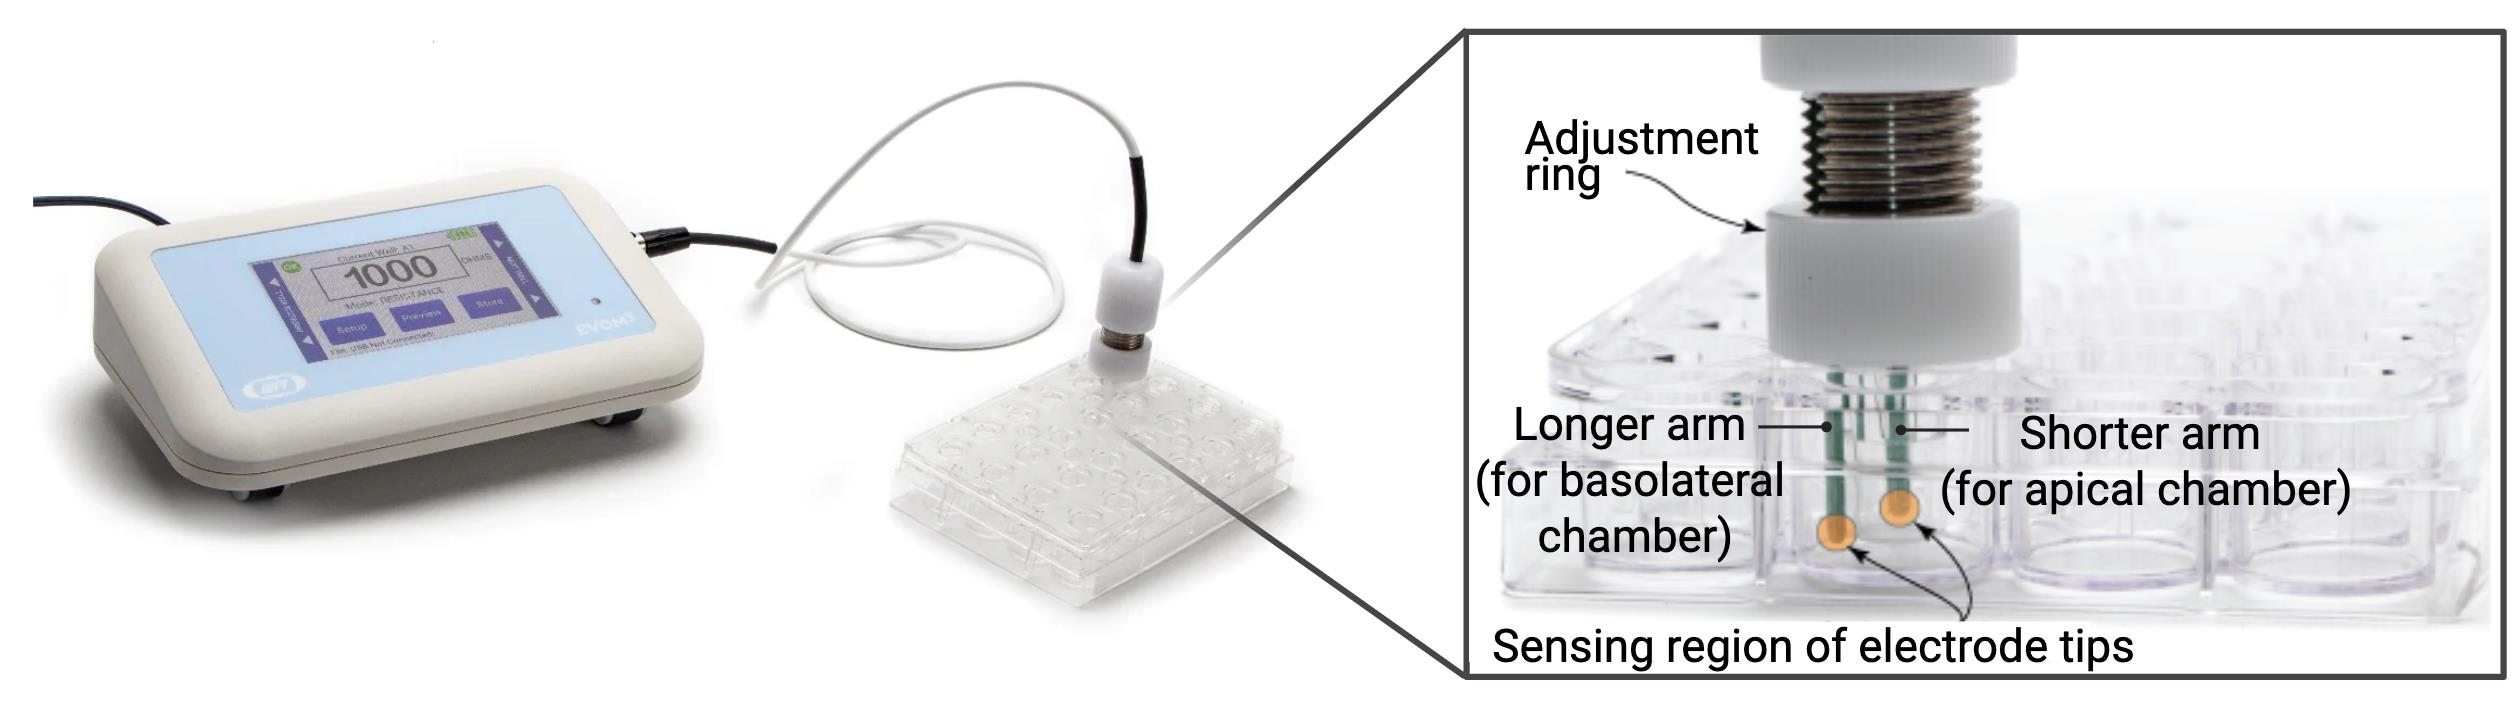
Figure 1. Measurement of transepithelial electrical resistance (TEER) using the EVOM3 voltohmmeter and STX2 electrodes. Representative image of the EVOM3 epithelial voltohmmeter connected to STX2 electrodes positioned in a multiwell Transwell plate for TEER measurements. The magnified schematic illustrates correct electrode placement, highlighting the adjustable ring used to control insertion depth and the asymmetric electrode arms: the longer arm is positioned in the basolateral chamber, while the shorter arm is placed in the apical compartment. The sensing regions at the electrode tips must be fully submerged in medium without touching the cell monolayer or the membrane to ensure accurate and reproducible TEER readings. Images modified from [21,22].
4. Wait for the resistance reading on the EVOM3 display to stabilize, then record the value in ohms (Ω).
Note: Culture times and TEER values vary by cell line. For Caco-2 cells, this typically takes 14–21 days, with a TEER > 300 Ω indicating a well-formed barrier [12–15]. For T84 cells, differentiation is often faster (6–10 days), and a TEER > 1,000 Ω indicates a mature, tight barrier [15–20]. For new cell lines, the rate of TEER and barrier formation must be evaluated.
5. To move between wells while maintaining sterility and preventing cross-contamination (especially when working with different treatments or infectious agents), follow this cleaning procedure:
a. Briefly dip the electrode tips into a well containing 70% ethanol for 2 min.
b. Immediately rinse the tips by dipping them into a separate well containing sterile PBS to remove residual ethanol before proceeding to the next sample.
6. After all measurements are complete, perform the final cleaning procedure (see step C2).
7. Plot TEER values (Ω) on the y-axis and days post-seeding on the x-axis for data visualization, as shown in the example in Figure 2.
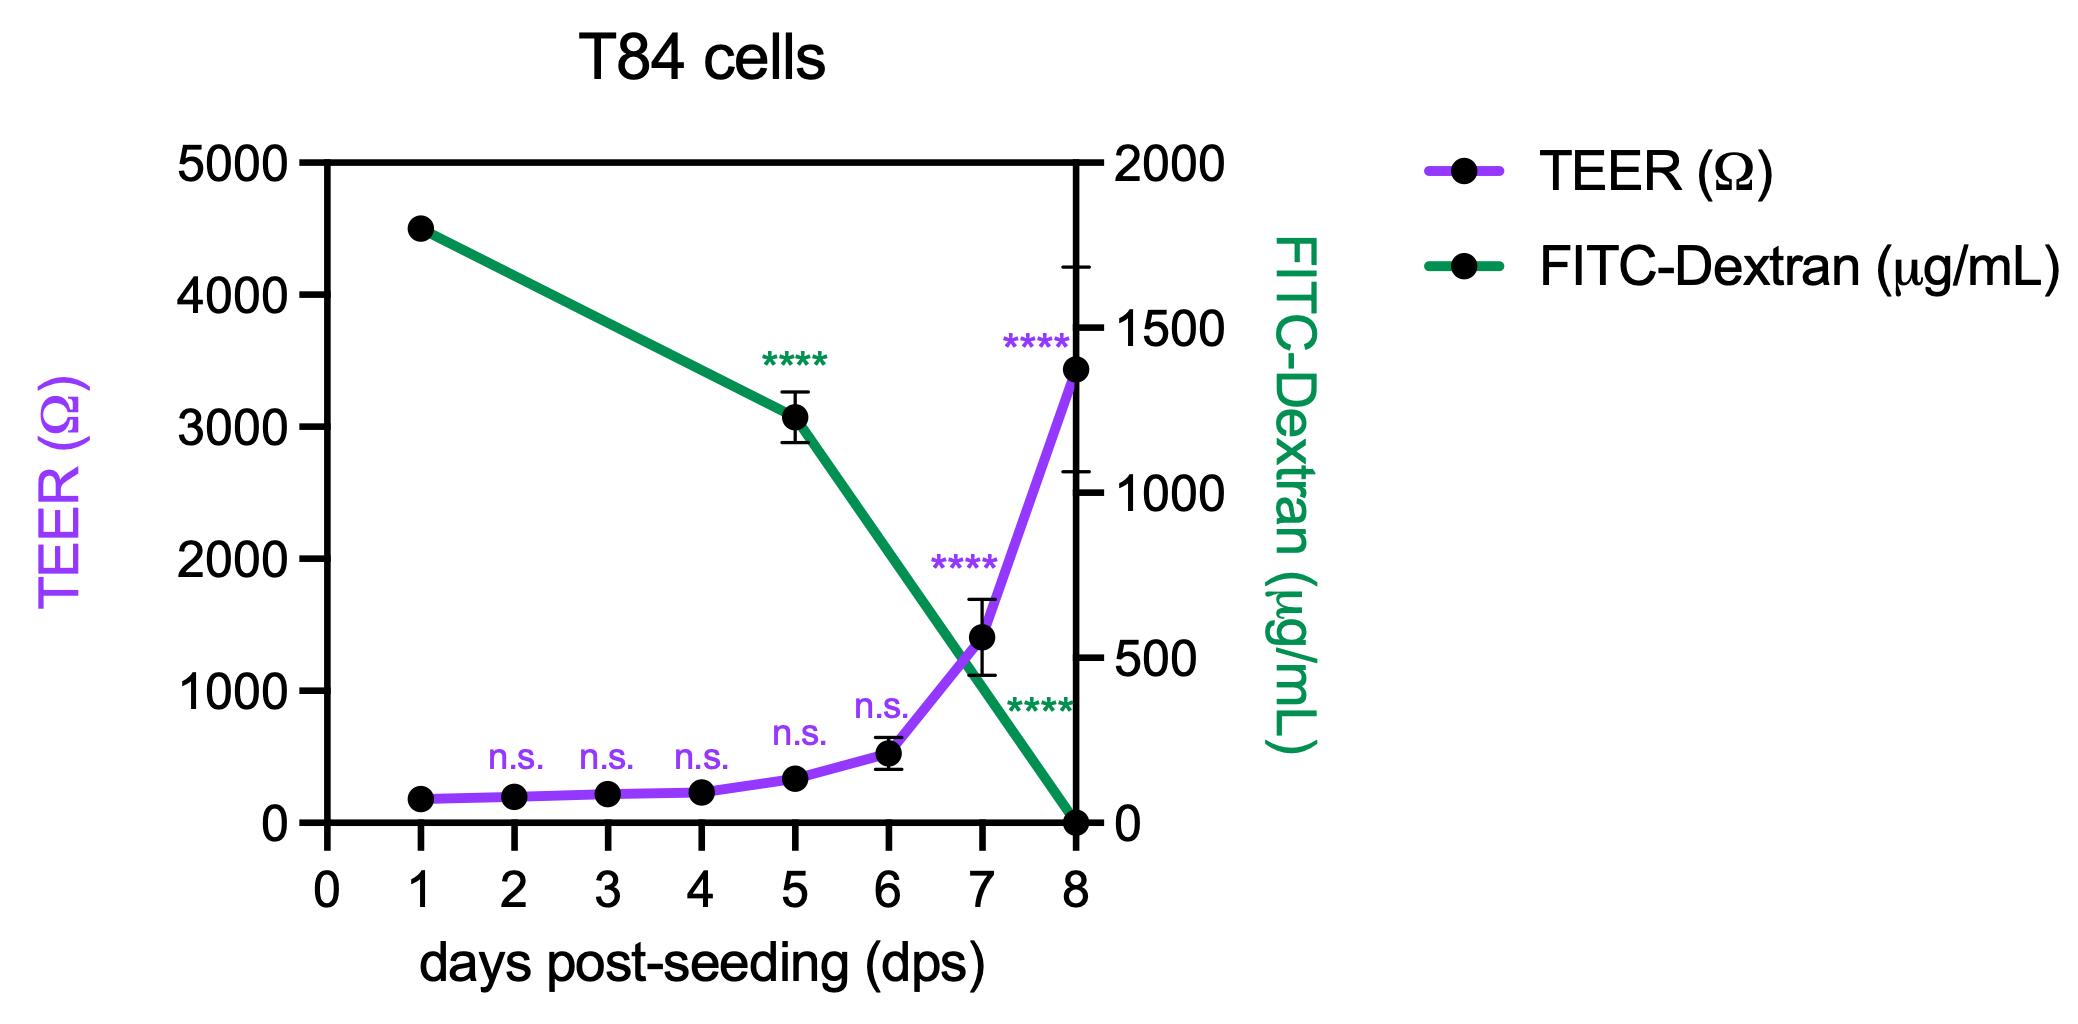
Figure 2. Representative data validating the progressive formation of an intestinal epithelial barrier. T84 cells were seeded at a density of 1.2 × 10⁵ cells per insert onto collagen-coated 24-well Transwell inserts and cultured for 8 days. At the indicated time points, barrier function was assessed using two complementary methods. Transepithelial electrical resistance (TEER, purple line, left y-axis) was measured on the same set of inserts over time (values > 1,000 Ω indicate the formation of efficient barrier function). Simultaneously, a terminal fluorescein isothiocyanate (FITC)-dextran permeability assay was performed on separate, parallel inserts to quantify the flux of 4 kDa FITC-dextran into the basolateral chamber (green line, right y-axis). The graph demonstrates the expected inverse correlation: as the monolayer matures, TEER values steadily increase, indicating the formation of tight junctions, while paracellular permeability to FITC-dextran concurrently decreases. n ≥ 3 biological replicates. Statistical analysis was performed using ordinary one-way ANOVA using the cells at 1-day post-seeding as a reference. n.s. indicates non-significant results (p > 0.05). Error bars represent standard deviation with the mean as the center. Data originally presented in Keser et al. [17].
E. FITC-dextran permeability assay
Note: This is an endpoint assay used to quantitatively assess paracellular permeability. Because Transwell inserts cannot be reused, evaluate permeability at multiple stages of barrier formation (e.g., early, intermediate, and end time points) using separate inserts in parallel with TEER measurements. For robust results, perform each condition with at least three biological replicates. FITC-dextran is light-sensitive; protect all solutions and plates from light.
1. Prepare a 10 mg/mL stock solution of 4 kDa FITC-dextran in sterile dH2O.
Note: Prepare the stock solution in microcentrifuge tubes, wrap them in aluminum foil, and store them at 4 °C, protected from light.
2. Prepare a 2 mg/mL working solution of FITC-dextran by diluting a 10 mg/mL stock solution 1:5 in prewarmed growth media.
3. Prepare the following controls for your experiment:
a. Negative control (intact barrier): Use untreated, healthy cell monolayers to define basal permeability.
b. Positive control (maximum permeability): Use a cell-free, collagen-coated Transwell insert to define maximum diffusion.
4. Gently aspirate the medium from both apical and basolateral chambers.
Critical: When aspirating from the apical chamber, use a vacuum line fitted with a 200 μL pipette tip and avoid touching the membrane to prevent damage.
5. Wash the monolayers three times by adding 300 μL (apical) and 800 μL (basolateral) of sterile PBS for each wash. Aspirate PBS between washes.
6. After the final wash, aspirate the PBS from both apical and basolateral chambers.
7. Add 600 μL of fresh medium to the basolateral chamber of each well (Figure 3).
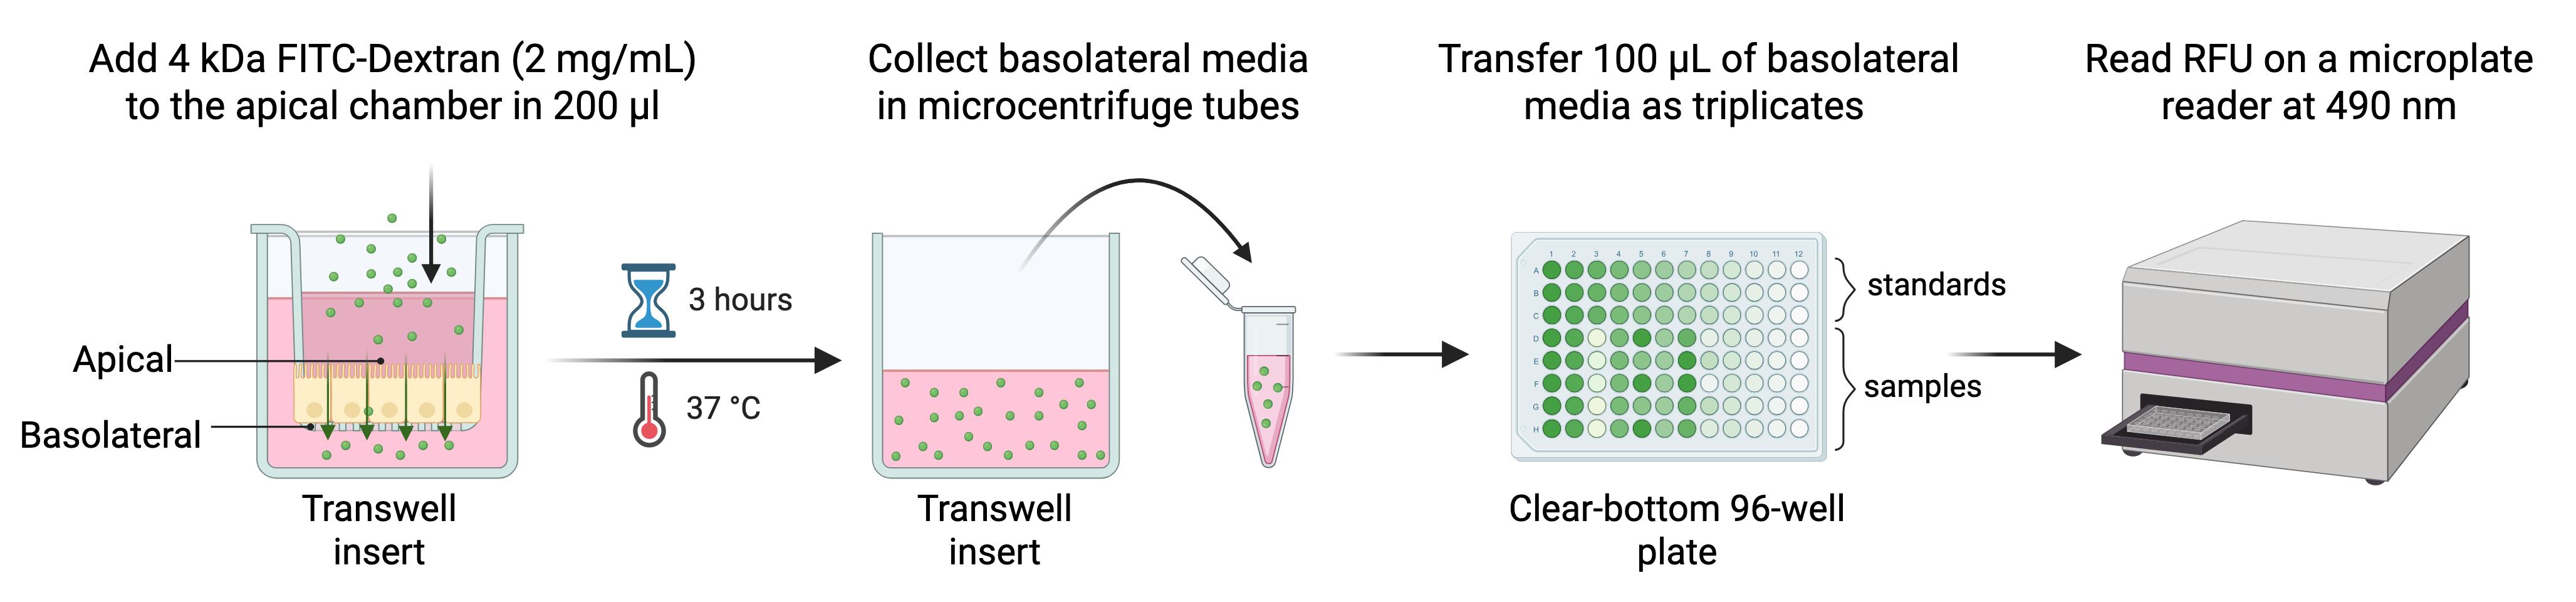
Figure 3. Workflow of the fluorescein isothiocyanate (FITC)-dextran permeability assay in intestinal epithelial monolayers. Schematic overview of the paracellular permeability assay using Transwell inserts. A 4 kDa FITC-dextran solution (2 mg/mL) is added to the apical chamber in a total volume of 200 μL, while the basolateral chamber contains 600 μL of fresh culture medium. Following incubation for 3 h in a humidified incubator (37 °C, 5% CO2), basolateral media containing diffused FITC-dextran are collected into microcentrifuge tubes. 100 μL of basolateral samples is transferred in triplicate to a clear-bottom 96-well plate alongside FITC-dextran standards. Fluorescence is measured using a microplate reader at an excitation wavelength of 490 nm, and fluorescence values are used to quantify epithelial barrier permeability.
8. Add 200 μL of the 2 mg/mL FITC-dextran working solution to the apical chamber of each well (Figure 3).
Critical: Ensure that no FITC-dextran contaminates the basolateral medium, as this would falsely reflect permeability readings.
9. Incubate the plate in a humidified incubator (37 °C, 5% CO2) in the dark for 3 h (Figure 3).
Note: The incubation time may require optimization depending on the experimental model. Time-course sampling (e.g., every 30 min) can be performed to determine the linear transport phase of FITC-dextran permeability.
10. After incubation, carefully remove the apical chamber and collect the medium from the basolateral chamber of each well (~600 μL) in microcentrifuge tubes.
11. Fluorescence measurement (Figure 3)
a. Transfer 100 μL from each collected sample into a clear-bottom 96-well plate. Plate each sample as a technical triplicate.
b. Prepare a standard curve in the same plate by performing 1:2 serial dilutions of the 2 mg/mL FITC-dextran working solution as triplicates.
c. Add 100 μL of cell-free medium to three empty wells to serve as the blank (for background subtraction).
d. Read the fluorescence on a microplate reader at an excitation wavelength of ~490 nm and an emission wavelength of ~520 nm. Record the relative fluorescence units (RFU) for all wells.
12. Calculate basolateral FITC-dextran concentration
a. Calculate the average RFU of the blank wells. Subtract this value from all standard and sample RFU values to correct for background fluorescence.
b. Plot the background-subtracted RFU values of the standards on the y-axis against their known concentrations (in μg/mL) on the x-axis.
c. Perform a linear regression analysis to generate the equation of the line (y = mx + b) and its coefficient of determination (R2).
Note: A valid standard curve ideally should have an R2 value > 0.95.
d. Use the linear regression formula to calculate the concentration of FITC-dextran in each experimental sample using the following equation.
x = basal FITC-dextran concentration (μg/mL)
y = background-subtracted RFU of your sample.
m = slope of the standard curve line.
b = y-intercept of the standard curve line.
e. Average the calculated concentrations from your technical triplicates to obtain the final permeability value (in μg/mL) for each biological replicate.
13. Plot permeability values (μg/mL) on the y-axis and days post-seeding on the x-axis for data visualization, as shown in the example in Figure 2.
Note: Although FD4 permeability is presented as concentration (μg/mL) in this protocol, users may calculate apparent permeability (Papp, cm/s) using standard equations if transport kinetics analysis is required.
Validation of protocol
This protocol or parts of it has been used and validated in the following research articles:
• Keser et al. [17]. Basal IFN-λ2/3 expression mediates tight junction formation in human epithelial cells. EMBO J (Figure 1A, B; Figure 5B–E, G–H; Figure 6H).
• Metz-Zumaran et al. [18]. The population context is a driver of the heterogeneous response of epithelial cells to interferons. Mol Syst Biol (Figure 6D; Figure EV6B).
• Stanifer et al. [16]. Asymmetric distribution of TLR3 leads to a polarized immune response in human intestinal epithelial cells. Nat Microbiol (Extended Data Figure 1A, B; Extended Data Figure 7D).
• Muenchau et al. [15]. Hypoxic Environment Promotes Barrier Formation in Human Intestinal Epithelial Cells through Regulation of MicroRNA 320a Expression. Mol Cell Biol (Figure 1A, B; Figure 2D; Figure 3E; Figure 7A; Figure 8A, B).
• Martínez et al. [19]. miR-16 and miR-125b are involved in barrier function dysregulation through the modulation of claudin-2 and cingulin expression in the jejunum in IBS with diarrhea. Gut (Figure 4C, D).
• Stanifer et al. [20]. Reovirus intermediate subviral particles constitute a strategy to infect intestinal epithelial cells by exploiting TGF-β dependent pro-survival signaling. Cell Microbiol (Figure 1A; Figure 5A; Figure 7A).
General notes and troubleshooting
General notes
1. Cell line specificity: This protocol is optimized for T84 and Caco-2 cells, but barrier formation kinetics and absolute TEER values vary substantially between different epithelial cell lines. It is crucial to empirically determine the optimal seeding density, differentiation time, and expected TEER values for any new cell line used.
2. Sources of variability: Reproducibility is dependent on consistency. Key sources of variability include cell passage number (we recommend using cells within a consistent low-passage range, preferably below passage 30), lot-to-lot differences in serum and collagen, and subtle differences in handling techniques. We recommend documenting these variables carefully.
3. Limitation of direct visualization: The porous membrane of standard Transwell inserts is opaque, which prevents direct visualization of the cell monolayer's confluence and morphology using a routine inverted light microscope. Therefore, TEER measurement serves as the primary non-destructive method to monitor monolayer integrity throughout the differentiation period.
4. Applicability to experimental models: This protocol establishes a baseline for a healthy epithelial monolayer. It is designed to be a platform for further studies, such as investigating the effects of cytokines, drugs, toxins, or microbial pathogens on barrier integrity. When introducing such variables, always include an untreated control group cultured in parallel.
5. Limitations of the in vitro model: While this Transwell system effectively models epithelial barrier function, it is an in vitro simplification. It lacks key physiological components of the intestinal environment, such as resident microbiota, immune cells, and peristalsis, which should be considered when interpreting results.
Troubleshooting
Problem 1: Low or highly variable TEER values across replicate wells.
Possible causes: Incomplete monolayer formation due to insufficient culture time; uneven cell seeding leading to gaps; or poor cell health (e.g., high passage number, mycoplasma contamination).
Solutions: Allow cells to culture for a longer duration until TEER values plateau. Ensure the cell suspension is homogenous before seeding. Use low-passage cells and periodically test for mycoplasma. For visual confirmation of cell growth, which is difficult on the opaque Transwell® membrane, seed cells in parallel into a clear-bottom 96-well plate at the same density. This allows for direct microscopic assessment of cell attachment and confluence, helping to diagnose issues with monolayer formation.
Problem 2: TEER readings are unstable or drift significantly during measurement.
Possible causes: Temperature fluctuations between the incubator and room temperature; a dirty or improperly equilibrated electrode.
Solutions: Always allow the culture plate to equilibrate at room temperature for at least 15–20 min before measuring. Ensure the electrode is cleaned weekly with Tergazyme and properly equilibrated in PBS before each use, as described in section C.
Problem 3: Sudden, unexpected drop in TEER across all or most wells of a plate.
Possible causes: A systemic issue, such as microbial contamination of the medium; a cytotoxic component in a new reagent batch (e.g., serum); or incubator failure (e.g., incorrect CO2 or temperature).
Solution: Visually inspect the plates for signs of contamination (e.g., media color change, turbidity). If contamination is suspected, discard the cultures. Test a new batch of medium or serum and check incubator logs.
Problem 4: Sudden, unexpected drop in TEER in a single well or a few specific wells.
Possible causes: A physical break or tear in the porous membrane of the Transwell® insert or mechanical disruption of the monolayer from scratching with a pipette tip or the electrode.
Solution: Visually inspect the specific insert against a light source for any visible holes or tears in the membrane. If a break is confirmed, exclude that well from the final analysis.
Problem 5: High background fluorescence in negative control wells of the FITC-dextran assay.
Possible causes: Accidental contamination of the basolateral medium with the apical FITC-dextran solution during pipetting; compromised monolayer integrity not detected by TEER; or cell death during the assay incubation.
Solution: Be extremely careful during the addition of the FITC-dextran solution to the apical chamber. Handle cells gently during wash steps to prevent monolayer disruption.
Problem 6: The standard curve for the FITC-dextran assay is not linear (R2 < 0.90).
Possible causes: Inaccurate pipetting during the preparation of serial dilutions; fluorescence reader saturation at higher concentrations; or degradation of FITC-dextran due to excessive light exposure.
Solution: Use calibrated pipettes and ensure thorough mixing at each dilution step. If saturation is an issue, narrow the concentration range of your standards. Keep all FITC-dextran solutions and the final 96-well plate protected from light at all times.
Acknowledgments
Conceptualization, Y.K., S.B., M.L.S.; Investigation, Y.K.; Writing—Original Draft, Y.K.; Writing—Review & Editing, S.B., M.L.S.; Funding acquisition, S.B., M.L.S.; Supervision, S.B., M.L.S.
This work was supported by the National Science Foundation (NSF) grant #2528816 to MS and #2508168 to SB and the National Institute of Health (NIH) R01 grant 1R01AI189780 to MS and 1R01AI185510 to SB. Graphical overview and figures were created with BioRender.com.
This protocol was used in [15–20].
Competing interests
The authors declare no competing interests.
Ethical considerations
This work did not use human or animal subjects and has no ethical considerations.
References
- Buckley, C. E. and St Johnston, D. (2022). Apical–basal polarity and the control of epithelial form and function. Nat Rev Mol Cell Biol. 23(8): 559–577. https://doi.org/10.1038/s41580-022-00465-y
- Roignot, J., Peng, X. and Mostov, K. (2013). Polarity in Mammalian Epithelial Morphogenesis. Cold Spring Harbor Perspect Biol. 5(2): a013789–a013789. https://doi.org/10.1101/cshperspect.a013789
- Anderson, J. M. and Van Itallie, C. M. (2009). Physiology and Function of the Tight Junction. Cold Spring Harbor Perspect Biol. 1(2): a002584–a002584. https://doi.org/10.1101/cshperspect.a002584
- Citi, S., Fromm, M., Furuse, M., González-Mariscal, L., Nusrat, A., Tsukita, S. and Turner, J. R. (2024). A short guide to the tight junction. J Cell Sci. 137(9): e261776. https://doi.org/10.1242/jcs.261776
- Lee, S. H. (2015). Intestinal Permeability Regulation by Tight Junction: Implication on Inflammatory Bowel Diseases. Intest Res. 13(1): 11. https://doi.org/10.5217/ir.2015.13.1.11
- Güemes-González, A. M., Arriaga-Pizano, L. A., Chacón-Salinas, R., Wong-Baeza, I. and Ferat-Osorio, E. (2026). Regulation of Intestinal Permeability in Health and Disease: Possible Therapeutic Applications. Arch Med Res. 57(3): 103321. https://doi.org/10.1016/j.arcmed.2025.103321
- Schweinlin, M., Wilhelm, S., Schwedhelm, I., Hansmann, J., Rietscher, R., Jurowich, C., Walles, H. and Metzger, M. (2016). Development of an Advanced Primary Human In Vitro Model of the Small Intestine. Tissue Eng Part C Methods. 22(9): 873–883. https://doi.org/10.1089/ten.tec.2016.0101
- Wright, C. W., Li, N., Shaffer, L., Hill, A., Boyer, N., Alves, S. E., Venkataraman, S., Biswas, K., Lieberman, L. A., Mohammadi, S., et al. (2023). Establishment of a 96-well transwell system using primary human gut organoids to capture multiple quantitative pathway readouts. Sci Rep. 13(1): e1038/s41598–023–43656–z. https://doi.org/10.1038/s41598-023-43656-z
- Schimetz, J., Shah, P., Keese, C., Dehnert, C., Detweiler, M., Michael, S., Toniatti-Yanulavich, C., Xu, X. and Padilha, E. C. (2024). Automated measurement of transepithelial electrical resistance (TEER) in 96-well transwells using ECIS TEER96: Single and multiple time point assessments. SLAS Technol. 29(1): 100116. https://doi.org/10.1016/j.slast.2023.10.008
- Srinivasan, B., Kolli, A. R., Esch, M. B., Abaci, H. E., Shuler, M. L. and Hickman, J. J. (2015). TEER Measurement Techniques for In Vitro Barrier Model Systems. SLAS Technol. 20(2): 107–126. https://doi.org/10.1177/2211068214561025
- Bednarek, R. (2022). In Vitro Methods for Measuring the Permeability of Cell Monolayers. Methods Protoc. 5(1): 17. https://doi.org/10.3390/mps5010017
- Faralli, A., Shekarforoush, E., Mendes, A. C. and Chronakis, I. S. (2019). Enhanced Transepithelial Permeation of Gallic Acid and (−)-Epigallocatechin Gallate across Human Intestinal Caco-2 Cells Using Electrospun Xanthan Nanofibers. Pharmaceutics. 11(4): 155. https://doi.org/10.3390/pharmaceutics11040155
- Lopez-Escalera, S. and Wellejus, A. (2022). Evaluation of Caco-2 and human intestinal epithelial cells as in vitro models of colonic and small intestinal integrity. Biochem Biophys Rep. 31: 101314. https://doi.org/10.1016/j.bbrep.2022.101314
- Kus, M., Ibragimow, I. and Piotrowska-Kempisty, H. (2023). Caco-2 Cell Line Standardization with Pharmaceutical Requirements and In Vitro Model Suitability for Permeability Assays. Pharmaceutics. 15(11): 2523. https://doi.org/10.3390/pharmaceutics15112523
- Muenchau, S., Deutsch, R., de Castro, I. J., Hielscher, T., Heber, N., Niesler, B., Lusic, M., Stanifer, M. L. and Boulant, S. (2019). Hypoxic Environment Promotes Barrier Formation in Human Intestinal Epithelial Cells through Regulation of MicroRNA 320a Expression. Mol Cell Biol. 39(14): e00553–18. https://doi.org/10.1128/mcb.00553-18
- Stanifer, M. L., Mukenhirn, M., Muenchau, S., Pervolaraki, K., Kanaya, T., Albrecht, D., Odendall, C., Hielscher, T., Haucke, V., Kagan, J. C., et al. (2019). Asymmetric distribution of TLR3 leads to a polarized immune response in human intestinal epithelial cells. Nat Microbiol. 5(1): 181–191. https://doi.org/10.1038/s41564-019-0594-3
- Keser, Y., Metz-Zumaran, C., Uckeley, Z. M., Reuss, D., Doldan, P., Ramsden, J. M., Stanifer, M. L. and Boulant, S. (2025). Basal IFN-λ2/3 expression mediates tight junction formation in human epithelial cells. EMBO J. 44(20): 5785–5815. https://doi.org/10.1038/s44318-025-00539-5
- Metz-Zumaran, C., Uckeley, Z. M., Doldan, P., Muraca, F., Keser, Y., Lukas, P., Kuropka, B., Küchenhoff, L., Rastgou Talemi, S., Höfer, T., et al. (2024). The population context is a driver of the heterogeneous response of epithelial cells to interferons. Mol Syst Biol. 20(3): 242–275. https://doi.org/10.1038/s44320-024-00011-2
- Martínez, C., Rodiño-Janeiro, B. K., Lobo, B., Stanifer, M. L., Klaus, B., Granzow, M., González-Castro, A. M., Salvo-Romero, E., Alonso-Cotoner, C., Pigrau, M., et al. (2017). miR-16 and miR-125b are involved in barrier function dysregulation through the modulation of claudin-2 and cingulin expression in the jejunum in IBS with diarrhoea. Gut. 66(9): 1537.1–1538. https://doi.org/10.1136/gutjnl-2016-311477
- Stanifer, M. L., Rippert, A., Kazakov, A., Willemsen, J., Bucher, D., Bender, S., Bartenschlager, R., Binder, M. and Boulant, S. (2016). Reovirus intermediate subviral particles constitute a strategy to infect intestinal epithelial cells by exploiting TGF-β dependent pro-survival signaling. Cell Microbiol. 18(12): 1831–1845. https://doi.org/10.1111/cmi.12626
- World Precision Instruments. EVOM3TM Epithelial Volt/Ohm Meter. https://wpiinc.com/products/evom3-epithelial-volt-ohm-teer-meter-3 (accessed 18 Jan 2026).
- World Precision Instruments. STX4 EVOMTM Electrode with Removable Blades for TEER in 6.5 mm Inserts. https://www.wpi-europe.com/products/cell--tissue/teer-measurement/accessories-for-legacy-teer-meters/evm-el-03-03-01.aspx (accessed 18 Jan 2026).
Article Information
Publication history
Received: Jan 19, 2026
Accepted: Mar 17, 2026
Available online: Apr 2, 2026
Published: Apr 20, 2026
Copyright
© 2026 The Author(s); This is an open access article under the CC BY-NC license (https://creativecommons.org/licenses/by-nc/4.0/).
How to cite
Keser, Y., Boulant, S. and Stanifer, M. L. (2026). Assessment of Epithelial Barrier Integrity by TEER and FITC-Dextran Permeability Assays. Bio-protocol 16(8): e5673. DOI: 10.21769/BioProtoc.5673.

 Download Citation in RIS Format
Category
Cell Biology > Cell-based analysis > Electrophysiological technique
Cell Biology > Cell structure
Cell Biology > Cell-based analysis > Transport
Do you have any questions about this protocol?
Post your question to gather feedback from the community. We will also invite the authors of this article to respond.
 Post a Question


