- Protocols

- Articles and Issues
- For Authors
- About
- Become a Reviewer

A Simple and Cost-Effective Method for Generating Spheroids From Triple-Negative Breast Cancer Cell Line (MDA-MB-231)


Published: Vol 16, Iss 6, Mar 20, 2026 DOI: 10.21769/BioProtoc.5641 Views: 30
Reviewed by: Elena A. OstrakhovitchLivia E. SimaAnonymous reviewer(s)

Protocol Collections
Comprehensive collections of detailed, peer-reviewed protocols focusing on specific topics


Abstract
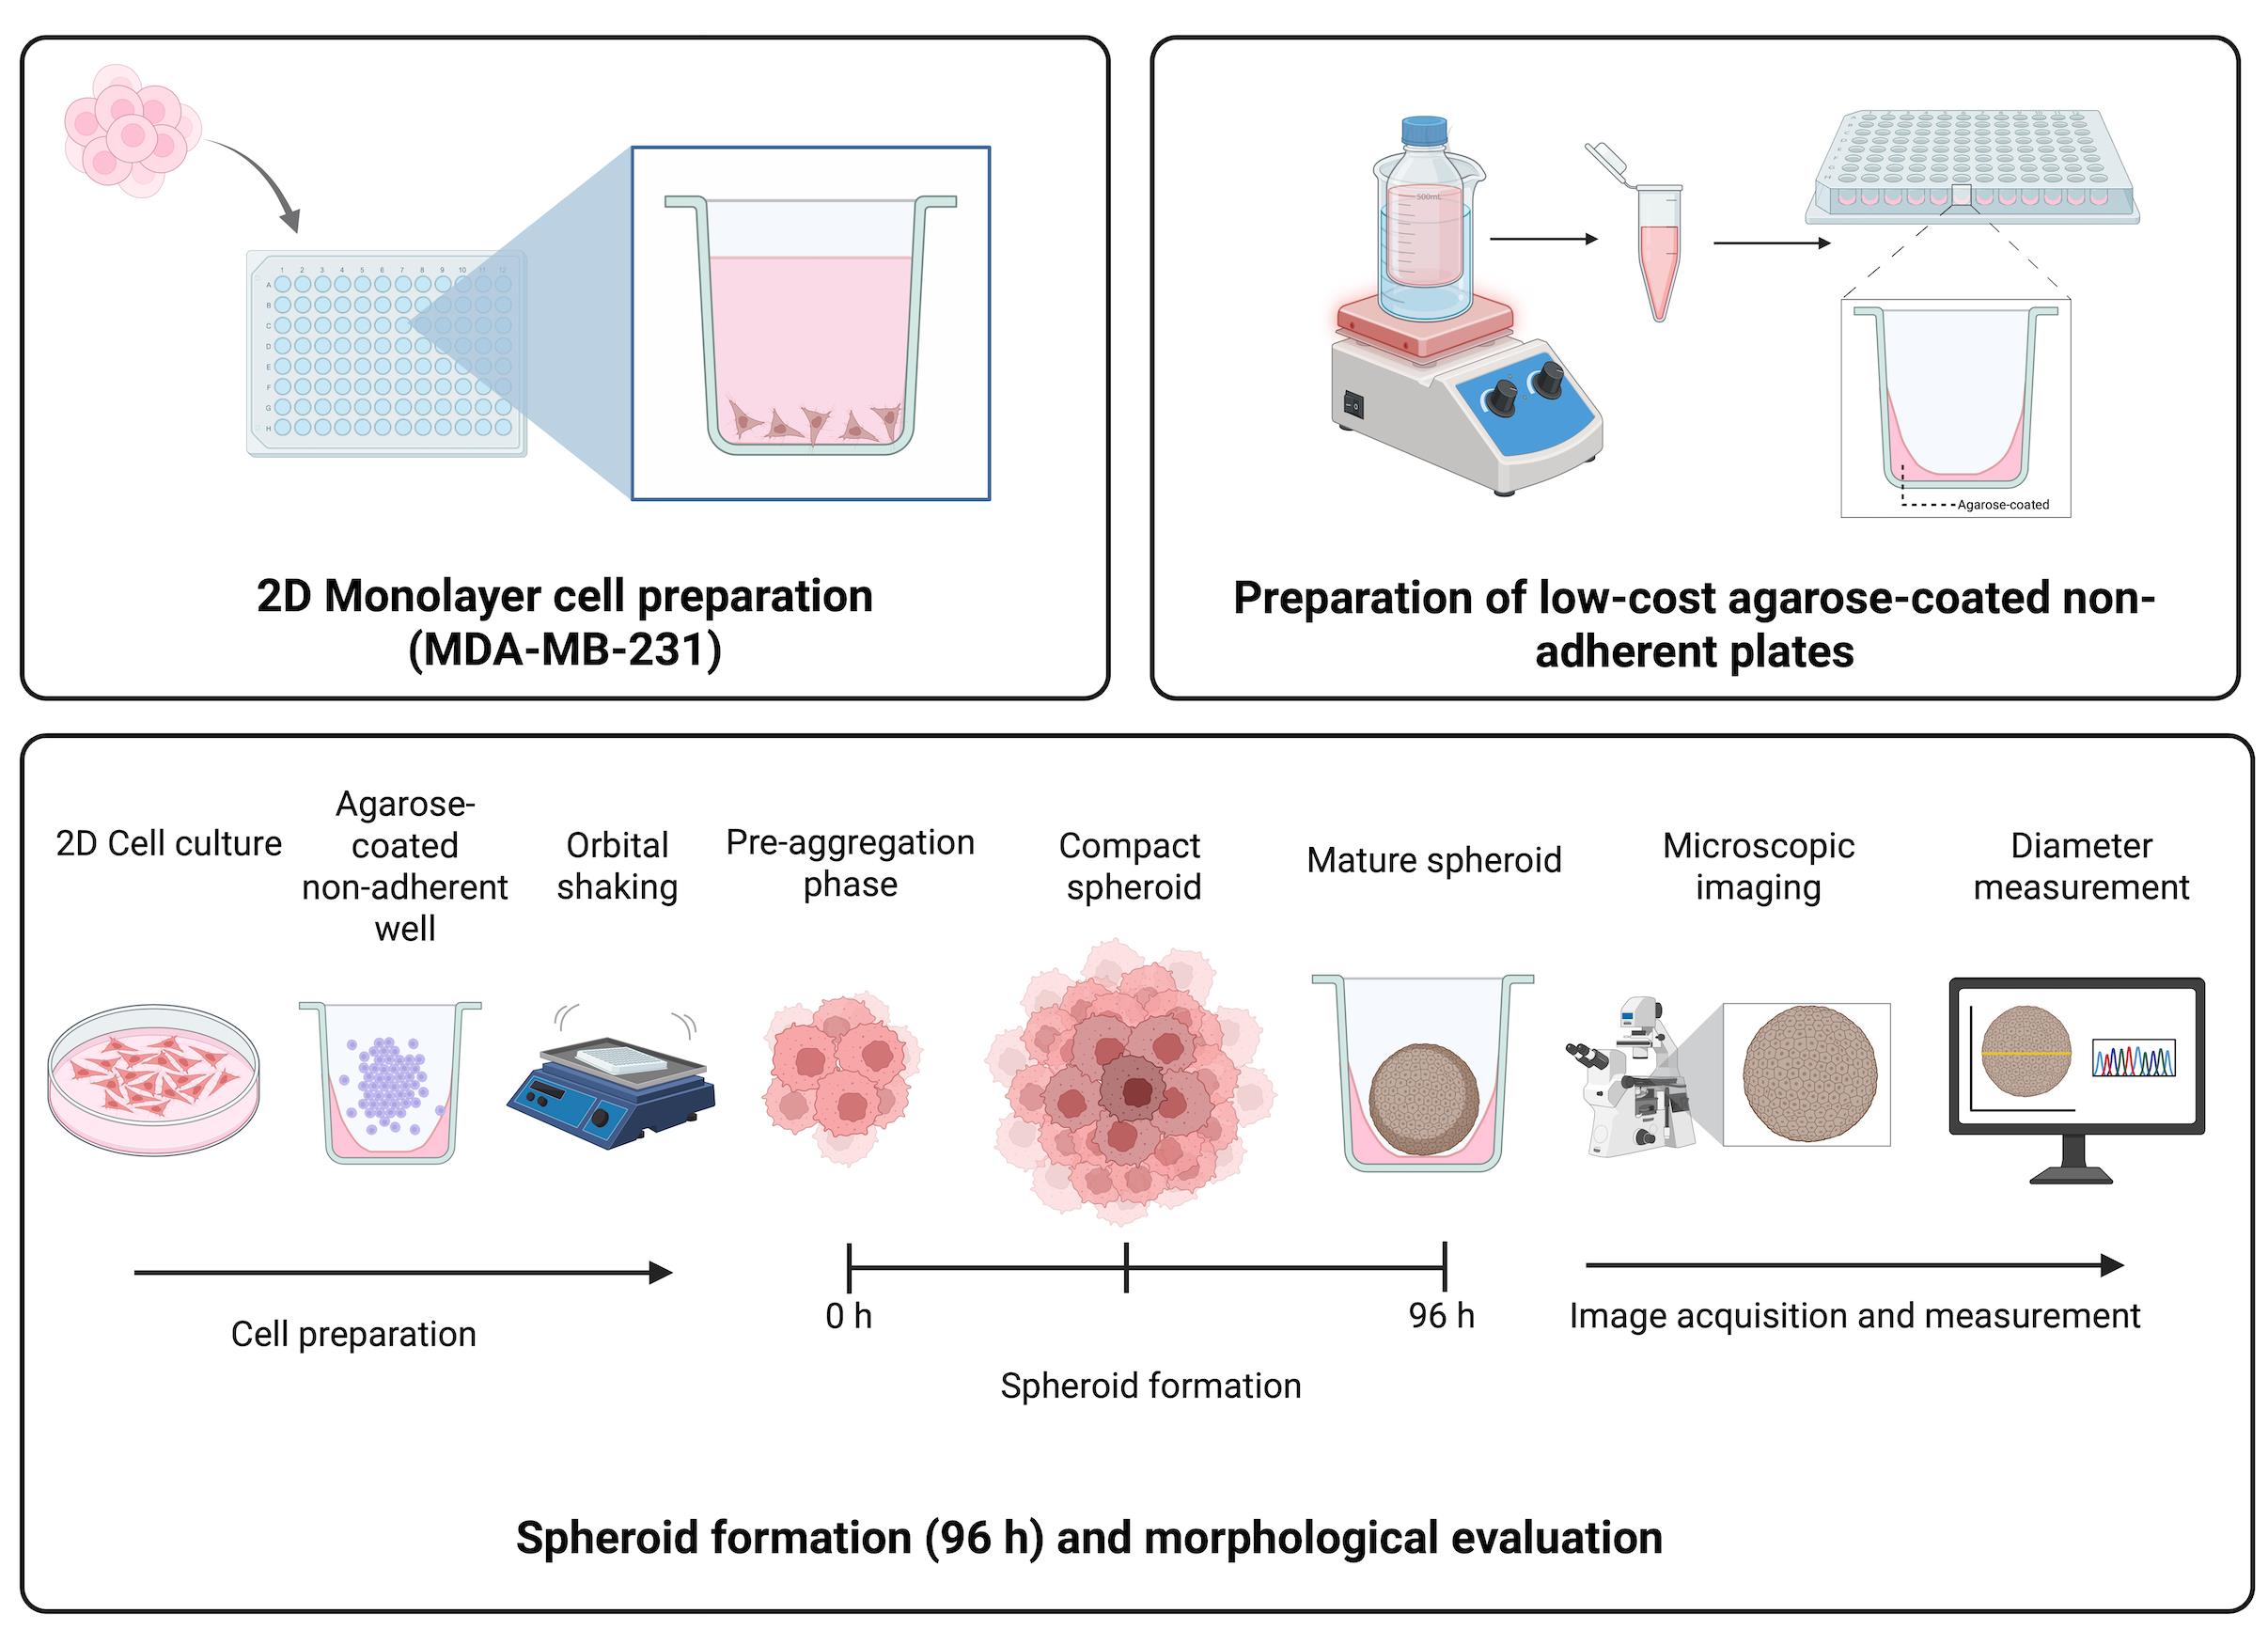
Breast cancer (BC) is the most frequently diagnosed malignancy in women and a leading cause of cancer-related mortality worldwide. Current clinical management relies on molecular classification—based on estrogen receptor (ER), progesterone receptor (PR), HER2, and Ki67 expression—to guide prognosis and therapy. Triple-negative breast cancer (TNBC), which lacks ER, PR, and HER2 expression, represents 15%–20% of cases and is characterized by aggressive behavior, early recurrence, and a paucity of targeted treatment options. These challenges underscore the urgent need for improved preclinical models that better recapitulate tumor biology to accelerate therapeutic discovery. While conventional monolayer (2D) cultures have contributed significantly to cancer research, they fail to mimic critical features of the three-dimensional (3D) tumor microenvironment (TME), thereby limiting clinical translation. To address this gap, 3D spheroid models have emerged as a powerful intermediary, more accurately replicating in vivo conditions such as cell–cell and cell–matrix interactions, nutrient and oxygen gradients, and the development of hypoxic cores. These features make spheroids a physiologically relevant platform for studying complex processes like metastasis, drug resistance, and treatment response. Here, we present a robust, simple, and cost-effective protocol for generating uniform 3D spheroids. Our method enables consistent monitoring of spheroid formation and growth over time, with quantitative, image-based size analysis to ensure reproducibility and scalability. Designed for flexibility, the protocol is broadly applicable across diverse cell types, effectively bridging the gap between traditional 2D cultures and complex in vivo studies. By providing an accessible and reliable model of the 3D TME, this protocol opens new avenues for high-throughput drug screening, mechanistic studies of tumor progression, and the advancement of personalized medicine strategies in breast cancer and beyond.
Key features
• Employs a cost-effective, lab-made agarose coating to create non-adherent surfaces in standard 96-well plates.
• Optimized for reproducible spheroid formation from the aggressive MDA-MB-231 triple-negative breast cancer cell line.
• Requires a brief orbital shaking step to promote homogeneous cell aggregation and formation of a single central spheroid per well.
• Generates measurable spheroids within 96 h using only basic cell culture equipment and an orbital shaker.
• Provides a clear workflow from spheroid formation to quantitative size analysis, using freely available (ImageJ) and widely used (GraphPad Prism) software.
Keywords: Triple-negative breast cancerGraphical overview
Background
Breast cancer (BC) remains the most diagnosed malignancy in women globally and the leading cause of cancer-related deaths [1]. BC is classified into molecular subtypes based on the expression of estrogen receptor (ER), progesterone receptor (PR), human epidermal growth factor receptor 2 (HER2), and the proliferation marker Ki67 [2,3]. These subtypes dictate prognosis and guide therapeutic strategies, with hormone receptor-positive (ER+/PR+) and HER2-enriched tumors benefiting from targeted therapies. Among these, triple-negative breast cancer (TNBC)—defined by the absence of ER, PR, and HER2 expression—represents 15%–20% of all breast cancers and is associated with aggressive clinical behavior, early recurrence, and limited treatment options [4]. Due to its lack of targetable receptors, TNBC patients primarily rely on chemotherapy, highlighting the urgent need for novel therapeutic approaches.
For decades, monolayer (2D) cell cultures have been the cornerstone of cancer research, enabling foundational discoveries in cell proliferation, migration, and drug screening [5]. However, these models fail to recapitulate the three-dimensional (3D) architecture and tumor microenvironment (TME) of in vivo tumors, leading to discrepancies in drug responses and mechanistic studies [6]. To bridge this gap, 3D spheroid models have emerged as a powerful tool, better mimicking the complexity of solid tumors [7]. These models incorporate cell–cell and cell–matrix interactions, polarization and spatial organization, oxygen and nutrient gradients, metabolic heterogeneity, and hypoxic cores that resemble in vivo conditions. As a result, spheroids provide a more physiologically relevant platform for studying tumor invasion and metastasis, drug resistance mechanisms, therapeutic screening, and personalized medicine approaches [8,9].
Recent advances in scaffold-based and scaffold-free spheroid generation techniques have improved reproducibility and scalability [10,11]. Among scaffold-free methods, the use of non-adherent surfaces is a cornerstone. Agarose coating is a well-established technique for creating non-adherent surfaces, promoting cell aggregation by minimizing substrate attachment. Previously described methodologies include coating standard multi-well plates with a thin layer of agarose [12, 13] and using agarose micromolds to create arrays of spheroids with uniform size and shape [14]. These approaches are valued for their simplicity, low cost, and compatibility with standard laboratory equipment. Other prevalent methods include the hanging drop technique, commercially available ultra-low attachment (ULA) plates with covalently modified hydrogel surfaces, and more complex microfluidic systems [10,11].
The spheroid generation method presented here, utilizing agarose-coated plates, aligns with this tradition of simple, accessible tools. Its primary advantages are universal applicability, minimal equipment requirements, and very low cost per sample, making it ideal for labs initiating 3D culture work or for high-volume exploratory studies. However, when compared to other published methods, the proposed protocol has inherent limitations. While ultra-low attachment plates offer superior reproducibility and higher throughput for screening assays, and microfluidic systems provide exquisite control over the microenvironment and dynamic perfusion, our agarose-coating method may exhibit more variability in spheroid size and shape between wells.
Despite these limitations, the protocol offers a simple, cost-effective, and universally applicable strategy to harness the power of 3D cell culture. Its ability to produce reliable in vitro models that accurately mimic key in vivo conditions remains a crucial advantage. We anticipate that the widespread adoption of this foundational protocol will enhance the predictive power of preclinical drug screening and serve as a robust tool for personalized therapy cancer research, particularly in settings where resource-intensive technologies are not available.
Materials and reagents
Biological materials
1. MDA-MB-231 cell line (ATCC, catalog number: CRM-HTB-26)
Reagents
1. Dulbecco’s modified Eagle medium (DMEM) (Merck, catalog number: D5648) or RMPI media
2. L-glutamine (Gibco, catalog number: 20530-081)
3. Amphotericin B (Sigma-Aldrich, catalog number: A2942)
4. Fetal bovine serum (FBS) (BioWest, catalog number: BIO-S1400)
5. Bovine calf serum (BCS) (BioWest, catalog number: S0400-500)
6. Penicillin-streptomycin (Gibco, catalog number: 15120122)
7. Trypsin (Sigma-Aldrich, catalog number: T4799-5G9)
8. Ethylenediaminetetraacetic acid (EDTA) (J.T. Baker, catalog number: 8993-01)
9. Sodium chloride (NaCl) (J.T. Baker, catalog number: 3624-01)
10. Sodium phosphate, 7-hydrate, crystal (J.T. Baker, catalog number: 3824-01)
11. Monobasic potassium phosphate crystal (J.T. Baker, catalog number: 3824-01)
12. Potassium chloride (KCl) (J.T. Baker, catalog number: 3040-01)
13. Non-adherent 96-well plates
14. Agarose (Invitrogen, catalog number: 16500-100)
15. MilliQ water sterile water (J.T. Baker, catalog number: 4220-20)
16. Sodium bicarbonate (NaHCO3) (J.T. Baker, catalog number: 3506-01)
17. Sodium phosphate (NaH2PO4) (J.T. Baker, catalog number: 3818-01)
18. Monopotassium phosphate (KH2PO4) (J.T. Baker, catalog number: 3246-01)
Laboratory supplies
1. Pipette tips: 1,000 μL (Uniparts, catalog number: 51131), 200 μL (Uniparts, catalog number: 51121Y), 10 μL (Axygen, catalog number: T-300)
2. MF-Millipore 0.22 μm MCE membrane, 47 mm (Merck, catalog number: GSWP04700)
3. Nitrile gloves (Kirkland Signature, catalog number: B0CJ4JMTQQ)
4. Culture tube, 15 mL (Uniparts, catalog number: 34117F)
5. Cell culture dish, 60 mm × 15 mm (Nest, catalog number: 705001)
6. Cell culture plate, 96 wells, flat bottom, tissue culture (TC) grade (Nest, catalog number: 701001)
7. Conical-bottom centrifuge tubes, 50 mL (Uniparts, catalog number: 32117F)
8. Conical-bottom centrifuge tubes, 15 mL (Uniparts, catalog number: 34117F)
9. Microcentrifuge tubes, 1.5 mL (Axygen, catalog number: MCT-150-C)
10. Serological pipettes, 2 mL (Corning, catalog number: 4486)
Solutions
1. Culture medium for MDA-MB-231 cells (DMEM complete medium) (see Recipes)
2. 1.5% agarose solution (see Recipes)
3. 1× PBS solution (see Recipes)
4. 0.04% Trypsin-EDTA (see Recipes)
Recipes
1. Culture medium for MDA-MB-231 cells (DMEM complete medium)
| Reagent | Final concentration | Quantity |
|---|---|---|
| DMEM powder | — | As required |
| Sodium bicarbonate (NaHCO3) | 3 g/L | 3 g |
| FBS | 5% (v/v) | 50 mL |
| BCS | 5% (v/v) | 50 mL |
| Penicillin–streptomycin | 1% (v/v) | 10 mL |
| Amphotericin B | 0.05% (v/v) | 500 μL |
| L-glutamine (200 mM) | 0.05% (v/v) | 500 μL |
| Sterile distilled water | — | To 1 L |
a. Dissolve DMEM powder in sterile distilled water and stir until completely dissolved.
b. Add 1.5 g of NaHCO3.
c. Adjust the pH to 7.4 by carefully adding drops of NaOH (1 M) or HCl (1 M), as needed.
d. Under a laminar flow hood, supplement the medium with the following components: FBS, BCS, 1% penicillin–streptomycin, 0.05% Amphotericin B, and 0.05% L-Glutamine 200 mM.
Note: This medium supports the growth of MDA-MB-231 cells under standard culture conditions. After preparation, the complete medium should be sterilized by filtration (0.22 μm MCE membrane in a vacuum filtration system) and stored at 4 °C for up to 4 weeks.
2. 1.5% agarose solution
| Reagent | Final concentration | Quantity |
|---|---|---|
| Agarose | 1.5% (w/v) | 1.5 g |
| Triple-distilled water | — | To 100 mL |
a. Add 1.5 g of agarose to 100 mL of triple-distilled water in a glass flask.
b. Sterilize the solution by autoclaving for 15 min.
Note: This agarose solution is used to generate non-adherent surfaces in standard 96-well plates. The prepared solution should be sterilized by autoclaving and used fresh or maintained at ~60–70 °C until dispensing.
3. 1× PBS solution
| Reagent | Final concentration | Quantity |
|---|---|---|
| NaCl | 137 mM | 8.0 g |
| KCl | 2.7 mM | 0.2 g |
| Disodium phosphate (Na2HPO4) | 10 mM | 1.44 g |
| Monopotassium phosphate (KH2PO4) | 1.8 mM | 0.24 g |
| Triple-distilled water | — | To 1 L |
a. Autoclave a glass flask containing 1 L of triple-distilled water and allow it to cool down at room temperature.
b. Add the following salts to the flask: NaCl, KCl, Na2HPO4, and KH2PO4.
c. Dissolve the salts using a magnetic stirrer.
d. Calibrate the pH meter and adjust the solution to pH 7.4 by slowly adding 1 M NaOH or 1 M HCl, as needed.
e. Remove the stir bar, filter the solution through a 0.22 μm membrane under sterile conditions, and store at 4 °C until use.
Note: Alternatively, a commercial PBS solution may be used.
4. 0.04% Trypsin-EDTA
| Reagent | Final concentration | Quantity |
|---|---|---|
| Trypsin | 0.04% (w/v) | 390 mg |
| EDTA | 0.037% (w/v) | 370 mg |
| NaCl | — | 85 mg |
| PBS 1× | — | To 1 L |
a. Start with 1 L of PBS 1×.
b. Dissolve 390 mg of trypsin and 85 mg of NaCl in 10 mL of PBS 1×.
c. Add 370 mg of EDTA to the remaining PBS 1× and mix until dissolved.
d. Combine with the trypsin–NaCl solution and stir until fully mixed.
e. Filter the solution through a 0.22 μm membrane under sterile conditions.
f. Aliquot and label the solution properly before storing at -20 °C until use.
Note: This trypsin-EDTA solution is used for cell detachment. The prepared solution should be sterilized by filtration (0.22 μm) and stored at -20 °C until use.
Equipment
1. Centrifuge (PowerSpinTM, model: C856)
2. Micropipettes (Axygen, AP-10, AP-100, and AP-1000): 0.5–10 μL single-channel pipettor (Axygen® Axypet®, catalog number: AP-10), 10–100 μL single-channel pipettor (Axygen® Axypet®, catalog number: AP-100), and 100–1,000 μL single-channel pipettor (Axygen® Axypet®, catalog number: AP-1000)
3. pH meter (Apera, model: PH700)
4. Orbital shaker (Benchmark, model: BT302)
5. Digital stirring hot plate (Thermo Scientific, model: SP131015Q)
6. Inverted microscope (Carl Zeiss, model: 37081)
7. Laminar flow cabinet (Thermo Fisher Scientific, model: 1340)
8. Incubator for cell culture (Thermo Fisher Scientific, model: 3422)
9. Neubauer chamber (Mariendfeld, catalog number: 0610010)
10. Microwave oven (standard laboratory or domestic units, 600–100 W) for agarose melting
11. Vacuum filtration system (Nalgene, catalog number: 300-4050)
Software and datasets
1. ImageJ (https://imagej.net/ij/download.html)
2. GraphPad Prism 9.1.1 (https://www.graphpad.com/features)
Procedure
Before beginning cell culture work, establish a sterile environment by thoroughly wiping the biosafety cabinet interior (work surface and walls) and all necessary materials with 70% ethanol and then decontaminating the cabinet with UV light for 15 min. Allow the surface to air-dry completely and perform all subsequent steps under strict aseptic conditions within the prepared workspace.
A. Cost-effective non-adherent plate preparation
1. Maintain the sterile 1.5% (w/v) agarose solution in a water bath set to 100 °C on a stirring hot plate.
2. Use a 96-well cell culture plate with a flat bottom to prepare a non-adherent plate.
3. Using sterile technique, transfer 1 mL of the 1.5% molten agarose solution (see Recipes) into a 1.5 mL microcentrifuge tube.
4. Dispense 60 μL of the agarose solution into each well of the plate from the stock tube (Figures 1 and 2).
Note: A multichannel pipette is not recommended, as standard plastic reservoirs are incompatible with the required elevated temperature.
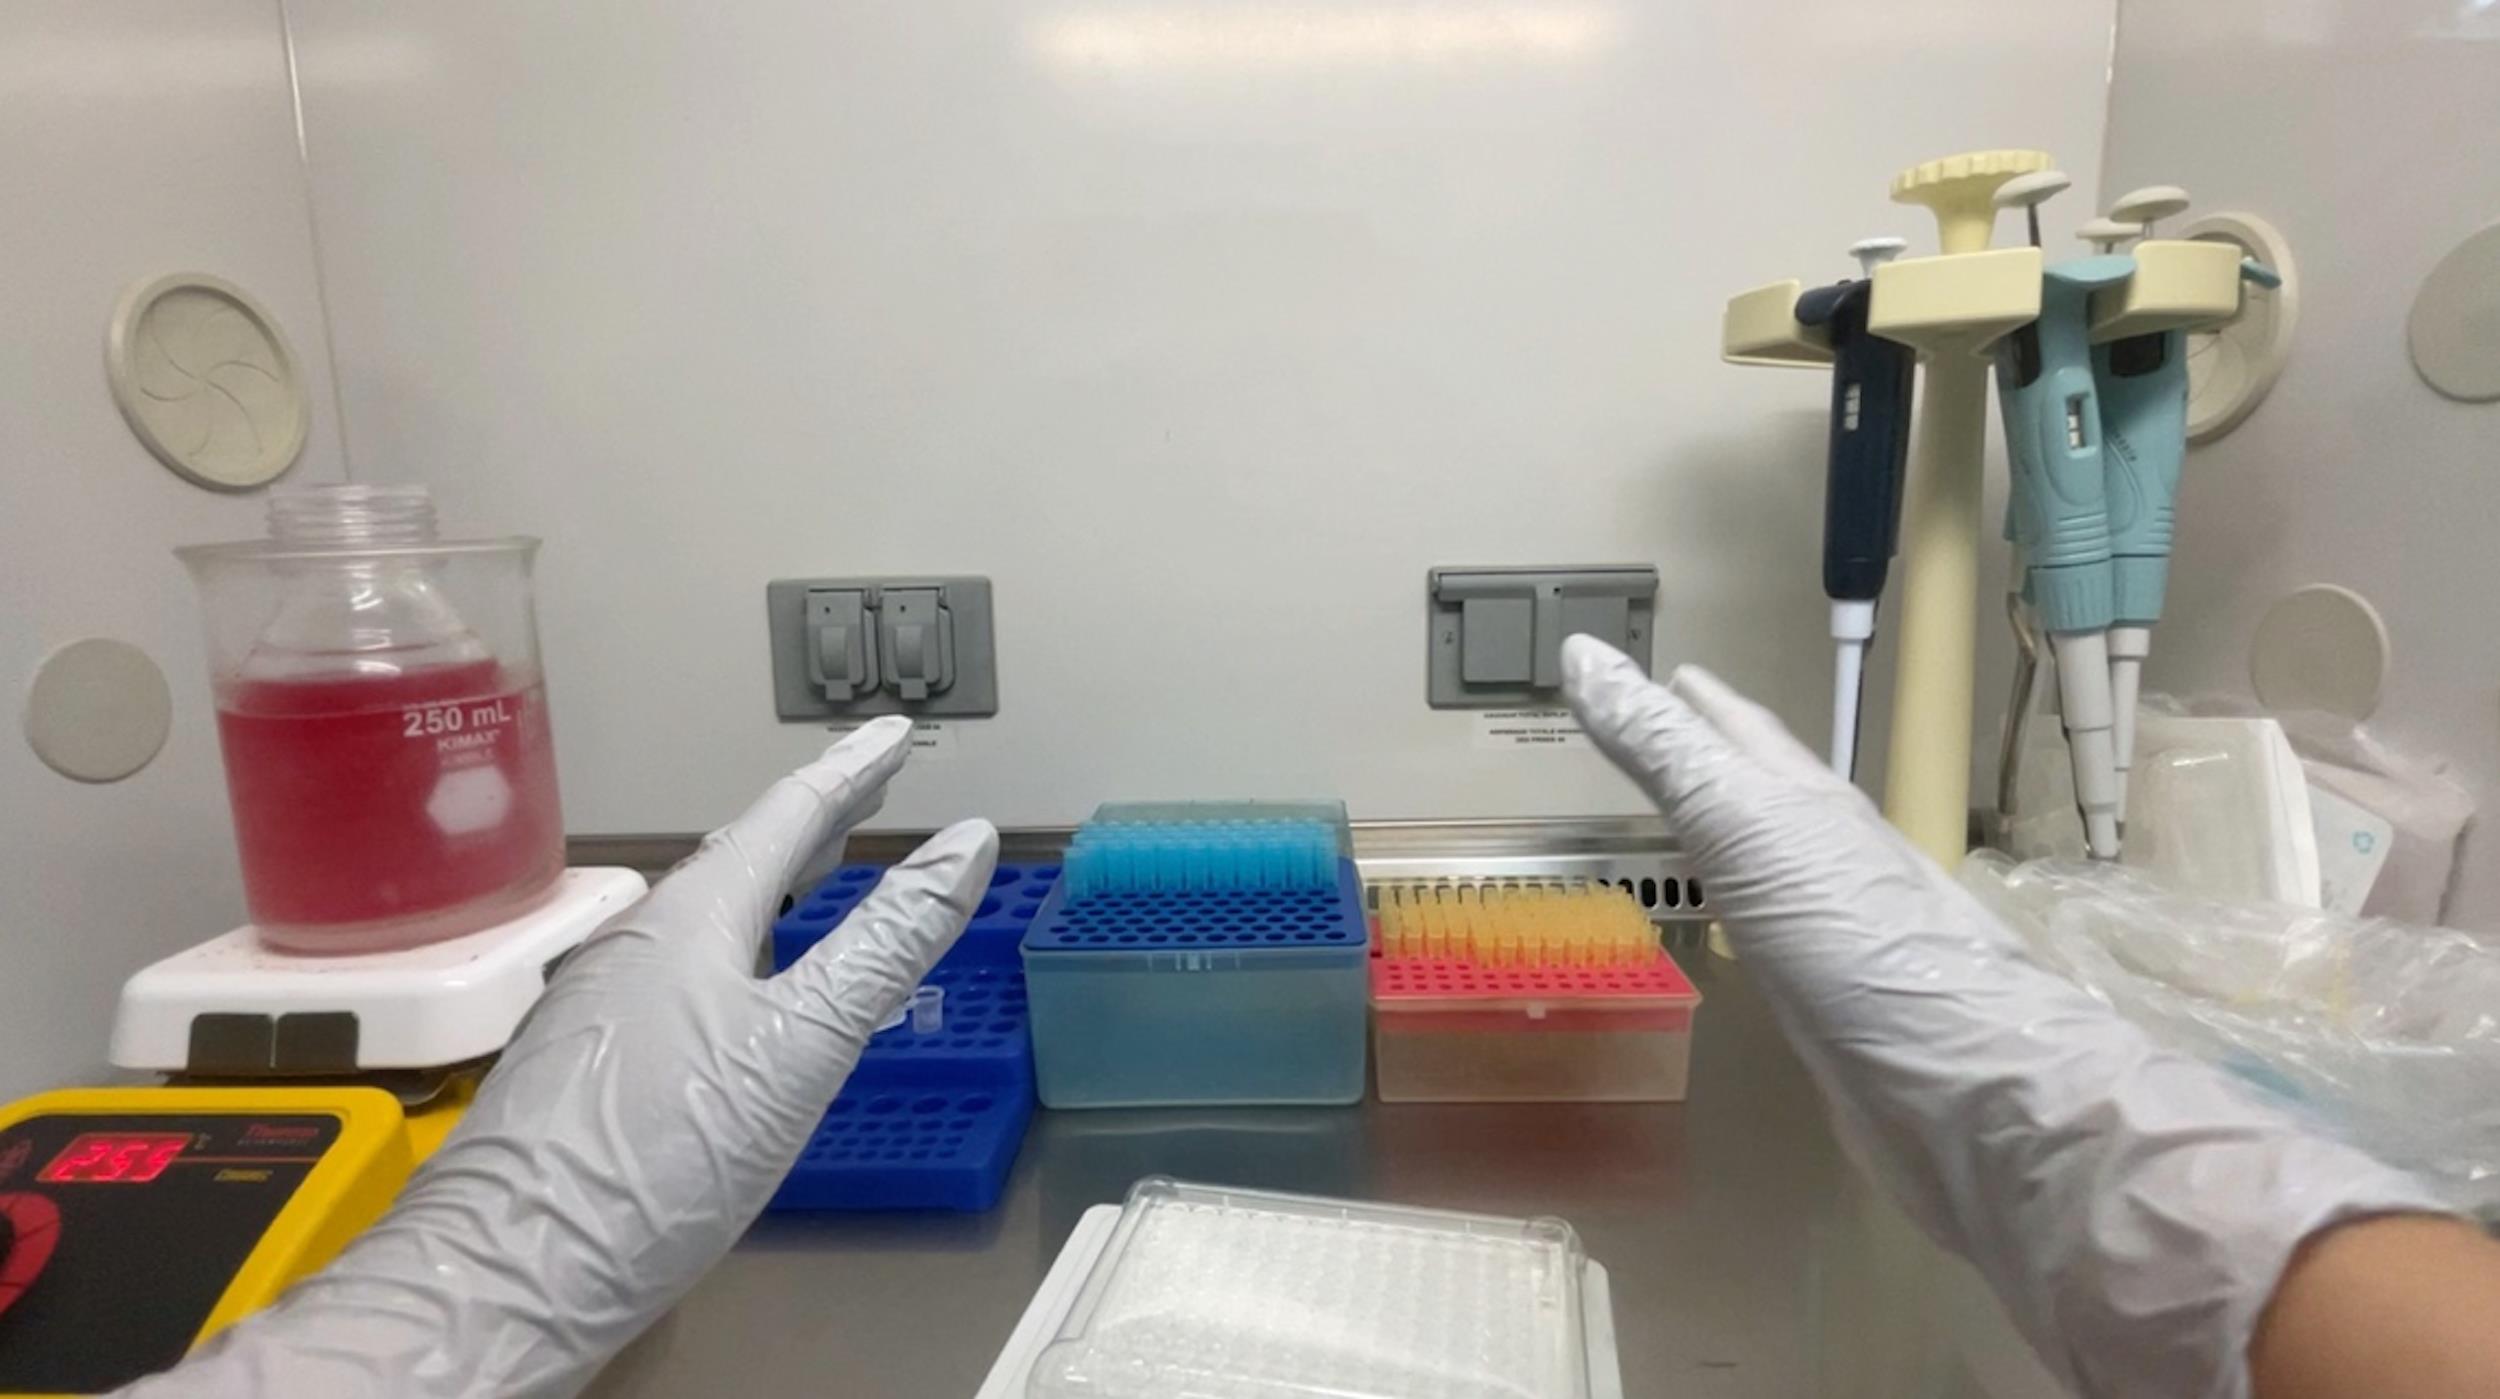
Figure 1. Cost-effective non-adherent plate production
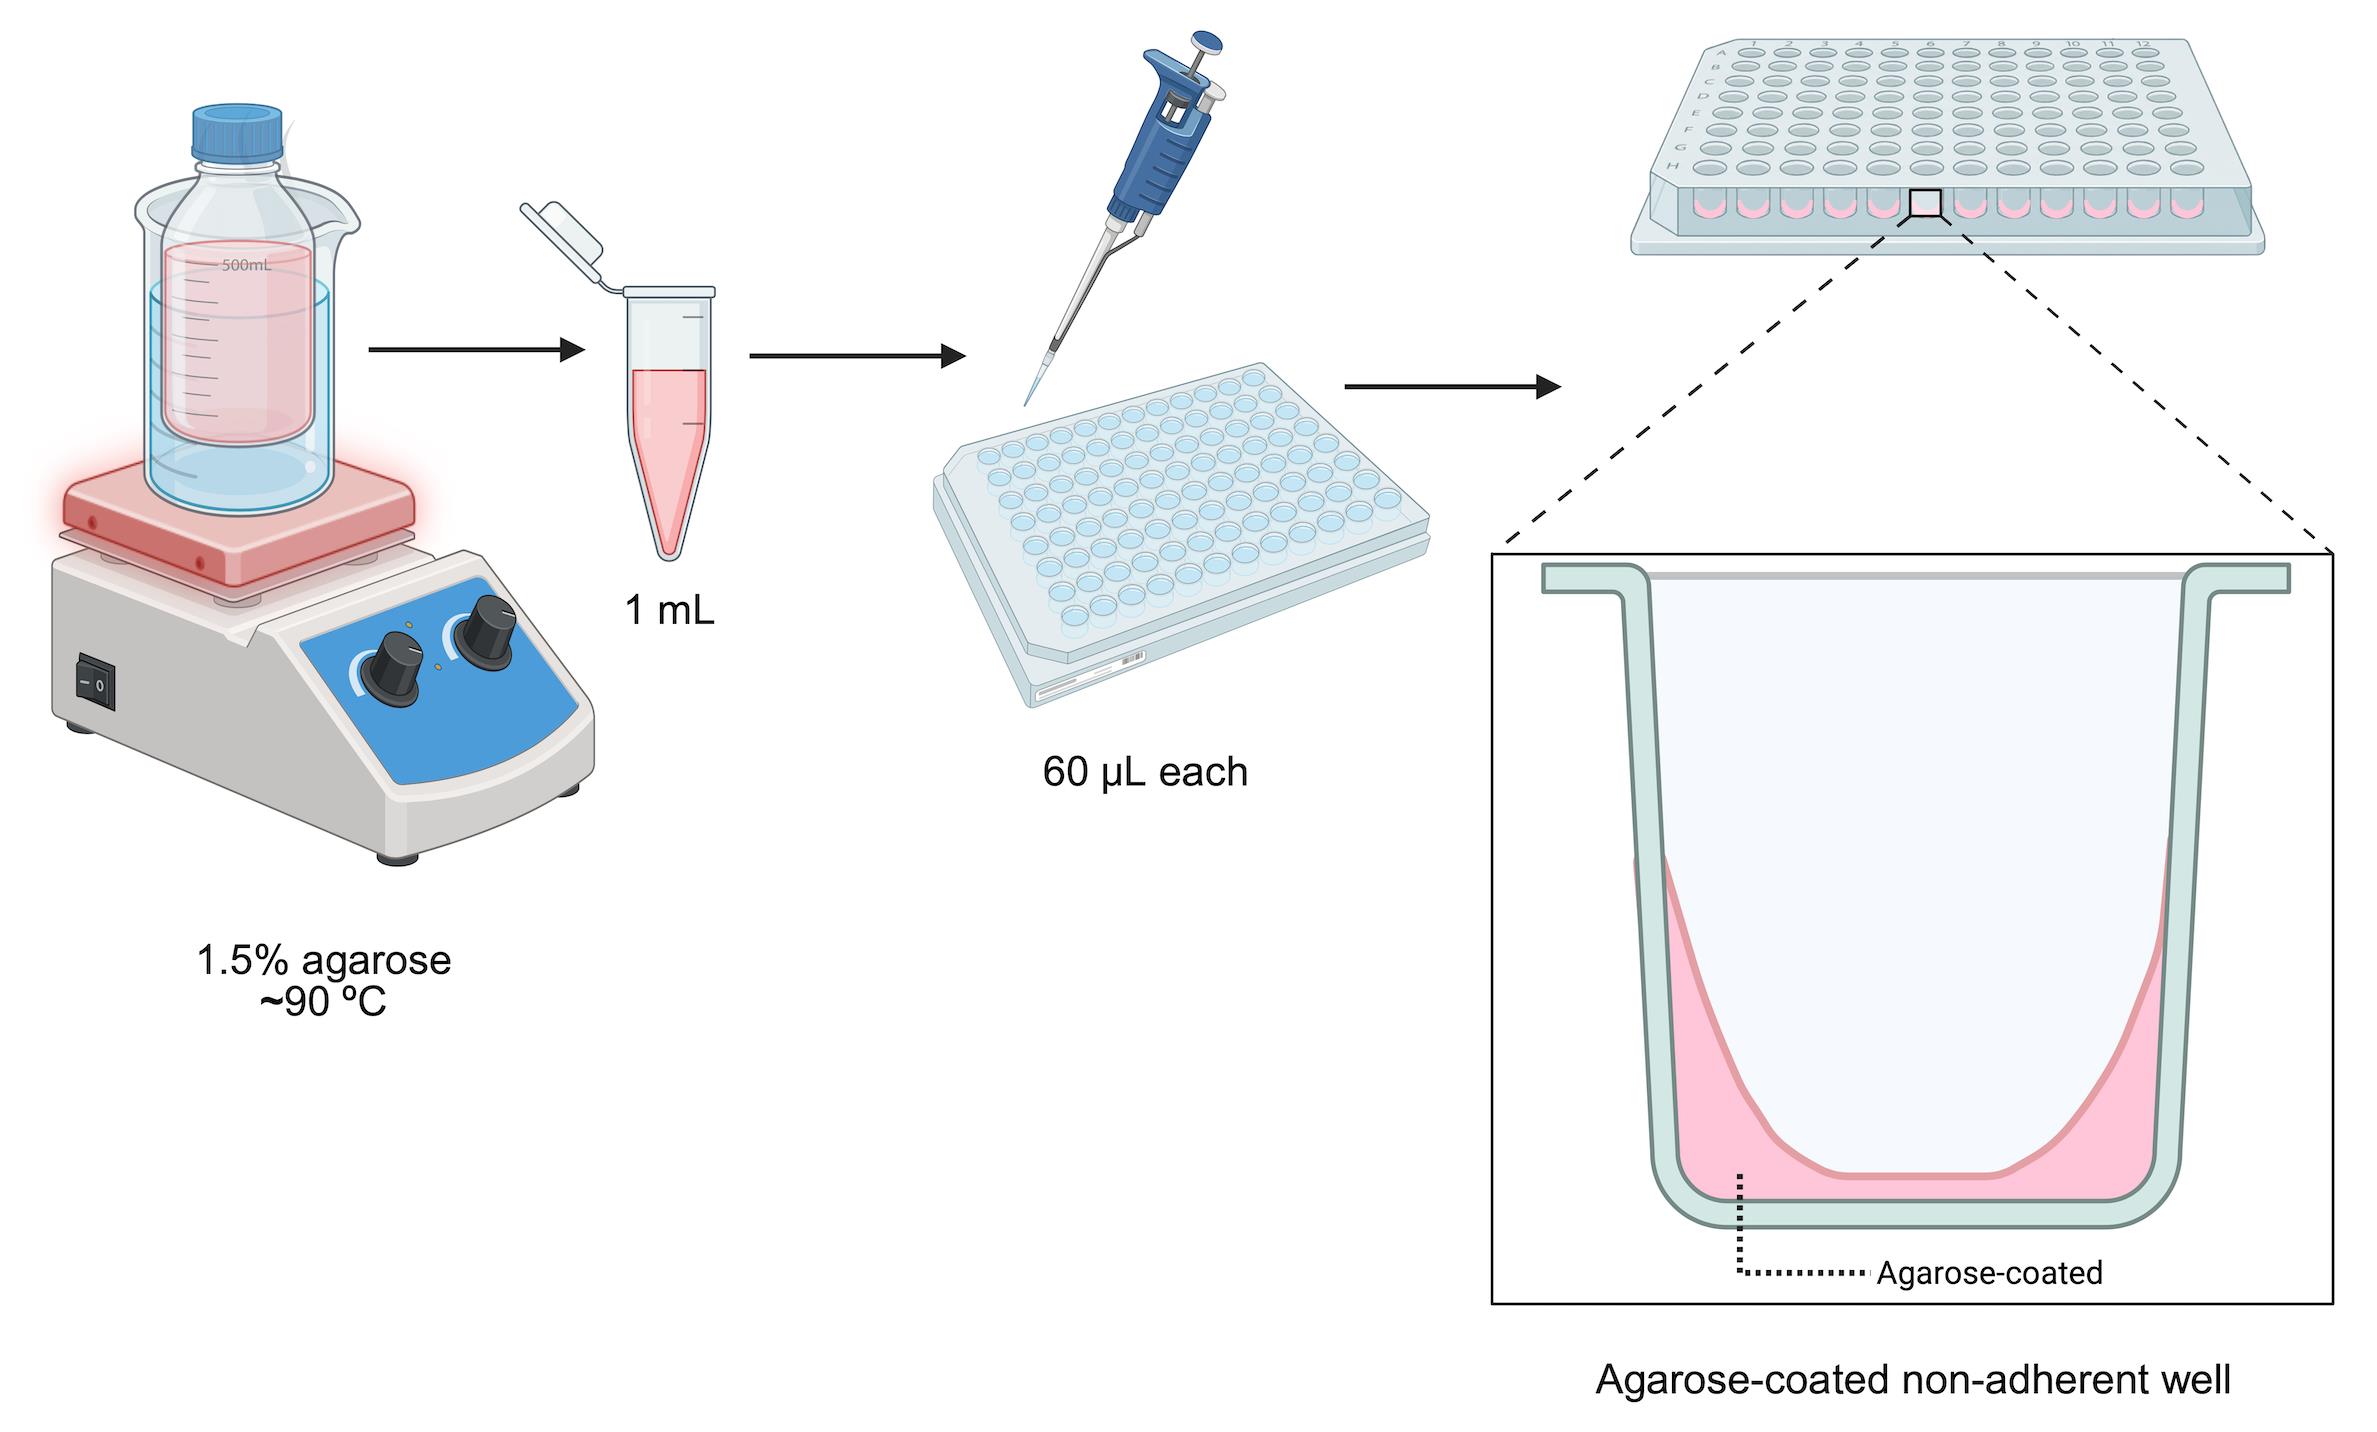
Figure 2. Schematic representation of non-adherent plate production
5. Repeat the previous step until all wells are filled (Figure 2).
6. Allow the agarose to solidify, then uncover it at room temperature under a cell culture hood for 15 min.
7. Wrap the plate in clean packaging film or Parafilm and then place it in a plastic bag until use. The prepared agarose non-adherent plate can be stored for 2–3 weeks at 4 °C.
B. Thaw MDA-MB-231 cells
1. Remove the vial containing the cells from the liquid nitrogen tank.
2. Place it in a water bath at 37 °C until the cells are completely thawed.
3. Transfer the thawed cells using a sterile 2 mL serological pipette into a 1.5 mL culture tube.
4. Centrifuge the 1.5 mL tube containing cells at 257× g for 5 min at room temperature.
5. Remove the supernatant with a sterile serological 2 mL pipette.
6. Resuspend cells in 1 mL of DMEM complete media.
7. Place them in a 60 mm × 15 mm cell culture dish and add 5 mL of DMEM complete media.
Note: RMPI medium can be used instead of DMEM.
C. Preparation of MDA-MB-231 cells
1. Grow MDA-MB-231 cells in a cell culture dish (60 mm × 15 mm) with complete medium (DMEM) at 37 °C with 5% CO2 until ~80% confluency.
2. Aspirate the medium and wash with 5 mL of 1× PBS.
3. Add 3 mL of trypsin-EDTA 0.25% and incubate at 37 °C for 3–5 min.
4. Neutralize trypsin with 6 mL of DMEM complete medium.
5. Transfer into a 15 mL conical tube and centrifuge at 257× g for 5 min at room temperature. Discard the supernatant and resuspend the pellet in 1 mL of fresh DMEM complete medium.
Notes:
1. RMPI medium could be used instead of DMEM.
2. Split the cells at least up to passage 3 before using them in experiments.
D. Count cells in the Neubauer chamber
1. Prepare a 1:10 dilution of cells treated with trypsin.
2. To prepare dilution 1:10, add 90 μL of DMEM complete medium in a microtube (1.5 mL) and 10 μL of cells previously resuspended in DMEM complete medium.
3. Take 10 μL of the diluted cells and place them in the Neubauer chamber. Count the cells and calculate the total number of cells (Figure 3).
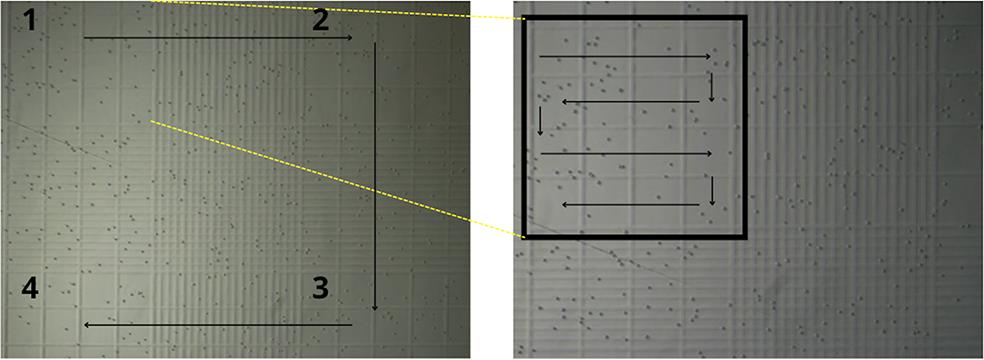
Figure 3. Representation of cell counting on a Neubauer chamber. (Left) The four corner quadrants of the central counting grid. Each 1 mm2 square is subdivided into 16 smaller squares and has a depth of 0.1 mm. (Right) Detailed counting methodology within a single quadrant.
4. Cell counting formula:
Note: Standard cell counting practice recommends the use of a viability dye (e.g., Trypan blue). In this specific protocol, the dye was omitted because the cell line used routinely exhibited >95% viability. If omitting viability staining, researchers must first validate that their cell line consistently maintains >95% viability in a pre-culture count with a viability dye. Furthermore, spheroid quality should be monitored daily; cultures showing significant cell death or morphological deterioration should not be used for downstream experiments.
E. Prepare dilutions with different concentrations of cells
Note: To determine the optimal cell number for spheroid formation, it is essential to prepare different cell dilutions and place them in a non-adherent plate.
1. Prepare dilutions of 3 × 10³ (30,000 cell/mL), 5 × 10³ (50,000 cell/mL), 8 × 10³ (80,000 cell/mL), 10 × 103 (100,000 cell/mL), 15 × 103 (150,000 cell/mL), 20 × 103 (200,000 cell/mL), 25 × 103 (250,000 cell/mL), and 30 × 103 (300,000 cell/mL) (Figure 4).
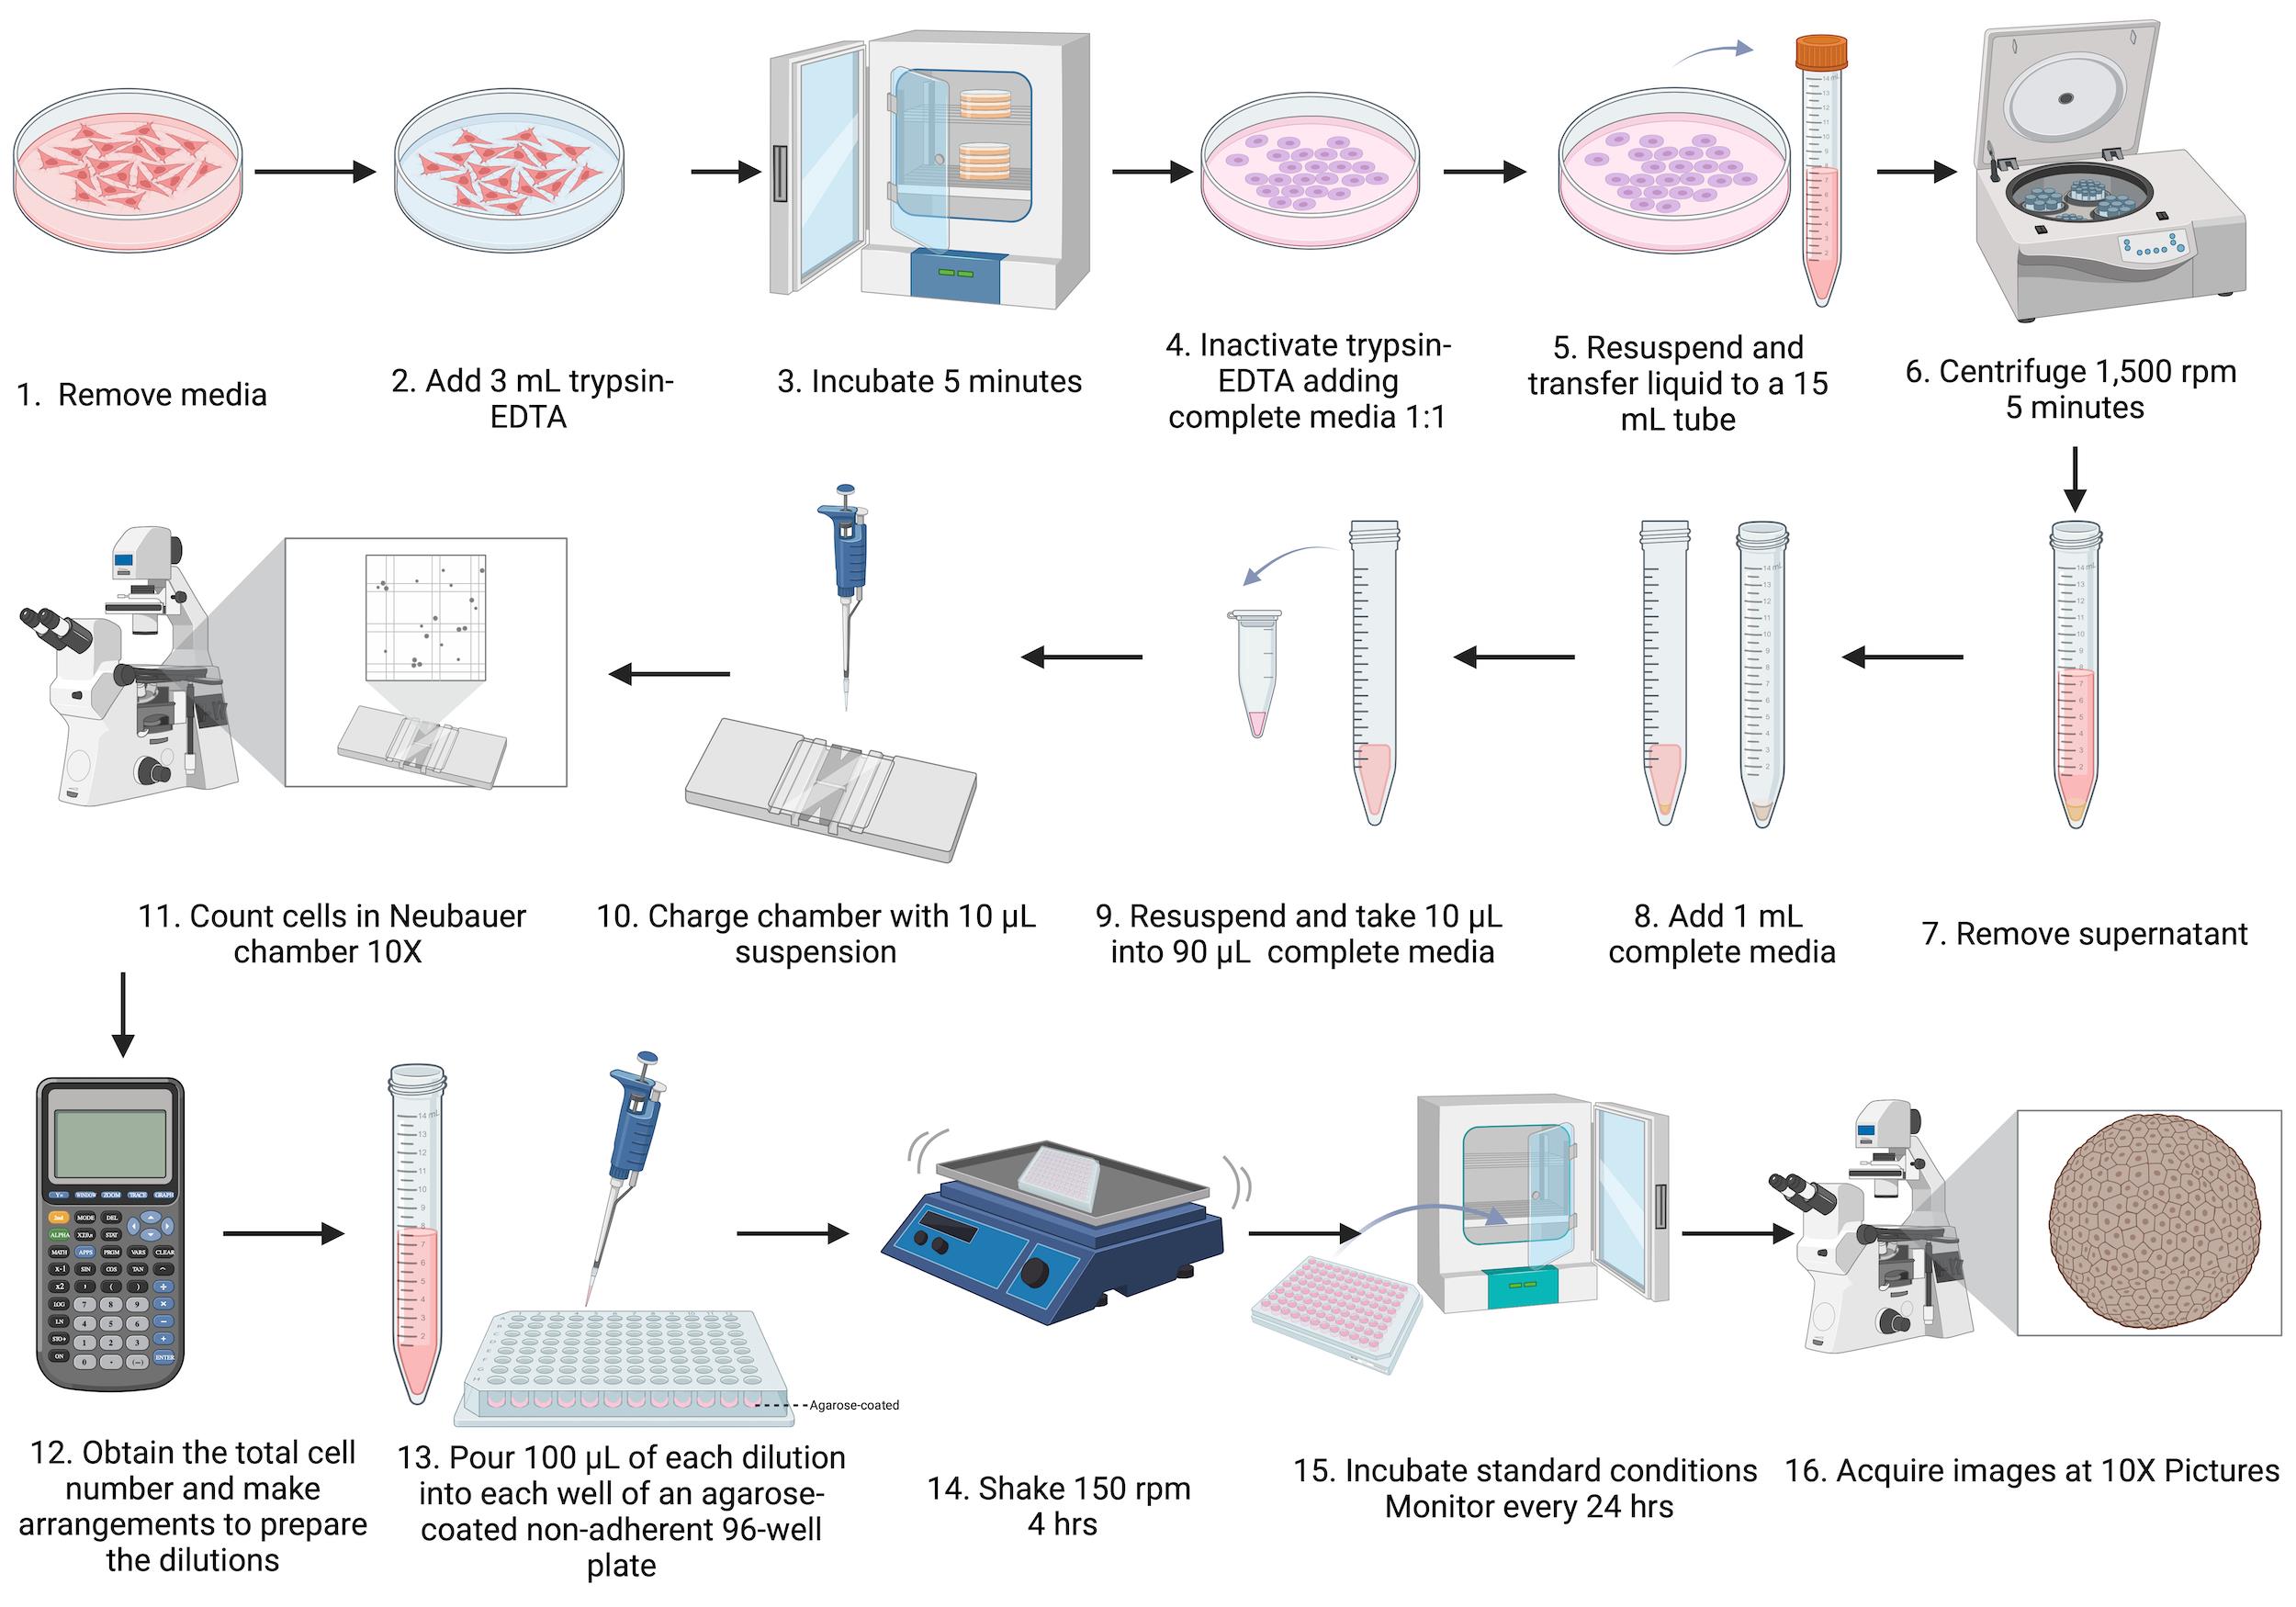
Figure 4. Schematic workflow of spheroid formation using agarose-coated non-adherent 96-well plates
2. Using a non-adherent 96-well plate, dispense 100 μL of each dilution.
3. Shake the plate in an orbital shaker at 150 rpm for 3 h at room temperature.
4. After the shaking period, put the plate in the incubator at 37 °C with 5% CO2 and 95% humidity.
5. Monitor the spheroid formation daily for 96 h (4 days).
6. Take a picture every 24 h using an inverted microscope with a 10× objective (Figure 5).
Note: Researchers applying this protocol to other cell lines should first validate that their cells can tolerate these conditions. We recommend either (1) confirming post-shaking viability and morphology or (2) performing the shaking step inside a standard 37 °C, 5% CO2 incubator, if equipment permits.
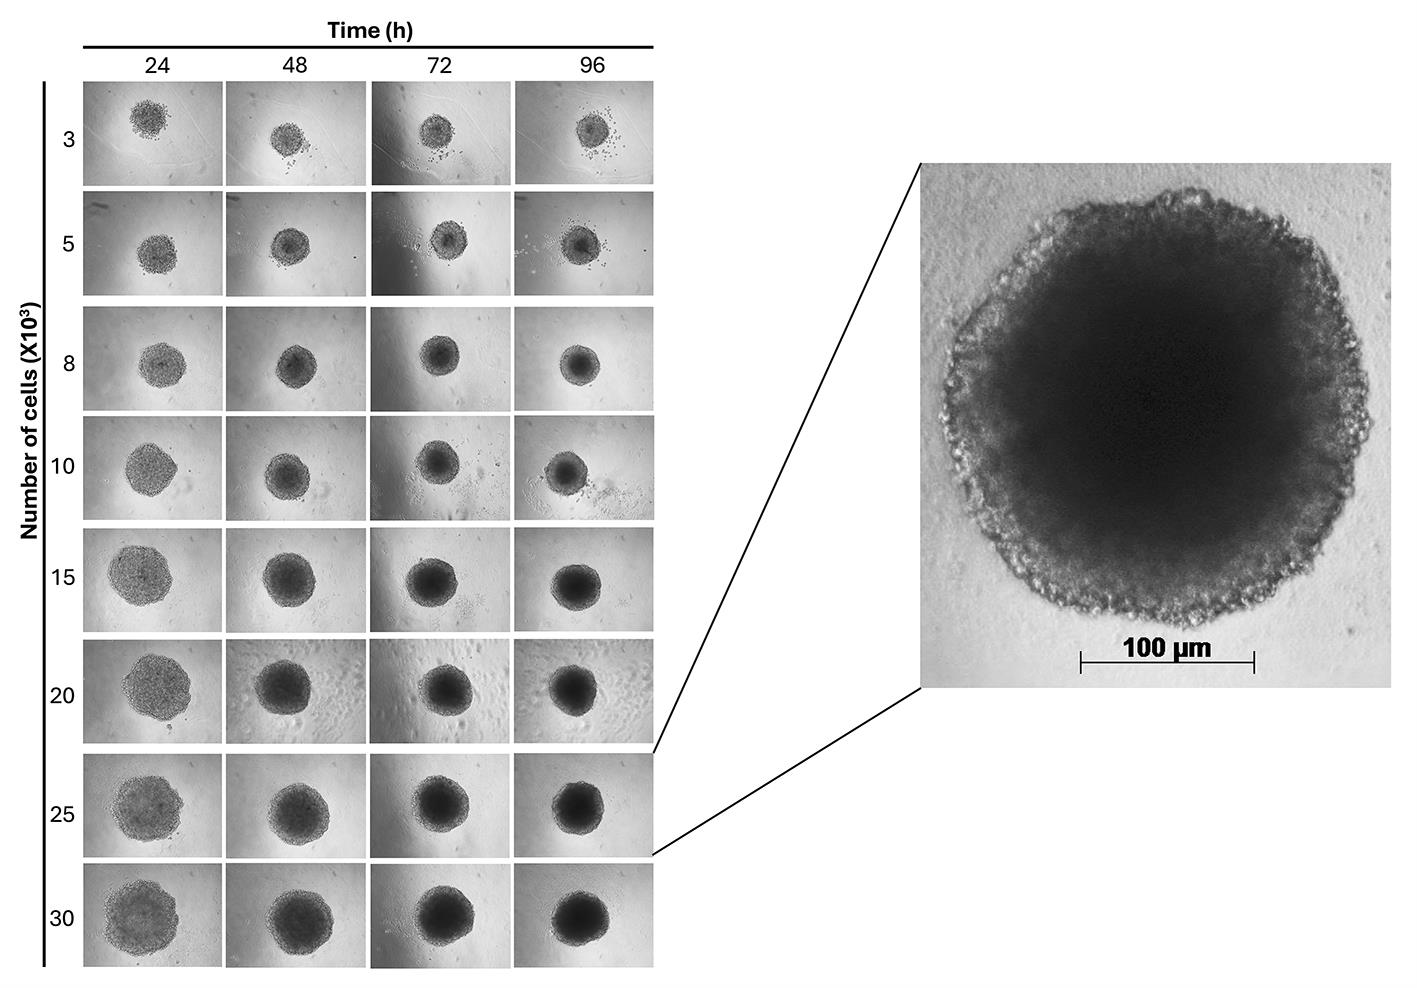
Figure 5. Representative images of spheroids up to 96 h (10× magnification)
F. Monitoring and analysis of spheroids
1. Acquire images of all spheroids every 24 h using the inverted microscope (Carl Zeiss, 10× magnification).
2. Record a scale reference (micrometer or scale bar) on the microscope during image acquisition.
3. Following capture at the 96-h endpoint, transfer image files via USB drive to a separate workstation and analyze using ImageJ software.
4. Set the global scale in ImageJ using the reference obtained from the microscope. Using the straight-line selection tool, draw a line over the scale reference visible in the image (e.g., 100 μm scale bar).
5. Go to Analyze → Set Scale. Enter the known distance corresponding to the scale reference (e.g., 100 μm), select “micrometers” as the unit of length, and check the “Global” option to apply the scale to all images.
6. Select the straight-line tool, then draw a line across the spheroid’s widest diameter.
7. Go to Analyze → Measure to record the spheroid diameter (or circumference, if selected in the measurement settings).
8. Repeat the measurement for each spheroid at all time points.
9. Export the measurement results from ImageJ and compile the data for quantitative analysis (Figure 6).
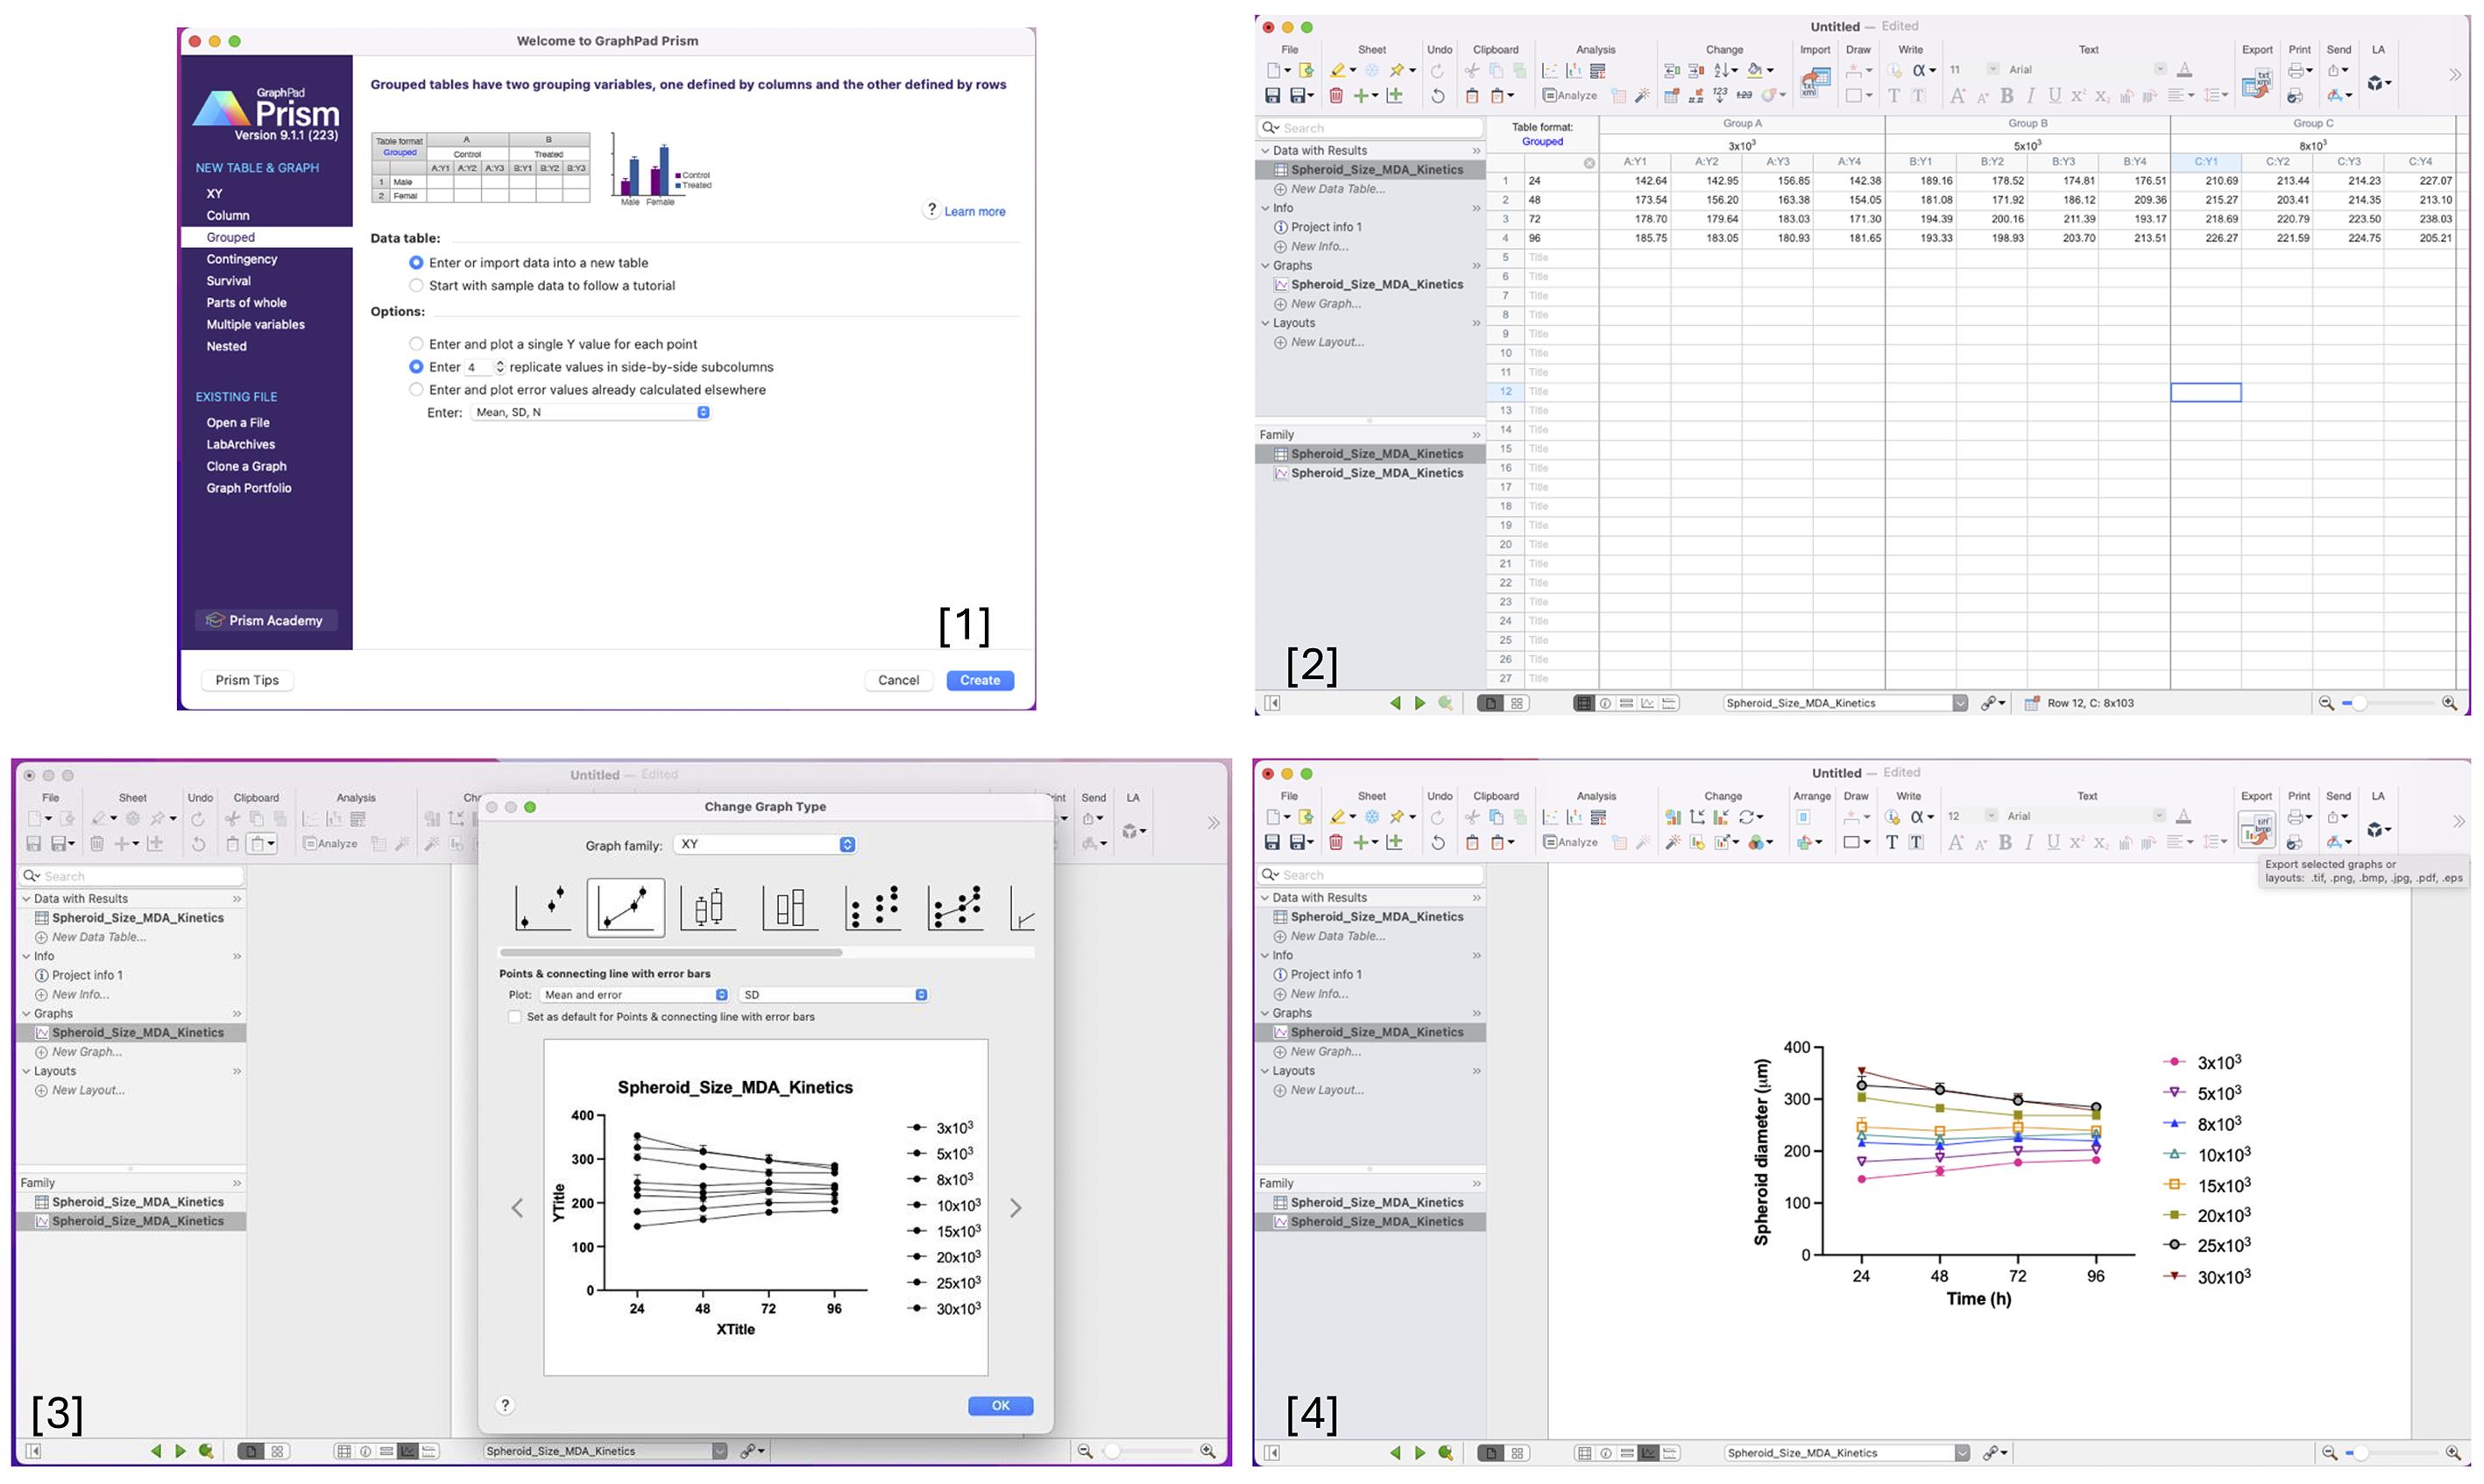
Figure 6. Step-by-step workflow for data processing and plot generation in GraphPad Prism. [1] Create a project in GraphPad Prism, specifying the required number of replicates for the experimental design. [2] Enter the experimental data into rows, organizing variables systematically for analysis. [3] Generate the plot by selecting the appropriate graph family (e.g., XY analysis) to visualize the data. [4] Customize the appearance of the graph by adjusting colors and symbol shapes to distinguish experimental groups clearly.
G. Data analysis
1. Export the measurement data (Figure 7) and use them for analysis in GraphPad Prism 9.1.1. (Figure 6).
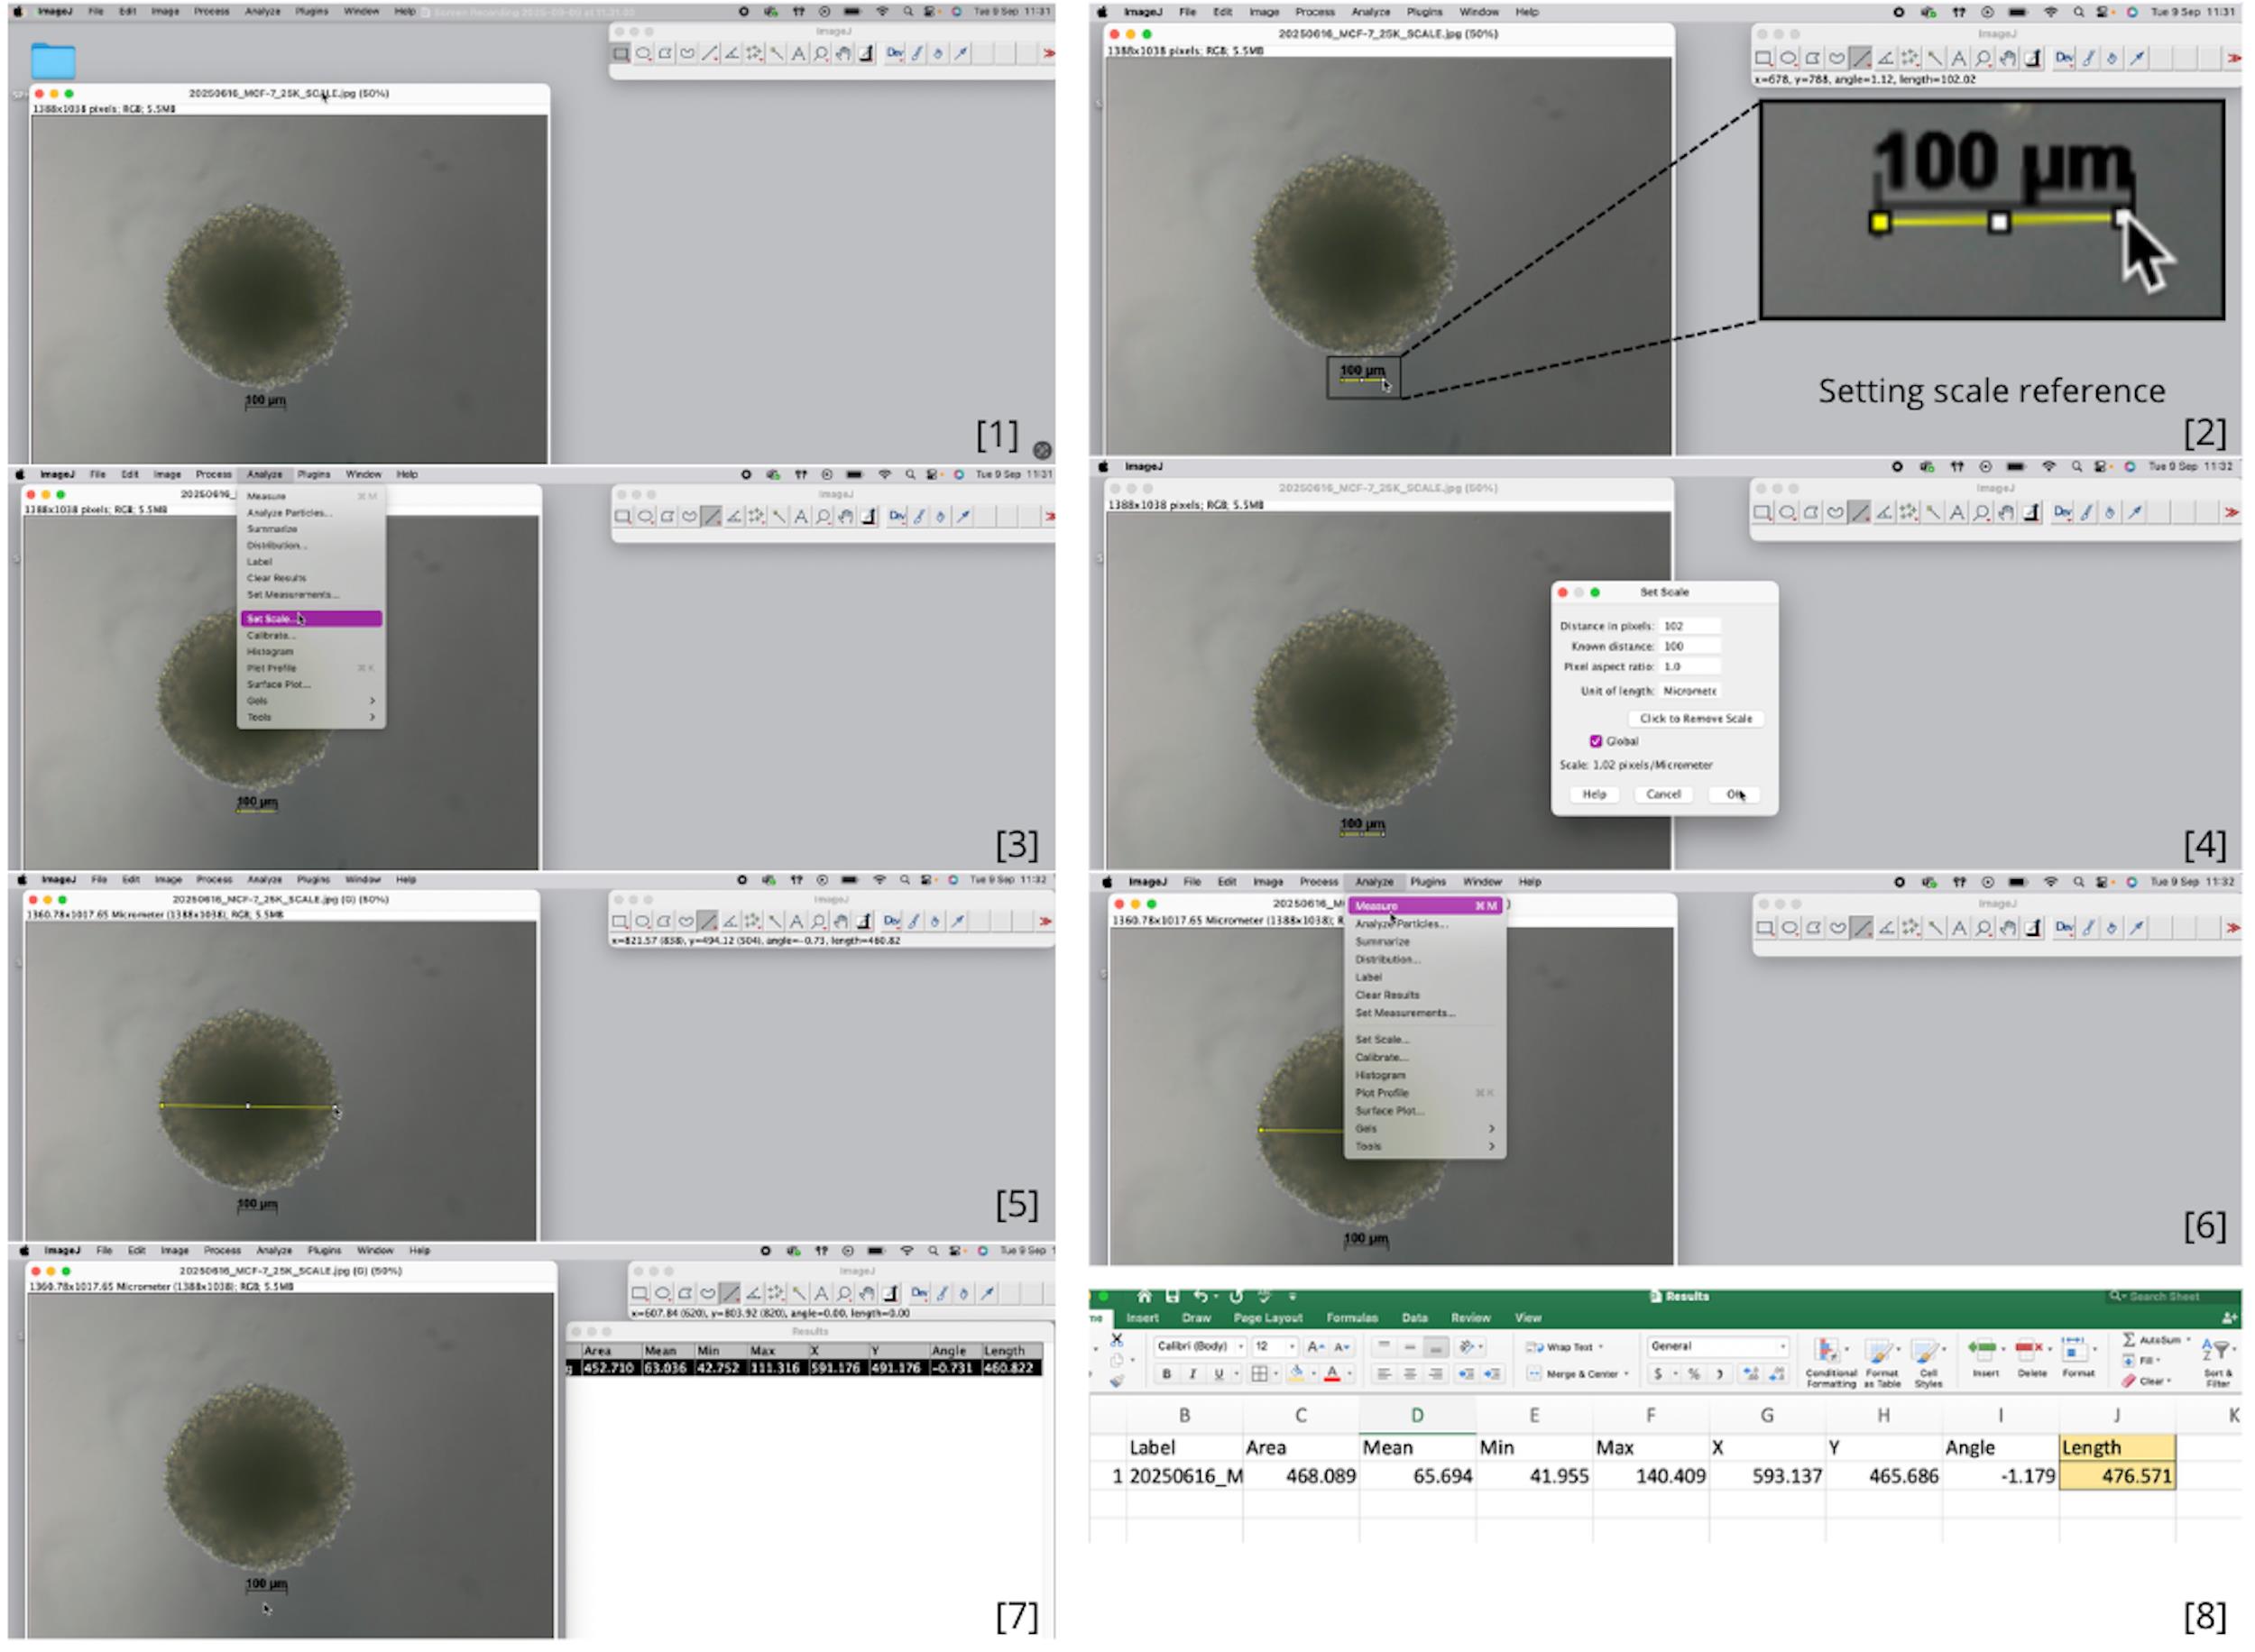
Figure 7. Step-by-step process for setting the scale and measuring spheroid circumference using ImageJ. [1] Open the image file containing a spheroid with a reference scale bar. [2] Using the straight-line tool, draw a line over the microscope's reference scale bar (e.g., 100 μm). [3] Access the Set Scale menu and enter the known distance (e.g., 100 μm). [4] Select "micrometers" as the unit of length and apply the scale globally to all images. [5] Measure spheroids by drawing a line across the widest cross-section. [6] Record the diameter (or circumference) using the Measure function. [7] Repeat measurements for all spheroids at each time point. [8] Compile and export data for quantitative analysis.
2. Select “Grouped” as the data table type.
3. Define the X values as the culture time points: 24, 48, 72, and 96 h.
4. Create one data set (Y column) for each seeding density (e.g., 3 × 10³, 5 × 10³, 8 × 10³, 10 × 103, 15 × 103, 20 × 103, 25 × 103, and 30 × 103 cells/well) with the number of replicates that you wish.
5. For each density, enter the replicate diameter values obtained from ImageJ 1.1k at each time point.
6. In GraphPad Prism 9.1.1., calculate the mean for each time point and condition (Prism will compute this automatically when replicates are entered in subcolumns).
7. Then, plot by selecting Graph → Graph family → XY → Points & connecting line with error bar → mean and error → SD Line graph and plot mean spheroid diameter (μm) versus time (h).
8. Format the legend to display the corresponding seeding densities.
9. Export the final graph in the desired format (e.g., .tiff or .png).
Validation of protocol
To ensure reproducibility, we provide the following validation data from our internal experiments using the MDA-MB-231 cell line:
1. Spheroid formation and consistency: Using the agarose-coated plates described, we consistently formed compact, spherical aggregates within 24 h. The spheroids remained stable and did not increase in size over the 96-h culture period (Figures 5 and 8). This stability makes the model optimal for drug testing, where changes in spheroid size can be used as a reliable readout.
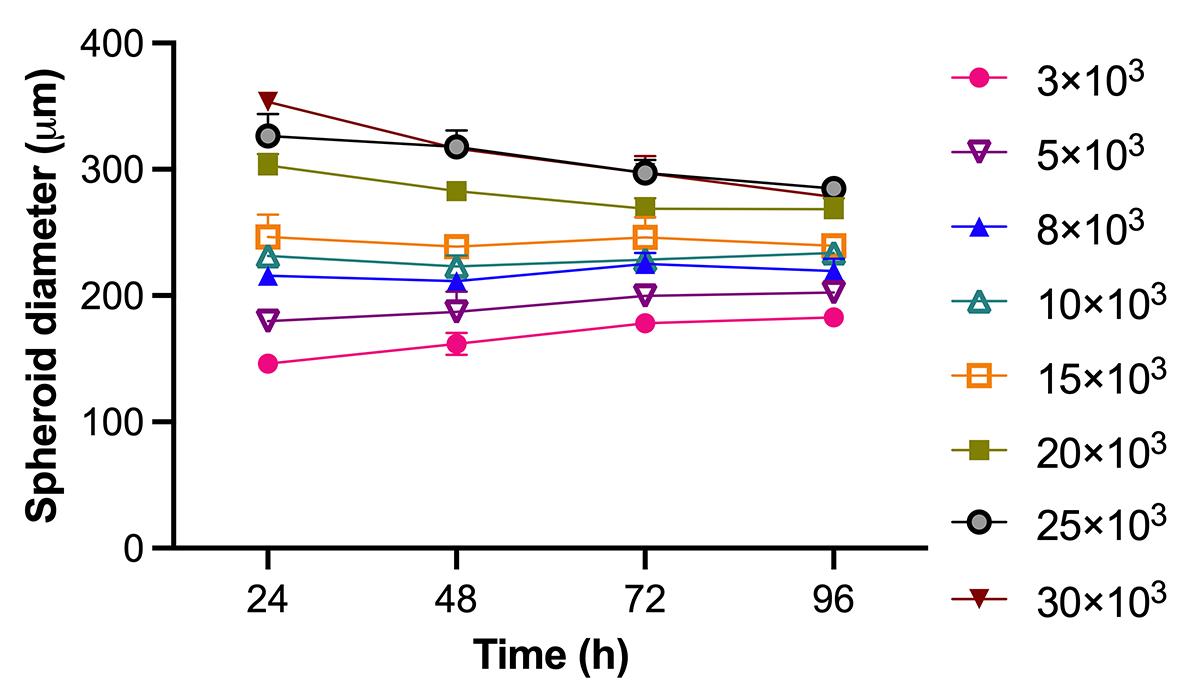
Figure 8. Evolution of spheroid size during the 96-h culture period. Each point represents the mean of 3 replicates.
2. Quantitative analysis: Spheroid size (circumference) was measured daily (n = 12 spheroids per seeding density) using ImageJ software. Data are presented as mean ± standard deviation (SD) of 4 biological replicates. Statistical analysis was performed using GraphPad Prism 9.1.1.
3. Optimal seeding density: A seeding density of 1.0 × 10⁴ cells/well was identified as optimal, reliably producing a single, central spheroid per well with a uniform spherical morphology suitable for subsequent drug treatment assays (Figure 9).
4. Controls: Control wells containing culture medium only were included in every plate to confirm the absence of contamination.
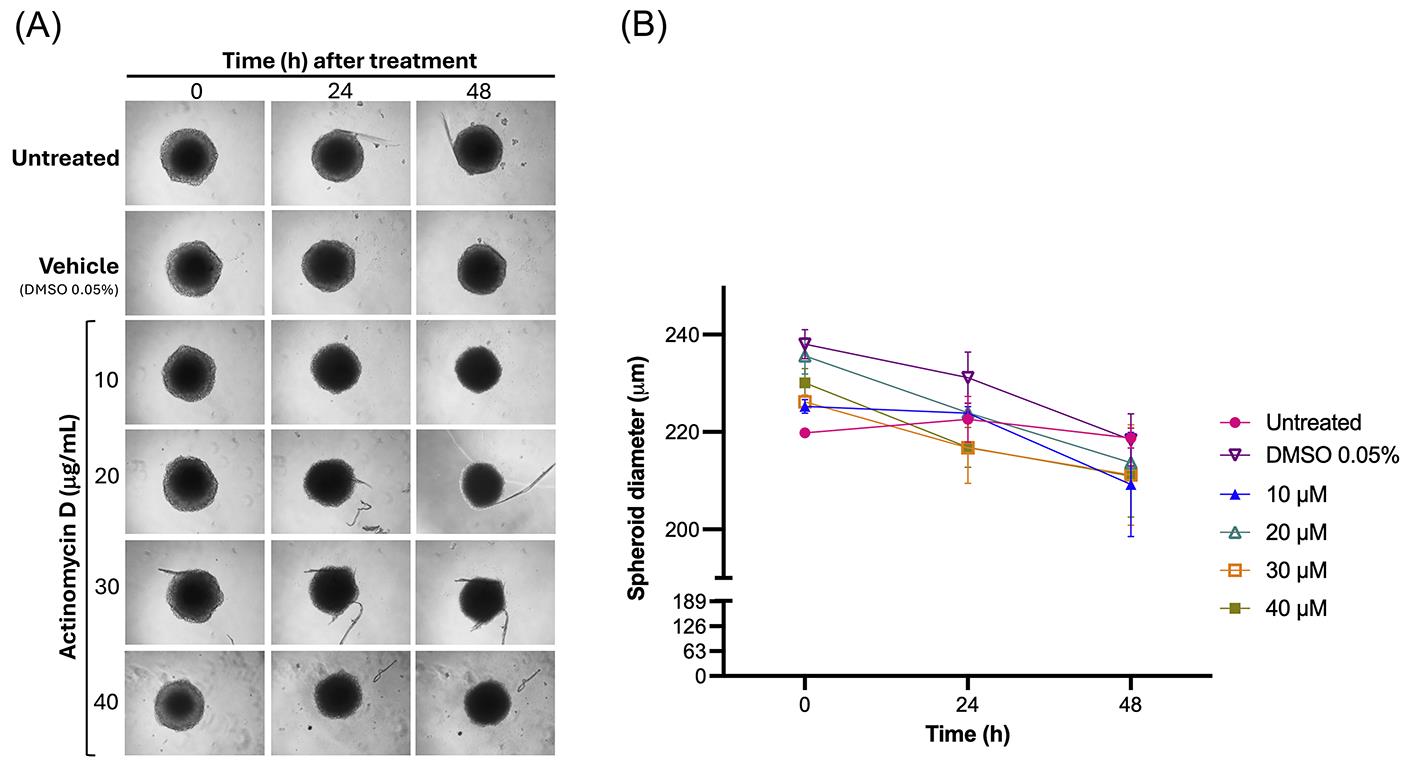
Figure 9. Validation of MDA-MB-231 spheroids as a drug screening model. (A) Representative brightfield images of spheroids treated for 48 h with increasing concentrations (10, 20, 30, and 40 μM) of the chemotherapeutic agent actinomycin D. (B) Quantification of spheroid size (diameter) following treatment. Data are presented as mean ± standard deviation (SD); n = 4 biological replicates.
This protocol has been used and validated in the following research article(s):
Cervantes-Rivera, R. et al. (2026) (Manuscript in preparation). Antitumor effects of avocado (Persea americana var. drymifolia) seed lipid extract on MDA-MB-231 cells in 2D and 3D models.
General notes and troubleshooting
General notes
1. All cell culture procedures should be performed under sterile conditions using a biosafety cabinet to avoid contamination.
2. Cells should be maintained in good health and used at low passage numbers to ensure reproducible spheroid formation.
3. The agarose coating is a critical step for generating non-adherent conditions. Ensure that the agarose fully covers the bottom of each well and solidifies evenly before cell seeding.
4. Cell seeding density strongly influences spheroid morphology. For MDA-MB-231 cells, a density of 1 × 10⁴ cells per well reliably produced a single, compact spheroid.
5. Gentle orbital shaking is required during the initial aggregation phase to promote homogeneous cell–cell interactions and avoid off-center or multiple aggregates.
6. Spheroid morphology should be monitored daily. Compact, round spheroids with smooth edges indicate successful aggregation.
Troubleshooting
| Problem | Possible cause | Solution |
|---|---|---|
| Formation of multiple aggregates within a single well | Uneven cell distribution during seeding or insufficient orbital shaking during the initial aggregation phase | Ensure accurate cell counting and homogeneous resuspension of the cell suspension immediately before dispensing into the plate. Apply gentle orbital shaking during the pre-aggregation phase to promote uniform cell–cell interactions and central aggregation. Increase shaking time to 1 h. |
| Loose or irregular spheroid morphology | Low cell viability, excessive exposure to trypsin-EDTA, or suboptimal seeding density | Harvest cells during the exponential growth phase and avoid over-trypsinization. Optimize seeding density; for MDA-MB-231 cells, a density of 10 × 103 cells per well is recommended to obtain compact spheroids. |
| Cell attachment to the bottom of the well | Incomplete agarose coating | Verify that the agarose solution uniformly covers the bottom of each well. Allow the agarose coating to fully solidify before cell seeding to ensure non-adherent conditions. |
| High variability in spheroid size across wells | Inconsistent pipetting | Use calibrated pipettes and maintain consistent handling across all wells. Gently resuspend the cell suspension before dispensing to minimize well-to-well variability. |
Acknowledgment
We gratefully acknowledge funding from Coordinación de la Investigación Científica de la UMSNH (Proyecto 17644). We are grateful for stipend support from Secretaría de Ciencia, Humanidades, Tecnología e Innovación (SECIHTI).
Authors’ contribution: Conceptualization: Ramón Cervantes-Rivera; Methodology: Ramón Cervantes-Rivera; Investigation: Ramón Cervantes-Rivera, Luisa Nirvana González-Fernández, Atalia Ziret Romero Rosas, Sandra Jetsamari Figueroa Ortíz; Formal analysis: Ramón Cervantes-Rivera, Atalia Ziret Romero Rosas, Sandra Jetsamari Figueroa Ortíz; Data curation: Ramón Cervantes-Rivera; Writing—Original draft: Ramón Cervantes-Rivera, Luisa Nirvana González-Fernández; Writing—Review & Editing: Ramón Cervantes-Rivera, Luisa Nirvana González-Fernández, Atalia Ziret Romero Rosas, Sandra Jetsamari Figueroa Ortíz, Alejandra Ochoa Zarzosa, Joel E. López-Meza; Visualization: Ramón Cervantes-Rivera, Luisa Nirvana González-Fernández, Atalia Ziret Romero Rosas, Sandra Jetsamari Figueroa Ortíz; Funding acquisition: Joel E. López-Meza, Alejandra Ochoa Zarzosa; Supervision: Ramón Cervantes-Rivera, Alejandra Ochoa Zarzosa, Joel E. López-Meza; Project administration: Ramón Cervantes-Rivera, Joel E. López-Meza.
Competing interests
The authors declare no conflict of interest.
References
- Sung, H., Ferlay, J., Siegel, R. L., Laversanne, M., Soerjomataram, I., Jemal, A. and Bray, F. (2021). Global Cancer Statistics 2020: GLOBOCAN Estimates of Incidence and Mortality Worldwide for 36 Cancers in 185 Countries. CA Cancer J Clin. 71(3): 209–249. https://doi.org/10.3322/caac.21660
- Goldhirsch, A., Winer, E., Coates, A., Gelber, R., Piccart-Gebhart, M., Thürlimann, B., Senn, H. J., Albain, K. S., André, F., Bergh, J., et al. (2013). Personalizing the treatment of women with early breast cancer: highlights of the St Gallen International Expert Consensus on the Primary Therapy of Early Breast Cancer 2013. Ann Oncol. 24(9): 2206–2223. https://doi.org/10.1093/annonc/mdt303
- Siegel, R. L., Miller, K. D., Wagle, N. S. and Jemal, A. (2023). Cancer statistics, 2023. CA Cancer J Clin. 73(1): 17–48. https://doi.org/10.3322/caac.21763
- Encarnação, J. C., Napolitano, V., Opassi, G., Danielson, U. H., Dubin, G., Popowicz, G. M., Munier‐Lehmann, H., Buijs, J., Andersson, K., Björkelund, H., et al. (2020). A real‐time cell‐binding assay reveals dynamic features of STxB–Gb3 cointernalization and STxB‐mediated cargo delivery into cancer cells. FEBS Lett. 594(15): 2406–2420. https://doi.org/10.1002/1873-3468.13847
- Hanahan, D. and Weinberg, R. A. (2011). Hallmarks of Cancer: The Next Generation. Cell. 144(5): 646–674. https://doi.org/10.1016/j.cell.2011.02.013
- Breslin, S. and O’Driscoll, L. (2013). Three-dimensional cell culture: the missing link in drug discovery. Drug Discov. 18: 240–249. https://doi.org/10.1016/j.drudis.2012.10.003
- Fennema, E., Rivron, N., Rouwkema, J., van Blitterswijk, C. and de Boer, J. (2013). Spheroid culture as a tool for creating 3D complex tissues. Trends Biotechnol. 31(2): 108–115. https://doi.org/10.1016/j.tibtech.2012.12.003
- Hirschhaeuser, F., Menne, H., Dittfeld, C., West, J., Mueller-Klieser, W. and Kunz-Schughart, L. A. (2010). Multicellular tumor spheroids: An underestimated tool is catching up again. J Biotechnol. 148(1): 3–15. https://doi.org/10.1016/j.jbiotec.2010.01.012
- Hoarau-Véchot, J., Rafii, A., Touboul, C. and Pasquier, J. (2018). Halfway between 2D and Animal Models: Are 3D Cultures the Ideal Tool to Study Cancer-Microenvironment Interactions? Int J Mol Sci. 19(1): 181. https://doi.org/10.3390/ijms19010181
- Duś-Szachniewicz, K., Gdesz-Birula, K. and Rymkiewicz, G. (2022). Development and Characterization of 3D Hybrid Spheroids for the Investigation of the Crosstalk Between B-Cell Non-Hodgkin Lymphomas and Mesenchymal Stromal Cells. OncoTargets Ther. 15: 683–697. https://doi.org/10.2147/ott.s363994
- Nayak, P., Bentivoglio, V., Varani, M. and Signore, A. (2023). Three-Dimensional In Vitro Tumor Spheroid Models for Evaluation of Anticancer Therapy: Recent Updates. Cancers (Basel). 15(19): 4846. https://doi.org/10.3390/cancers15194846
- Friedrich, J., Seidel, C., Ebner, R. and Kunz-Schughart, L. A. (2009). Spheroid-based drug screen: considerations and practical approach. Nat Protoc. 4(3): 309–324. https://doi.org/10.1038/nprot.2008.226
- Lin, R. and Chang, H. (2008). Recent advances in three‐dimensional multicellular spheroid culture for biomedical research. Biotechnol J. 3: 1172–1184. https://doi.org/10.1002/biot.200700228
- Lv, D., Hu, Z., Lu, L., Lu, H. and Xu, X. (2017). Three-dimensional cell culture: A powerful tool in tumor research and drug discovery (Review). Oncol Lett. 14(6): 6999–7010. https://doi.org/10.3892/ol.2017.7134
Article Information
Publication history
Received: Nov 27, 2025
Accepted: Feb 18, 2026
Available online: Mar 4, 2026
Published: Mar 20, 2026
Copyright
© 2026 The Author(s); This is an open access article under the CC BY-NC license (https://creativecommons.org/licenses/by-nc/4.0/).
How to cite
Cervantes-Rivera, R., González-Fernández, L. N., Rosas, A. Z. R., Ortíz, S. J. F., Ochoa-Zarzosa, A. and López-Meza, J. E. (2026). A Simple and Cost-Effective Method for Generating Spheroids From Triple-Negative Breast Cancer Cell Line (MDA-MB-231). Bio-protocol 16(6): e5641. DOI: 10.21769/BioProtoc.5641.
Do you have any questions about this protocol?
Post your question to gather feedback from the community. We will also invite the authors of this article to respond.