- Protocols

- Articles and Issues
- For Authors
- About
- Become a Reviewer

Framework for Analyzing the Anti-biofilm and Anti-virulence Activities of Fatty Acids from Hermetia illucens Larvae Targeting Multidrug-Resistant Klebsiella pneumoniae
Published: Vol 16, Iss 5, Mar 5, 2026 DOI: 10.21769/BioProtoc.5629 Views: 382
Reviewed by: Anonymous reviewer(s)
Original research article
The authors used this protocol in:

Jul 2024
Advertisement


Protocol Collections
Comprehensive collections of detailed, peer-reviewed protocols focusing on specific topics


Related protocols
Abstract
The emergence of antimicrobial resistance and the persistence of Klebsiella pneumoniae biofilms represent significant challenges to public health. Hermetia illucens (HI) larvae are considered a sustainable reservoir of novel bioactive compounds. This protocol details a method for extracting fatty acids from HI larvae fat (AWME3 fraction) and studying their effects on multidrug-resistant and hypervirulent Klebsiella pneumoniae strains. Effects are evaluated by crystal violet and ethidium bromide uptake assays, motility assays (swimming, swarming, and twitching), minimal biofilm inhibitory and eradication concentration tests (MBIC/MBEC) for single, mixed, and mature biofilms, light, fluorescence, and scanning electron microscopy imaging, and microbial adhesion to solvents (MATS). This protocol offers a reliable methodology for evaluating the anti-biofilm and anti-virulence properties of natural compounds.
Key features
• A reproducible protocol for extracting fatty acids from Hermetia illucens larvae fat (AWME3).
• A comprehensive set of assays to assess biofilm inhibition and eradication in multidrug-resistant and hypervirulent Klebsiella pneumoniae.
• Combines light, fluorescence, and scanning electron microscopy to visualize biofilm structure and fatty acid–induced morphological changes.
• Includes microbial adhesion to solvents (MATS) analysis for evaluating cell surface hydrophobicity in relation to biofilm formation.
Keywords: Hermetia illucensGraphical overview
Fatty acids from Hermetia illucens larvae fat inhibit biofilms and virulence factors of hypervirulent K. pneumoniae (hvKp)
Background
The global emergence of antimicrobial resistance (AMR), generated by the misuse and overuse of antibiotics, has become a critical challenge in clinical medicine. According to the World Health Organization (WHO), AMR is one of the top threats to public health and development worldwide. Multi-drug resistant (MDR) and carbapenem-resistant pathogens, especially Klebsiella pneumoniae, lead to serious hospital infections and high mortality rates. AMR-related deaths have been estimated at 1.27 million worldwide in 2019 [1–4].
Conventional antibiotic therapies often fail against biofilm-associated infections due to the intrinsic resistance of biofilms, where bacteria are encased in a self-produced extracellular matrix that protects them from antimicrobial agents and immune clearance [5]. Within biofilms, bacterial cells display altered phenotypes and metabolic states that contribute to persistent infection and therapeutic failure. In particular, hypervirulent K. pneumoniae (hvKp) strains exhibit enhanced biofilm-forming ability and virulence due to the presence of specific plasmids, capsular polysaccharides, siderophores, and fimbriae [6].
In recent years, anti-virulence strategies have gained attention as promising alternatives to conventional antibiotics. These approaches aim to attenuate pathogenicity by targeting factors like adhesion, mucoviscosity, motility, and biofilm formation without exerting selective pressure that promotes resistance. Notably, natural antimicrobial lipids, in particular insect-derived fatty acids, have demonstrated potential in modulation such bacterial behaviors [7].
The larvae of Hermetia illucens (HI) are a sustainable source of bioactive lipids and fatty acids, capable of biosynthesizing antimicrobial compounds. Previous studies from our group have shown that HI-derived fatty acid fractions exhibit bactericidal activity against MDR pathogens, including K. pneumoniae, Aeromonas, and Pseudomonas species [8–10]. In particular, acidic water–methanol extract 3 (AWME3) demonstrated potent activity at low doses against MDR and XDR strains.
This protocol outlines a step-by-step method for extracting and analyzing the anti-biofilm and anti-virulence properties of AWME3 on three K. pneumoniae strains: KPM9 (mucoviscous), KPi1627 (hyper-mucoviscous), and K. pneumoniae ATCC BAA-2473 (non-mucoid, carbapenem-resistant). Additionally, we outline the methodology to assess membrane permeability changes, Lewis’s acid–base surface properties, and ultrastructural alterations induced by AWME3, which provide mechanistic insight into its sub-MIC (minimum inhibitory concentration) effects on bacterial virulence factors.
Materials and reagents
Biological materials
1. Bacterial strain name: Environmental isolate K. pneumoniae KPM9 and clinical isolate K. pneumoniae KPi1627 strains were obtained from the State Collection of Pathogenic Microorganisms and Cell Cultures (SCPM, Obolensk, Russia). K. pneumoniae ATCC BAA-2473 laboratory strain was purchased from ATCC (American Type Culture Collection, United States).
Reagents
1. Hermetia Illucens (HI) larvae fat (provided by the company NordTechSad, LLC., Arkhangelsk, Russia)
2. Methanol (Sigma-Aldrich, catalog number: 67-56-1)
3. Acetic acid (HPLC grade) (Thermo Fisher Scientific, catalog number: 984303)
4. Ethanol (HPLC grade) (Thermo Fisher Scientific, catalog number: 444160050)
5. Hexane (HPLC grade) (Thermo Fisher Scientific, catalog number: H/0406/17)
6. Chloroform (HPLC grade) (Thermo Fisher Scientific, catalog number: 022920.K2)
7. Ethyl acetate (HPLC grade) (Thermo Fisher Scientific, catalog number: PZP3300000EPDM55M)
8. Toluene (HPLC grade) (Thermo Fisher Scientific, catalog number: 042356.KV)
9. Hydrochloric acid (37%) (Sigma-Aldrich, CAS number: 7647-01-0)
10. Crystal violet (Sigma-Aldrich, CAS number: 548-62-9)
11. Propidium iodide (Sigma-Aldrich, CAS number: 25535-16-4)
12. Ethidium bromide (EtBr) (Sigma-Aldrich, CAS number: 1239-45-8)
13. Glutaraldehyde (Sigma-Aldrich, CAS number: 111-30-8)
14. Phosphate buffer saline (PBS) (Sigma-Aldrich, catalog number: D5773)
15. Luria Bertani (LB) agar (Sigma-Aldrich, catalog number: L3272)
16. LB broth (Sigma-Aldrich, catalog number: 28713)
17. Mueller Hinton agar (Sigma-Aldrich, catalog number: 70191)
18. MH broth (Sigma-Aldrich, catalog number: 70192)
19. Tryptone soy agar (Oxoid, catalog number: CM0131B)
20. Peptone (Sigma-Aldrich, CAS number: 100209-45-8)
21. Tryptone (Sigma-Aldrich, CAS number: 91079-40-2)
22. NaCl (Sigma-Aldrich, catalog number: 7647-14-5)
23. Yeast extract (Difco, catalog number: 210929)
24. Doxycycline (Thermo Fisher Scientific, catalog number: J60422.06)
25. Glucose (Sigma-Aldrich, catalog number: 492-62-6)
26. Agar (Sigma-Aldrich, catalog number: 9002-18-0)
27. Glycerol (≥99.5%, molecular biology grade) (Sigma-Aldrich, CAS number: 56-81-5)
Notes:
1. Ethidium bromide (EtBr) is a mutagenic agent and must be handled in a designated fume hood while wearing gloves, a lab coat, and protective eyewear. All EtBr-containing waste should be collected separately and disposed of following institutional hazardous waste protocols.
2. Glutaraldehyde is toxic and a potential sensitizer. Handling should be performed in a fume hood with nitrile gloves and safety goggles.
3. Chloroform is volatile, toxic, and potentially carcinogenic; it should only be used in a well-ventilated chemical fume hood with appropriate PPE, and waste should be collected in approved solvent containers.
Solutions
1. AWME3 extraction buffer (see Recipes)
2. 1 mM propidium iodide (PI) solution (see Recipes)
3. 0.1%–2% crystal violet (CV) solution (see Recipes)
4. Swarming agar (see Recipes)
5. Swimming agar (see Recipes)
6. Twitching agar (TSA) (see Recipes)
Recipes
1. AWME3 extraction buffer
AWME3 extraction buffer [Milli-Q water:methanol:HCl at 90:9:1 (v/v/v)] is prepared as follows (100 mL total):
a. Add 90 mL of Milli-Q water to a clean glass bottle.
b. Add 9 mL of methanol.
c. Carefully add 1 mL of concentrated HCl.
Note: Add acid to water, not the reverse.
d. Mix thoroughly by gentle inversion.
e. Store at 4 °C. Prepare fresh when possible.
2. 1 mM propidium iodide (PI) solution
a. Weigh 0.67 mg of propidium iodide.
b. Dissolve in 1 mL of sterile distilled water.
c. Mix until fully dissolved.
d. Filter-sterilize using a 0.22 μm syringe filter.
e. Store at 4°C, protected from light.
Note: For long-term storage, aliquot and keep at -20 °C.
3. 0.1%–2% crystal violet (CV) solution
a. Add 1 g of crystal violet powder to a clean container.
b. Add 100 mL of methanol.
c. Stir until completely dissolved.
d. Filter through a Whatman No. 1 filter paper to remove particulate matter.
e. Store at room temperature, protected from light.
4. Swarming agar
1% glucose, 0.5% peptone, 0.2% yeast extract, 0.5% agar.
5. Swimming agar
1% tryptone, 0.5% NaCl, 0.3% agar.
6. Twitching agar (TSA agar)
1.5% enzymatic digests of casein, 0.5% soybean meal, 0.5% NaCl, and 1% agar.
Laboratory supplies
1. Tissue culture 96-well microplate (TPP, catalog number: 92696)
2. 96-well black clear flat-bottom plates (Lifesciences, catalog number: 3603)
3. Petri dishes (90 mm) (Pertin, catalog number: 4BN-1-V-14Х9ОPS)
4. Cover glass (Thermo Fisher Scientific, catalog number: 174934)
5. Six-well plate (TPP, catalog number: 92406)
6. Sterile 15 mL centrifuge tube with screw cap (BRAND, GMBH, catalog number: BRAND 114818)
7. Eppendorf tubes 2 mL (Sigma-Aldrich, catalog number: 41121703)
8. 0.22 mm syringe filter (Sigma-Aldrich, CAS number: SKU GVHP02500)
9. Light-protected microtube (foil-wrapped) (AHN Biotechnology, GmbH, catalog number: 5100500C)
Equipment
1. CLARIOstar® Plus multimodal plate reader (BMG Labtech, catalog number: 430-0213)
2. Vortex V-1 (BIOSAN/Latvia, catalog number: 01020317112371)
3. Fluorescent microscope (Life Technologies, catalog number: A1414-178C-011)
4. Scanning electron microscope (TESCAN, catalog number: 119-0261)
5. Orbital shaker Mixmate (Eppendorf, catalog number: 5353DN816980)
6. ULTRA TURRAX-25 homogenizer (IKA, catalog number: 03390348)
7. Centrifuge 5804 (Eppendorf, catalog number: 15804DM763688)
8. Concentrator plus (Eppendorf, catalog number: 5305C1521508)
9. GC-MS-QP2010 ultra mass spectrometer (Shimadzu, catalog number: 020524970125)
10. PAL 5000 autosampler (Gerstel, catalog number: 229643)
11. Capillary column DB-5ms (Restek, catalog number: 12620)
12. Light microscope (Life Technologies, (Nikon, model: ECLIPSE TS 100, catalog number: A1414-178C-011)
13. Elma ultrasonic cleaner (Elma Schmidbauer GmbH, model: S 60H, catalog number: 100 2238)
14. Vitek-2 Compact instrument with a VITEK® 2 Gram-negative (GN) ID card (BioMérieux, SKU number 21341)
15. MALDI-TOF Biotyper (Bruker Daltonics)
Software and datasets
1. Fiji ImageJ software (National Institutes of Health, Bethesda, USA)
2. NIST mass spectra database (NIST 08, MS v.2., MD 20899, 2008)
3. GraphPad Prism 7 (GraphPad Software Inc., San Diego, CA, United States)
Procedure
A. Extraction of AWME3 [8–12]
Note: Extraction of antibacterial fatty acids is illustrated in Figure 1.
1. Prepare 100 mL of AWME3 extraction buffer (see Recipes).
2. Mix 3 g of HI larvae fat and homogenize with 10 mL of the AWME3 extraction buffer under hot tap water (50 °C) for 5 min.
3. Mix the suspension for 24 h on the horizontal Mixmate orbital shaker at 2,000 rpm at room temperature (25 °C).
4. Melt the HI larvae fat suspension under hot tap water again at 50 °C for 5 min.
5. Sonicate the suspension using an Elma Ultrasonic Cleaner.
6. Perform sonication at a controlled temperature of 35 °C for 10 min with an amplitude setting of 70% (corresponding to medium power mode).
7. Transfer the suspension to a sterile 15 mL centrifuge tube partially submerged in the ultrasonic bath to ensure uniform energy distribution.
8. Pause the process intermittently every 2 min for 15 s to prevent overheating.
9. Homogenize the suspension using the ULTRA homogenizer at 17,000 rpm for 10 min at room temperature.
10. Centrifuge the tubes at 2,700× g for 20 min to separate the suspension into three layers (oil layer, aqueous layer, and precipitate layer) at room temperature.
11. Aspirate the aqueous layer using a sterile syringe and transfer it to a sterile 15 mL centrifuge tube.
12. Keep the tube at 4 °C and label it as AWME1.
13. Add 10 mL of AWME3 extraction buffer to the remaining oil layer.
14. Repeat the extraction for two rounds, repeating steps A1–12.
15. Label the second round as AWME2.
16. Label the third round as AWME3.
17. Concentrate AWME3 using a vacuum concentrator at 45 °C for 13 h.
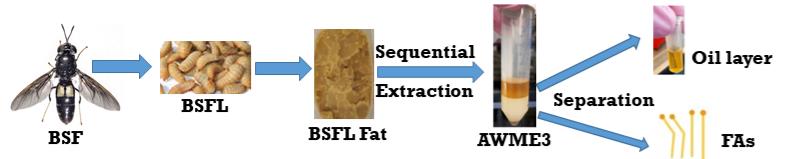
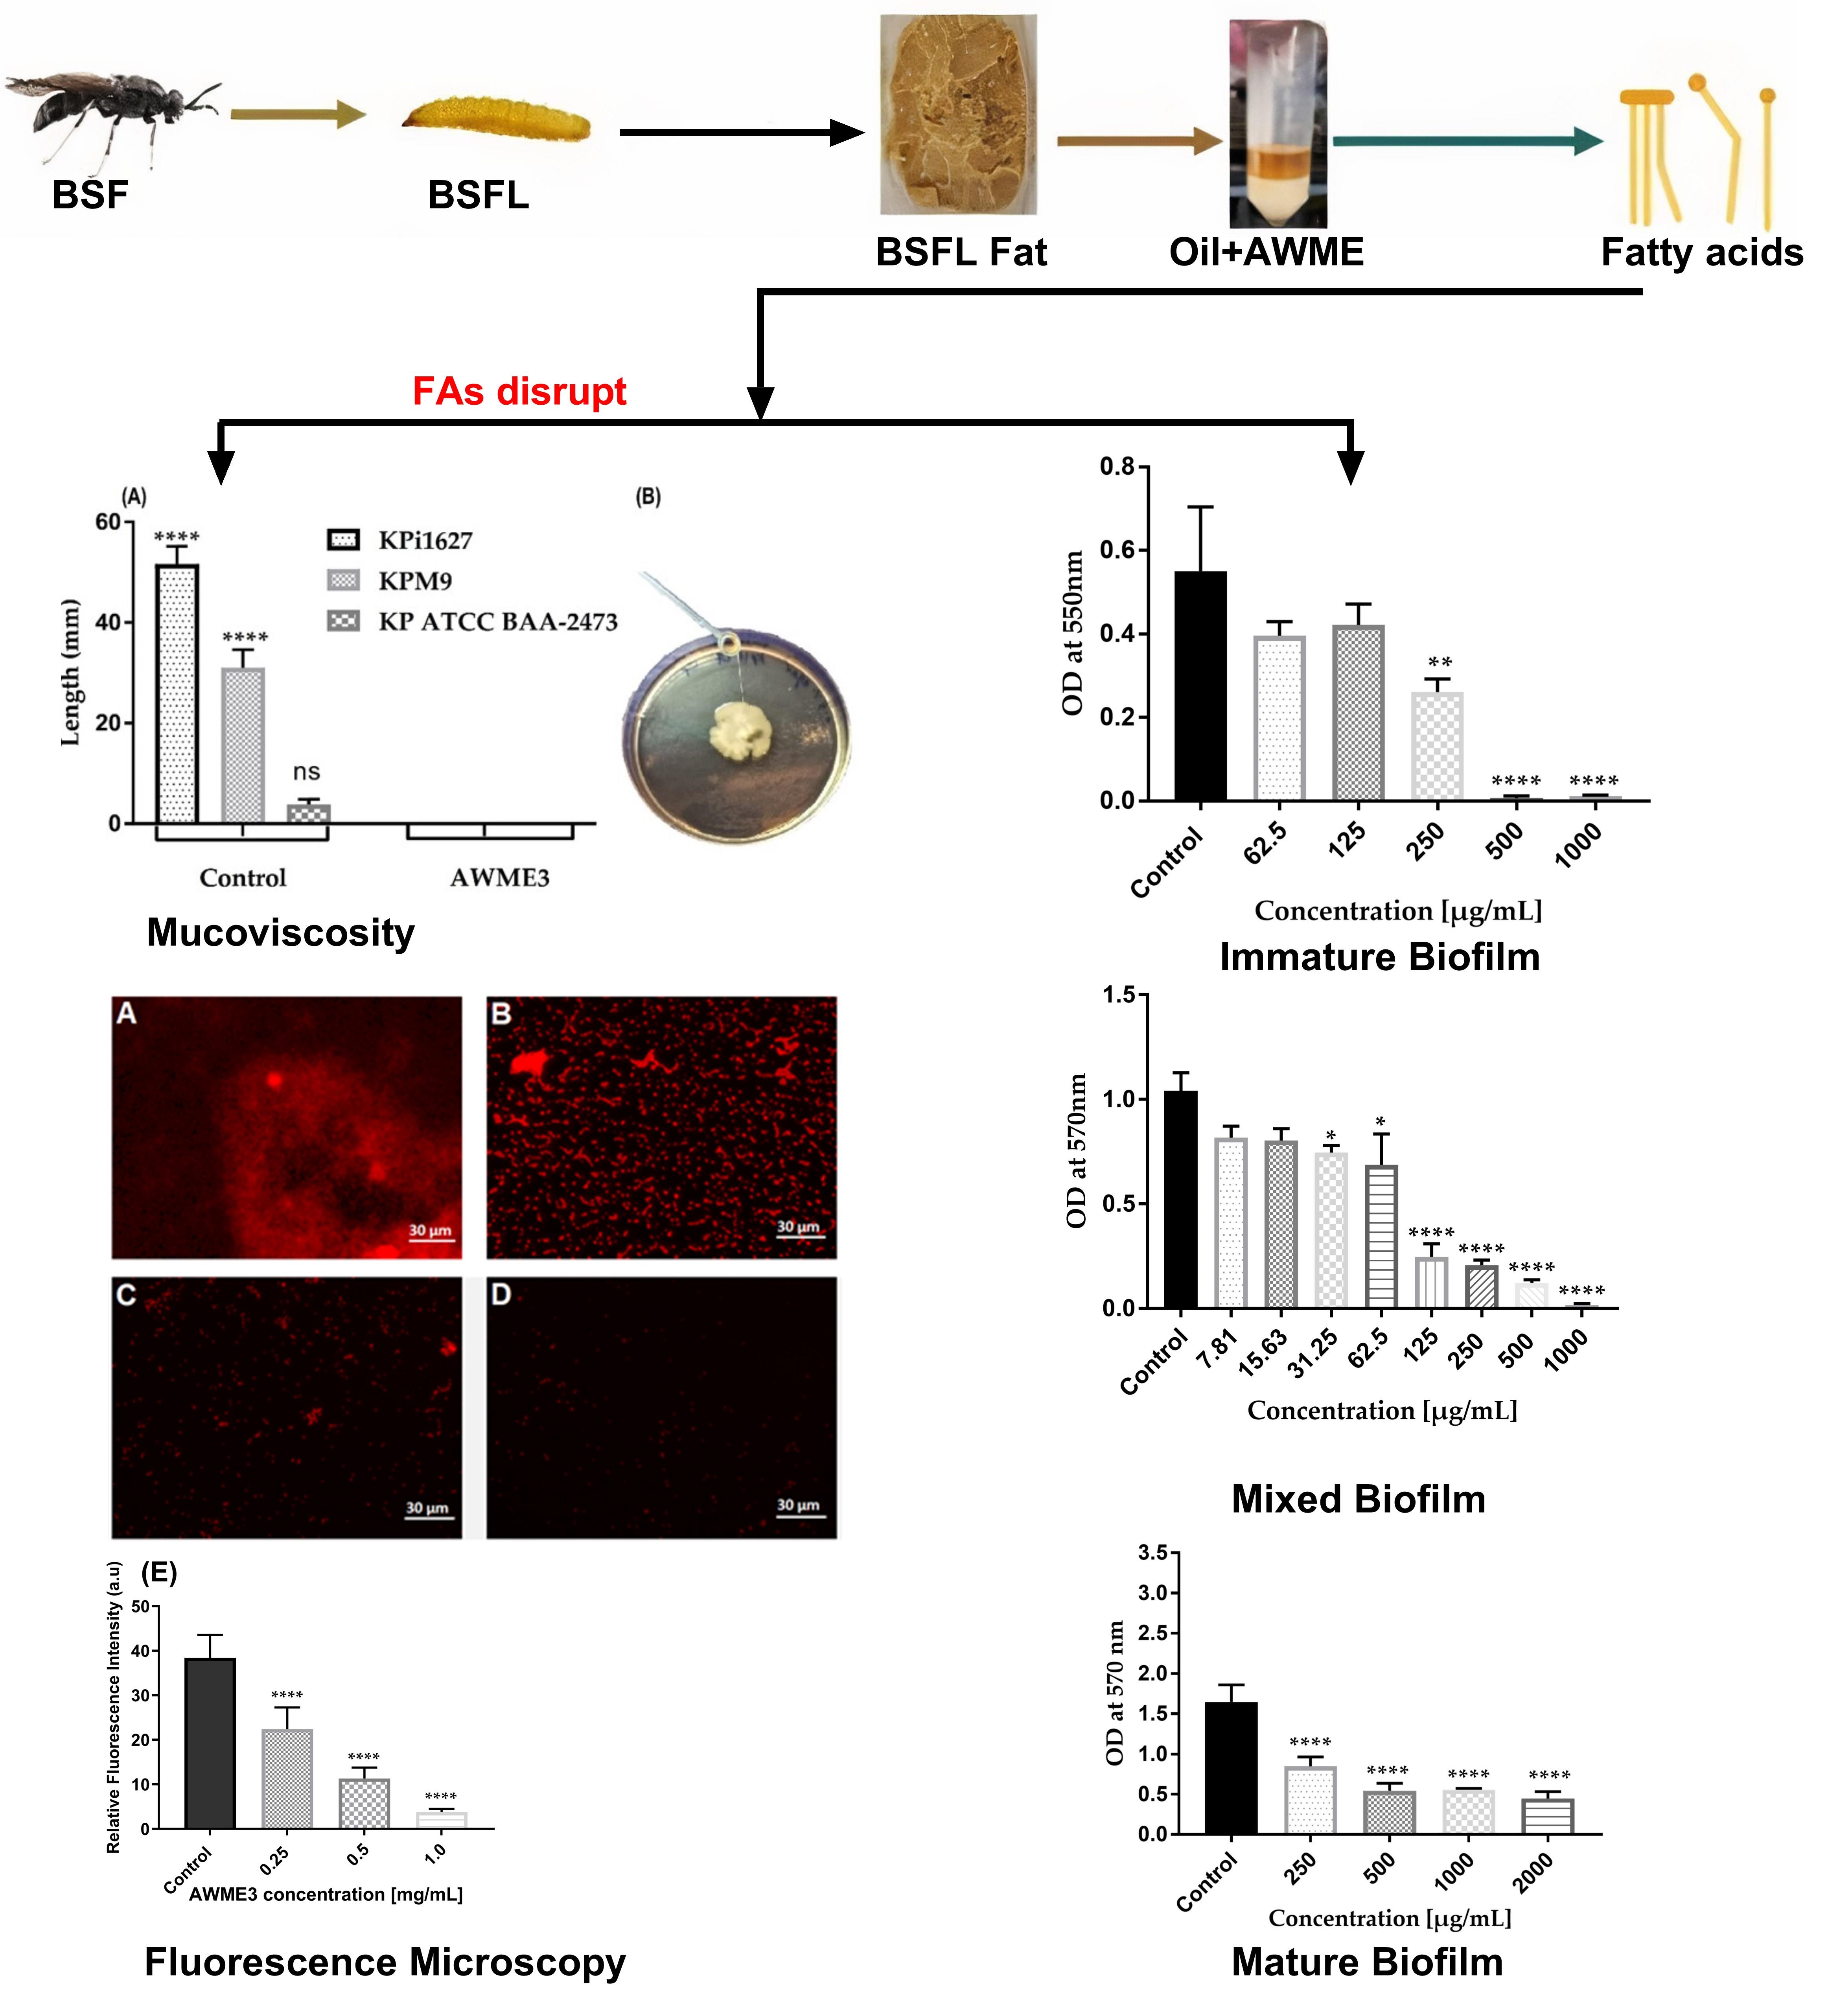
Figure 1. Schematic diagram of sequential extraction of black soldier fly (BSF) larvae fat. The BSF lay eggs that turn into larvae, which are pressed at high temperature and pressure; then, fats are solidified, and 3 g of BSF larvae fat are subjected to sequential extraction to obtain AWME3 extract, which is composed of a mixture of saturated and unsaturated fatty acids.
18. Calculate the concentration of AWME3:
a. Transfer 1 mL of the concentrated AWME3 to a preweighed 2 mL Eppendorf tube. Record the weight as X1 g.
b. Evaporate the 1 mL completely at 70 °C.
c. Weigh the Eppendorf tube after complete evaporation to get X2. The dry weight can then be calculated as follows: Dry weight (mg) = X2 - X1.
d. Adjust the stock concentration to be 20 mg/mL using AWME3 extraction buffer.
19. Strain identification: Identify culture strains according to Lev et al. [13] using VITEK 2 and MALDI-TOF and keep them in sterile 15% glycerol at -80 °C [prepare a sterile 15% (v/v) glycerol solution using autoclaved Milli-Q water].
B. Bacterial culture preparation
1. Inoculate a single colony from each strain into a sterile centrifuge tube containing 10 mL of LB broth.
2. Incubate the LB broth–bacterial culture tube overnight at 37 °C with shaking at 210 rpm. Harvest bacterial cultures at the mid-logarithmic phase, corresponding to an optical density (OD600) of 0.5 ± 0.05.
3. Wash bacterial cells three times with 5 mL of sterile PBS (pH 7.4) to remove residual media components.
4. Adjust the culture to half of the McFarland standard (1 × 10⁸ CFU/mL) to use it in biofilm assays under static conditions.
5. Determine the bacterial density by comparing the turbidity of the culture to a McFarland 0.5 standard (~1 × 10⁸ CFU/mL) and adjust the culture to 1 × 10⁸ CFU/mL using sterile medium.
C. Assessing the effect of AWME3 on membrane permeability in K. pneumoniae strains (see Figures 2–5)
1. Culture K. pneumoniae strains in 5 mL of LB broth and incubate at 37 °C overnight with shaking at 180 rpm.
2. Grow bacterial cultures to mid-logarithmic phase, corresponding to an optical density (OD600) of 0.5 ± 0.05.
3. Harvest cells by centrifugation and wash three times with 5 mL of sterile PBS (pH 7.4) to remove residual media components.
4. Resuspend bacterial pellets in 5 mL of PBS.
5. Perform a 2-fold serial dilution of AWME3 2 mg/mL in a 96-well microplate by adding 100 μL of the sample into wells already containing 100 μL of LB broth in triplicate to give a concentration from 2 MIC (0.5 mg/mL) to 1/4 MIC (0.0625 mg/mL) (MIC was previously determined to equal 0.250 mg/mL), after adding 100 μL of bacterial density (1 × 10⁸ CFU/mL).
6. Seal all 96-well microplates to avoid evaporation and incubate them for 4 h at 37 °C.
7. Incubate bacterial cells with 1% crystal violet solution (see Recipes) in the dark for 15 min.
8. Centrifuge all 96-well microplates at 1,700× g for 10 min at room temperature.
9. Transfer the supernatant to a new 96-microtiter plate; then, measure the absorbance of the supernatant at OD570 nm using the CLARIOstar® Plus multimodal plate reader at room temperature.
10. Consider the absorbance of CV (control) as 100% at OD570.
11. Calculate the crystal violet uptake using the following formula: % of uptake = (OD570 of the sample)/(OD570 of the crystal violet solution) × 100.
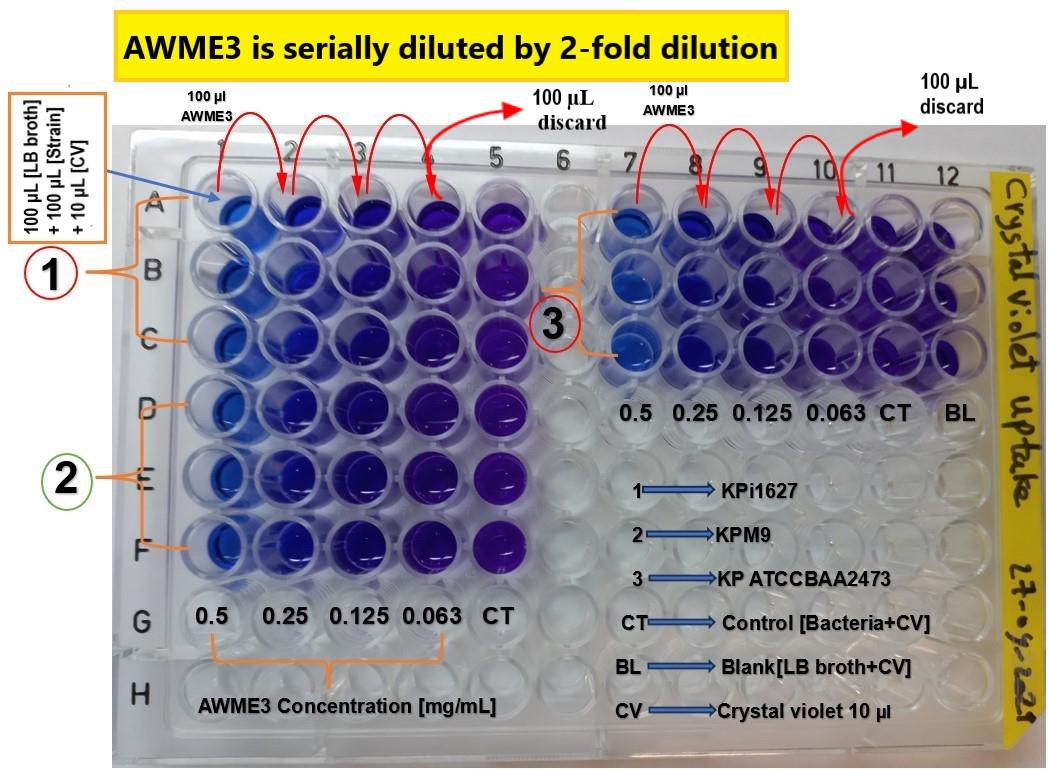
Figure 2. Schematic layout of the 96-well microplate to assess membrane permeability of K. pneumoniae strains induced by AWME3 and measured by the crystal violet (CV) assay. The 96-well microplate is filled with 100 μL of LB broth in columns 1–5 and 7–12. Subsequently, 100 μL of the AWME3 extract is added and serially diluted across columns 1–4 and 7–10. Next, 100 μL of the corresponding bacterial suspension is added to each well, with the exception of column 12, which is the blank. After incubation for 4 h, membrane permeability is evaluated by adding 10 μL of crystal violet solution to each well. The absorbance of the supernatant is measured at OD570 nm after incubation in the dark for 15 min. All experimental conditions are performed in triplicate. Columns 5 and 11 serve as untreated controls, while column 12 (triplicate) is used as the blank. Numbers in the rows correspond to the tested K. pneumoniae strains: (1) KPi1627, (2) KPM9, and (3) K. pneumoniae ATCC BAA-2473.
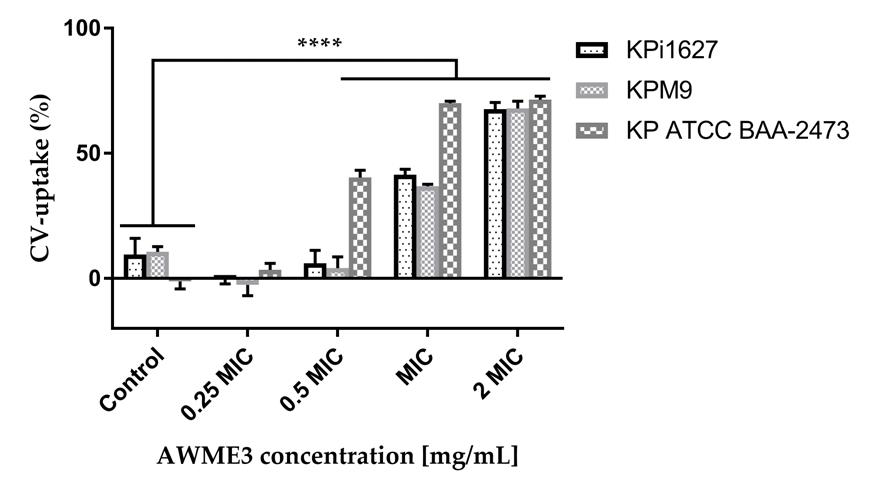
Figure 3. Modes of AWME3 action of crystal violet (CV) uptake by K. pneumoniae cellular membrane. Bacterial strains were treated with 0.25 minimum inhibitory concentration (MIC) (0.0625 mg/mL), 0.5 MIC (0.125 mg/mL), 1 MIC (0.250 mg/mL), and 2 MIC (0.5 mg/mL) of AWME3 concentrations for 4 h. Membrane permeability was calculated after measuring the absorbance of CV dye. All data are expressed as mean ± SD of three independent experiments. Statistical analyses were performed using two-way ANOVA and Dunnett’s multiple comparisons test (****p = 0.0001).
D. Ethidium bromide (EtBr) uptake
1. Culture all K. pneumoniae strains in 5 mL of LB broth at 37 °C for 24 h.
2. Grow bacterial cultures to mid-logarithmic phase, corresponding to an optical density (OD600) of 0.5 ± 0.05.
3. Harvest cells by centrifugation and wash them three times with 5 mL of sterile PBS (pH 7.4) to remove residual media components.
4. Resuspend the obtained pellets under centrifugation in 5 mL of PBS and adjust them to OD600 ~0.5.
5. Add 100 μL of bacterial suspension in triplicate to the 96-well black clear flat-bottom plates, where it is mixed with 100 μL of AWME3 extraction buffer to a final concentration from 2 MIC to 1/4 MIC. Incubate the 96-well plates for 8 h at 37 °C.
6. Incubate bacterial cells with 20 μL of EtBr (5 μg/mL) in the dark for 15 min at room temperature.
7. Centrifuge all 96-well black clear flat-bottom plates at 1,700× g and measure the fluorescence of the supernatant at an excitation wavelength of 330 nm (energy input to excite EtBr molecules) and emission of 585 nm (the wavelength of light emitted by excited EtBr) using the CLARIOstar® Plus multimodal plate reader.
8. Calculate the normalized value using the following formula: Normalized fluorescence (%) = (Ftreated/Fmax) × 100.
9. Data normalization was performed on a control sample containing EtBr without bacteria and representing the maximal fluorescence intensity.
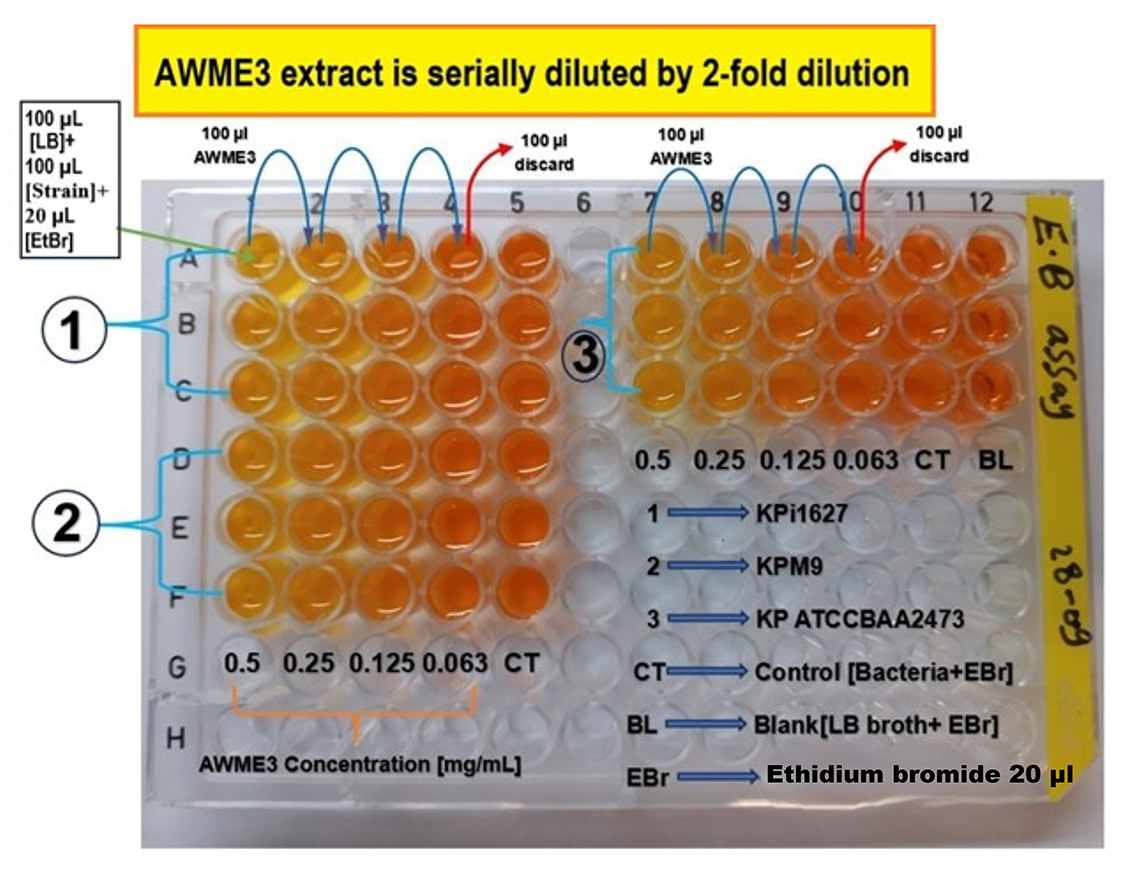
Figure 4. Schematic layout of the 96-well microplate to assess membrane permeability of K. pneumoniae strains induced by AWME3 and measured by ethidium bromide (EtBr) uptake. Each well contains 100 μL of LB broth (columns 1–5 and 7–12). The AWME3 extract (100 μL) is added and serially diluted across columns 1–4 and 7–10. A 100 μL bacterial suspension is added to each well, except in column 12, which serves as the blank. After incubation for 4 h, membrane permeability is evaluated by adding 20 μL of EtBr solution to each well. The absorbance is measured at an excitation wavelength of 330 nm and emission of 585 nm after incubation in the dark for 15 min. All conditions are performed in triplicate. Columns 5 and 11 serve as untreated controls, and column 12 (triplicate) serves as the blank. Numbers in the rows correspond to the tested K. pneumoniae strains: (1) Kpi1627, (2) KPM9, and (3) K. pneumoniae ATCC BAA-2473.
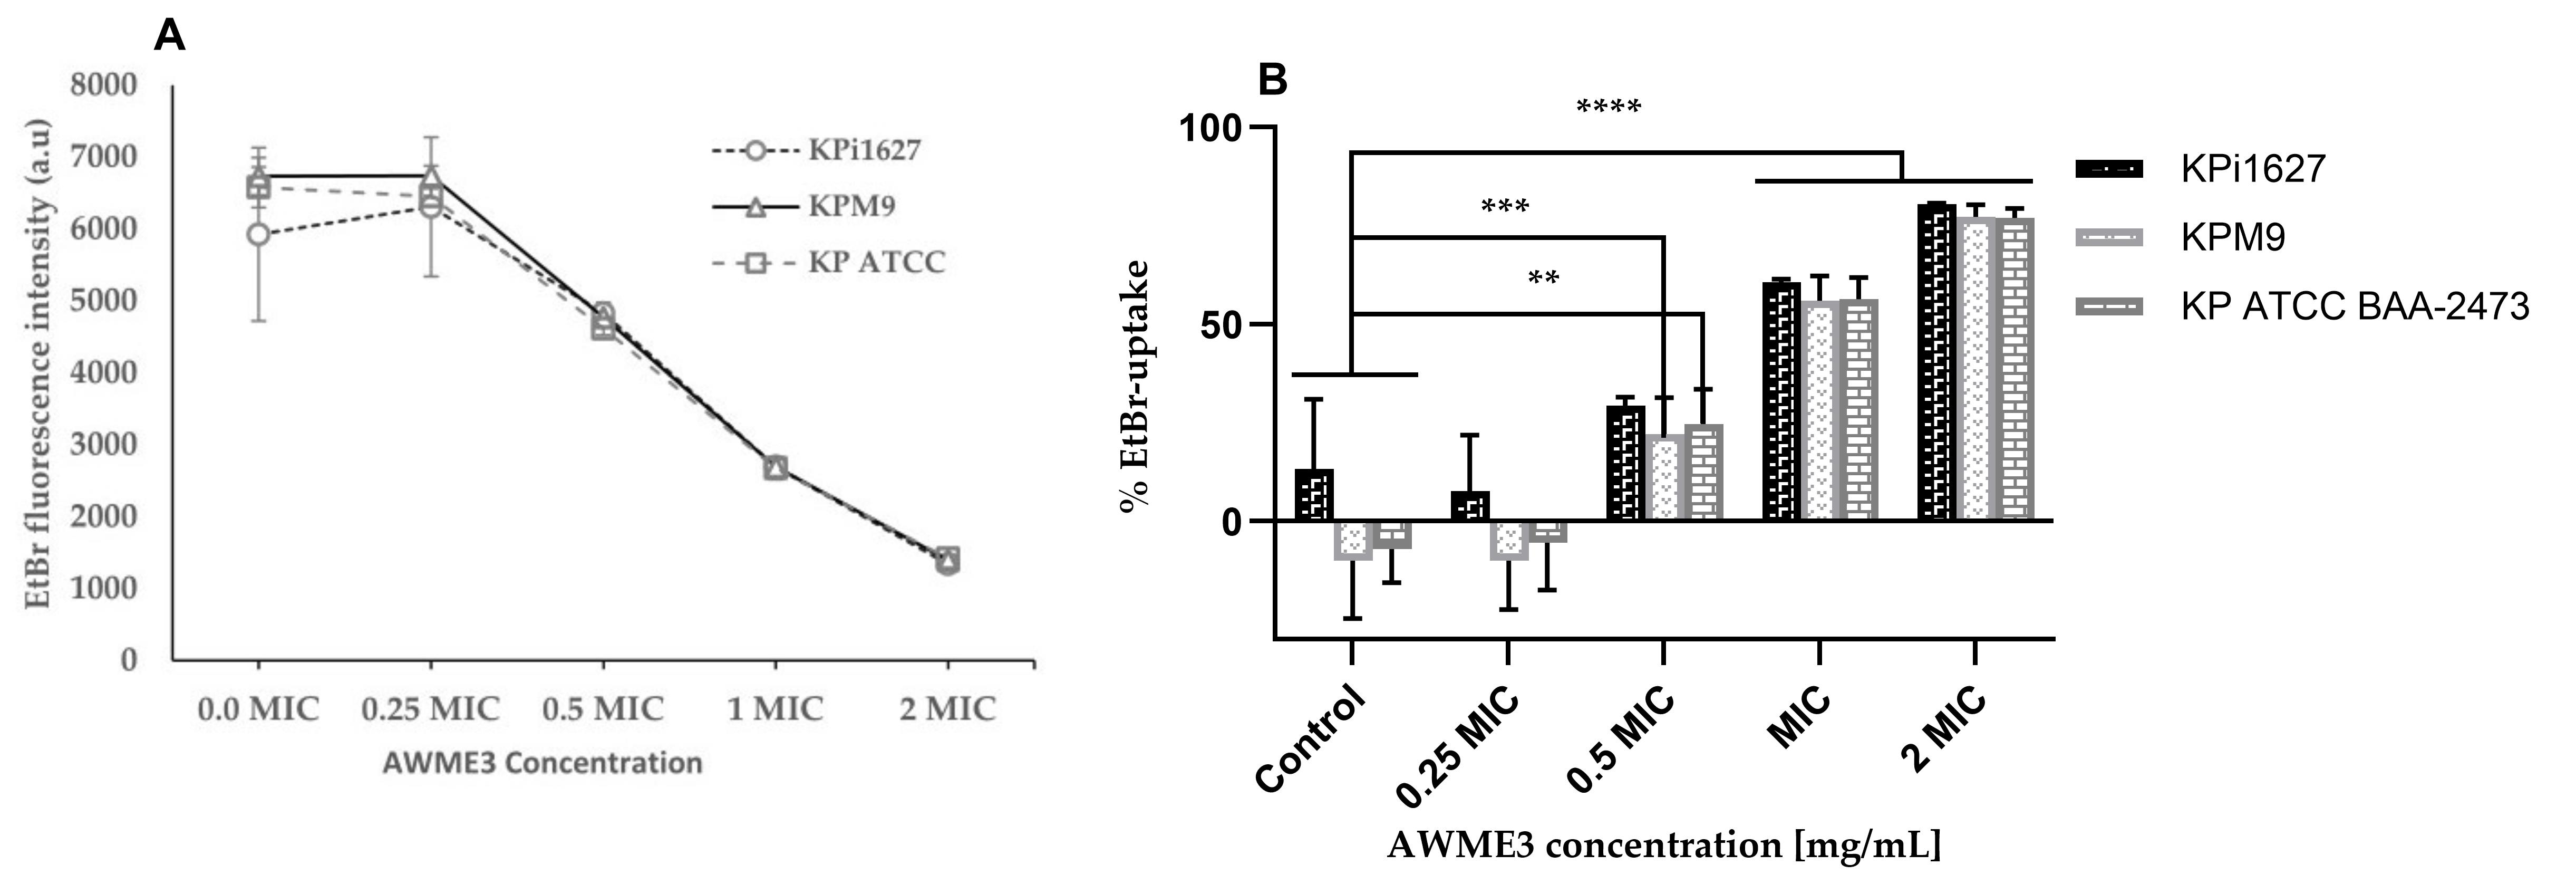
Figure 5. Membrane disruption of K. pneumoniae strains caused by AWME3. All strains were treated with 0.25 MIC (0.0625 mg/mL), 0.5 MIC (0.125 mg/mL), 1 MIC (0.25 mg/mL), and 2 MIC (0.5 mg/mL) of AWME3 for 8 h. (A) Membrane disruption was determined by measuring the fluorescence intensity values of ethidium bromide (EtBr). (B) Absorbance of EtBr uptake in triplicate. All data are the average ± STD of three independent experiments. A two-way ANOVA test and Dunnett’s multiple comparisons test were performed (**p = 0.001, ***p ≤ 0.0009, ****p ≤ 0.0001).
E. Autoaggregation assay (see Figure 6)
1. Grow bacterial cultures to mid-logarithmic phase, corresponding to an optical density (OD600) of 0.5 ± 0.05.
2. Harvest cells by centrifugation and wash three times with 5 mL of sterile PBS (7.4) to remove residual media components.
3. Resuspend the clumped pellets in 5 mL of PBS (pH 7.4) to an OD600 ~0.5 (ODinitial).
4. Next, treat cells with sub-MIC (0.125 mg/mL) of AWME3.
5. Incubate the treated and untreated (control) bacteria for 6 h at 37 °C under static conditions.
6. Measure the OD600 of the upper layer of each bacterial suspension at OD600 (ODfinal). The blank is a mixture of 1 mL of PBS + 1 mL of AWME3.
7. Calculate the autoaggregation (%) using the following formula: Auto-aggregation (%) = (1 - ODfinal/ODinitial) × 100.
F. Precipitation (mucoviscosity) assay
Note: Mucoviscosity of Klebsiella pneumoniae strains is determined by performing the precipitation assay (see Figure 6).
1. Grow bacterial cultures to mid-logarithmic phase, corresponding to an optical density (OD600) of 0.5 ± 0.05.
2. Harvest cells by centrifugation and wash three times with 5 mL of sterile PBS (pH 7.4) to remove residual media components.
3. Grow all tested strain cultures in 5 mL of LB broth and then dilute to 0.1 OD600 in LB broth. Grow cultures with or without sub-MIC (final concentration is 0.125 mg/mL) of AWME3.
4. Incubate all cultures overnight (16–18 h) at 37 °C.
5. Centrifuge all samples at 1,000× g for 5 min.
6. Remove the supernatant without disturbing the pellet for OD600 measurement. Transfer it to clean 2 mL Eppendorf tubes and leave them standing for 15 min at room temperature.
7. Visualize all supernatants and dense pellets that are tested for mucoviscosity.
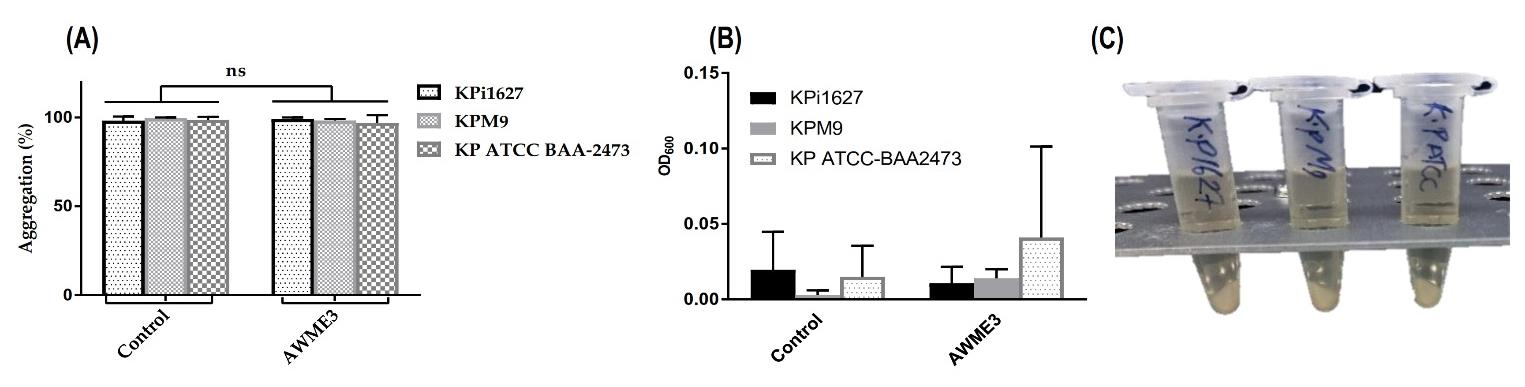
Figure 6. Autoaggregation, mucoviscosity, and precipitation assays of K. pneumoniae strains. (A, B) Kpi1627, KPM9, and KP ATCC BAA-2473 strains were cultured in LB broth and incubated overnight at 37 °C. Then, all strains were treated with 0.5 MIC (0.125 mg/mL) of AWME3, which did not show any turbidity and mucoviscosity. (C) Centrifugation for 10 min at low speed (1,000× g) led to high precipitation of treated and untreated strains, and dense pellets were formed.
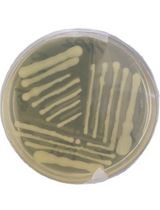
G. String test
Note: The hypermucoviscous (HMV) phenotype of Klebsiella pneumoniae is characterized by the overproduction of capsular polysaccharide, resulting in highly viscous, mucoid bacterial colonies that form a string ≥5 mm in length when stretched with an inoculation loop (positive string test, as indicated in Figure 7).
1. Grow bacterial cultures to mid-logarithmic phase, corresponding to an optical density (OD600) of 0.5 ± 0.05.
2. Harvest cells by centrifugation and wash three times with 5 mL of sterile PBS (pH 7.4) to remove residual media components.
3. Grow all bacterial strains with sub-MIC (0.125 mg/mL) of AWME3 or without treatment (control) on an MH agar plate and incubate at 37 °C for 72 h.
4. Pick up a loop and stretch the grown colony by the loop.
5. Determine the length (cm) of the formed string, which measures more than 5 mm for treated and untreated bacteria, and is stretched by the inoculation loop, being defined as a positive string test.
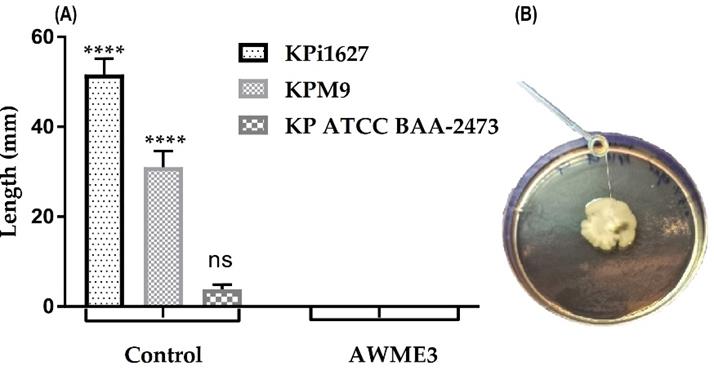
Figure 7. String test for K. pneumoniae strains. (A, B) Bacterial strains were cultured on MH agar plates and incubated for 72 h. All strains were exposed to 0.5 MIC (0.125 mg/mL) of AWME3. A sterilized loop was used to stretch the bacterial colony grown on the MH agar; all strains were negative for the string assay (A), contrary to the control group (shown in B). Results are expressed as mean ± STD of three independent experiments. A two-way ANOVA test and Tukey’s multiple comparisons test were performed (****p ≤ 0.0001).
H. Microbial adhesion to solvent (MATS) assay
Note: The microbial adhesion to organic solvents (MATS) assay (Figure 8) is used to assess the Lewis acid–base characteristics and the hydrophilic or hydrophobic properties of bacterial cell surfaces following AWME3 treatment. The assay is based on the partitioning of bacterial cells between an aqueous phase and organic solvents with comparable van der Waals surface tension components but differing electron-donating or electron-accepting properties.
1. Grow bacterial cultures to mid-logarithmic phase, corresponding to an optical density (OD600) of 0.5 ± 0.05.
2. Harvest cells by centrifugation and wash three times with 5 mL of sterile PBS (pH 7.4) to remove residual media components.
3. Adjust bacterial cultures to 109 CFU/mL and subject them to a sub-MIC (0.5 MIC) of AWME3 (125 μg/mL) (v/v) by adding 1 mL of sub-MIC to 1 mL of bacterial suspension. Incubate for 4 h at 37 °C.
4. Leave 1 mL of an equivalent number of cells (control) without treatment and incubate for 4 h at 37 °C.
5. Centrifuge cells at 2,700× g for 5 min and wash the resulting pellets three times. Resuspend in 1.2 mL of suspending liquid (0.1 M PBS adjusted to pH 7).
6. Measure OD of the bacterial suspension at 400 nm before mixing the tested solvents in the presence or absence of sub-MIC of AWME3.
7. Vortex the bacterial suspension for 90 s with 0.2 mL of the solvent (hexane, ethyl acetate, chloroform, and toluene) under study.
8. Examine the mixture carefully after 15 min of standing to ensure that the two phases are completely separated at room temperature.
9. Aspirate 1 mL of each sample from the aqueous phase and measure OD at 400 nm at room temperature.
10. Monitor the aqueous phase using phase contrast microscopy to detect any cell clumping or lysis that could have been caused by the solvent.
11. Determine the percentage of adhered cells using the following formula: % adherence = (1 - A/Ao) × 100, where Ao represents the initial optical density measured at 400 nm of the bacterial suspension before mixing, and (A) represents the absorbance after mixing.
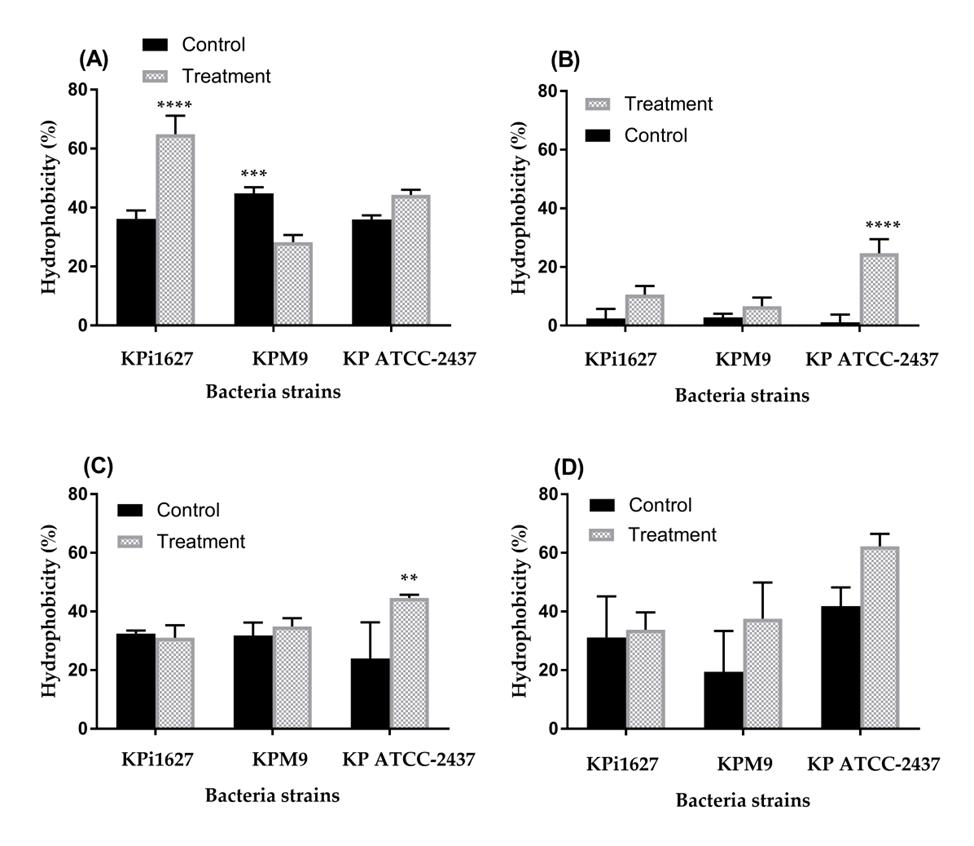
Figure 8. Influence of 0.5 MIC (0.125 mg/mL) on the hydrophobicity activity of K. pneumoniae strains against different hydrocarbons. (A) Chloroform, (B) hexane, (C) ethyl acetate, and (D) toluene. Data are mean values ± STD (n = 3). Data were analyzed by two-way ANOVA, followed by Tukey’s multiple comparisons test (**p = 0.009; ****p < 0.0001).
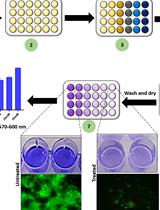
I. In vitro biofilm formation (BF)
Note: Biofilm formation is determined in a 96-well microplate using the crystal violet assay (Figure 9).
1. Grow bacterial cultures to mid-logarithmic phase, corresponding to an optical density (OD600) of 0.5 ± 0.05.
2. Harvest cells by centrifugation and wash three times with 5 mL of sterile PBS (pH 7.4) to remove residual media components
3. Culture K. pneumoniae strains in 5 mL of LB broth overnight at 37 °C and then adjust to 0.1 OD600 nm.
4. Transfer 200 μL of bacterial suspension with OD600 ~0.1 to 96-well microplates and incubate without shaking for 24 h at 37 °C.
5. Remove the planktonic cells and wash 96-well microplates carefully with 200 μL of PBS (pH 7.2 ± 0.2) without disturbing the biofilm formed along the wall of the microplate or attached to the bottom. Then, dry at 37 °C for 40 min.
6. Add 125 μL of 1.5% CV solution to each well and incubate the 96-well microplates at room temperature for 15 min.
7. Wash the 96-well plate three times with distilled water to remove the stain. Then dry at 60 °C for 1 h.
8. Add 125 μL of 30% acetic acid to each well and then incubate at room temperature for 10 min with shaking at 400 rpm.
9. Measure the absorbance at 550 nm at room temperature.
10. Determine the bacterial biofilm (BF) according to the following formula: BF = AB - CW, where AB is the OD of the wells attached by bacteria, and CW is the OD of the stained control wells (no bacterial cells).
11. Perform the experiment in triplicate on three different days. Biofilm production capacity by each strain is scored as either strong (BF ≥ 0.300), moderate (BF = 0.200–0.299), weak (BF = 0.100–0.199), or negative (BF ≤ 0.100).
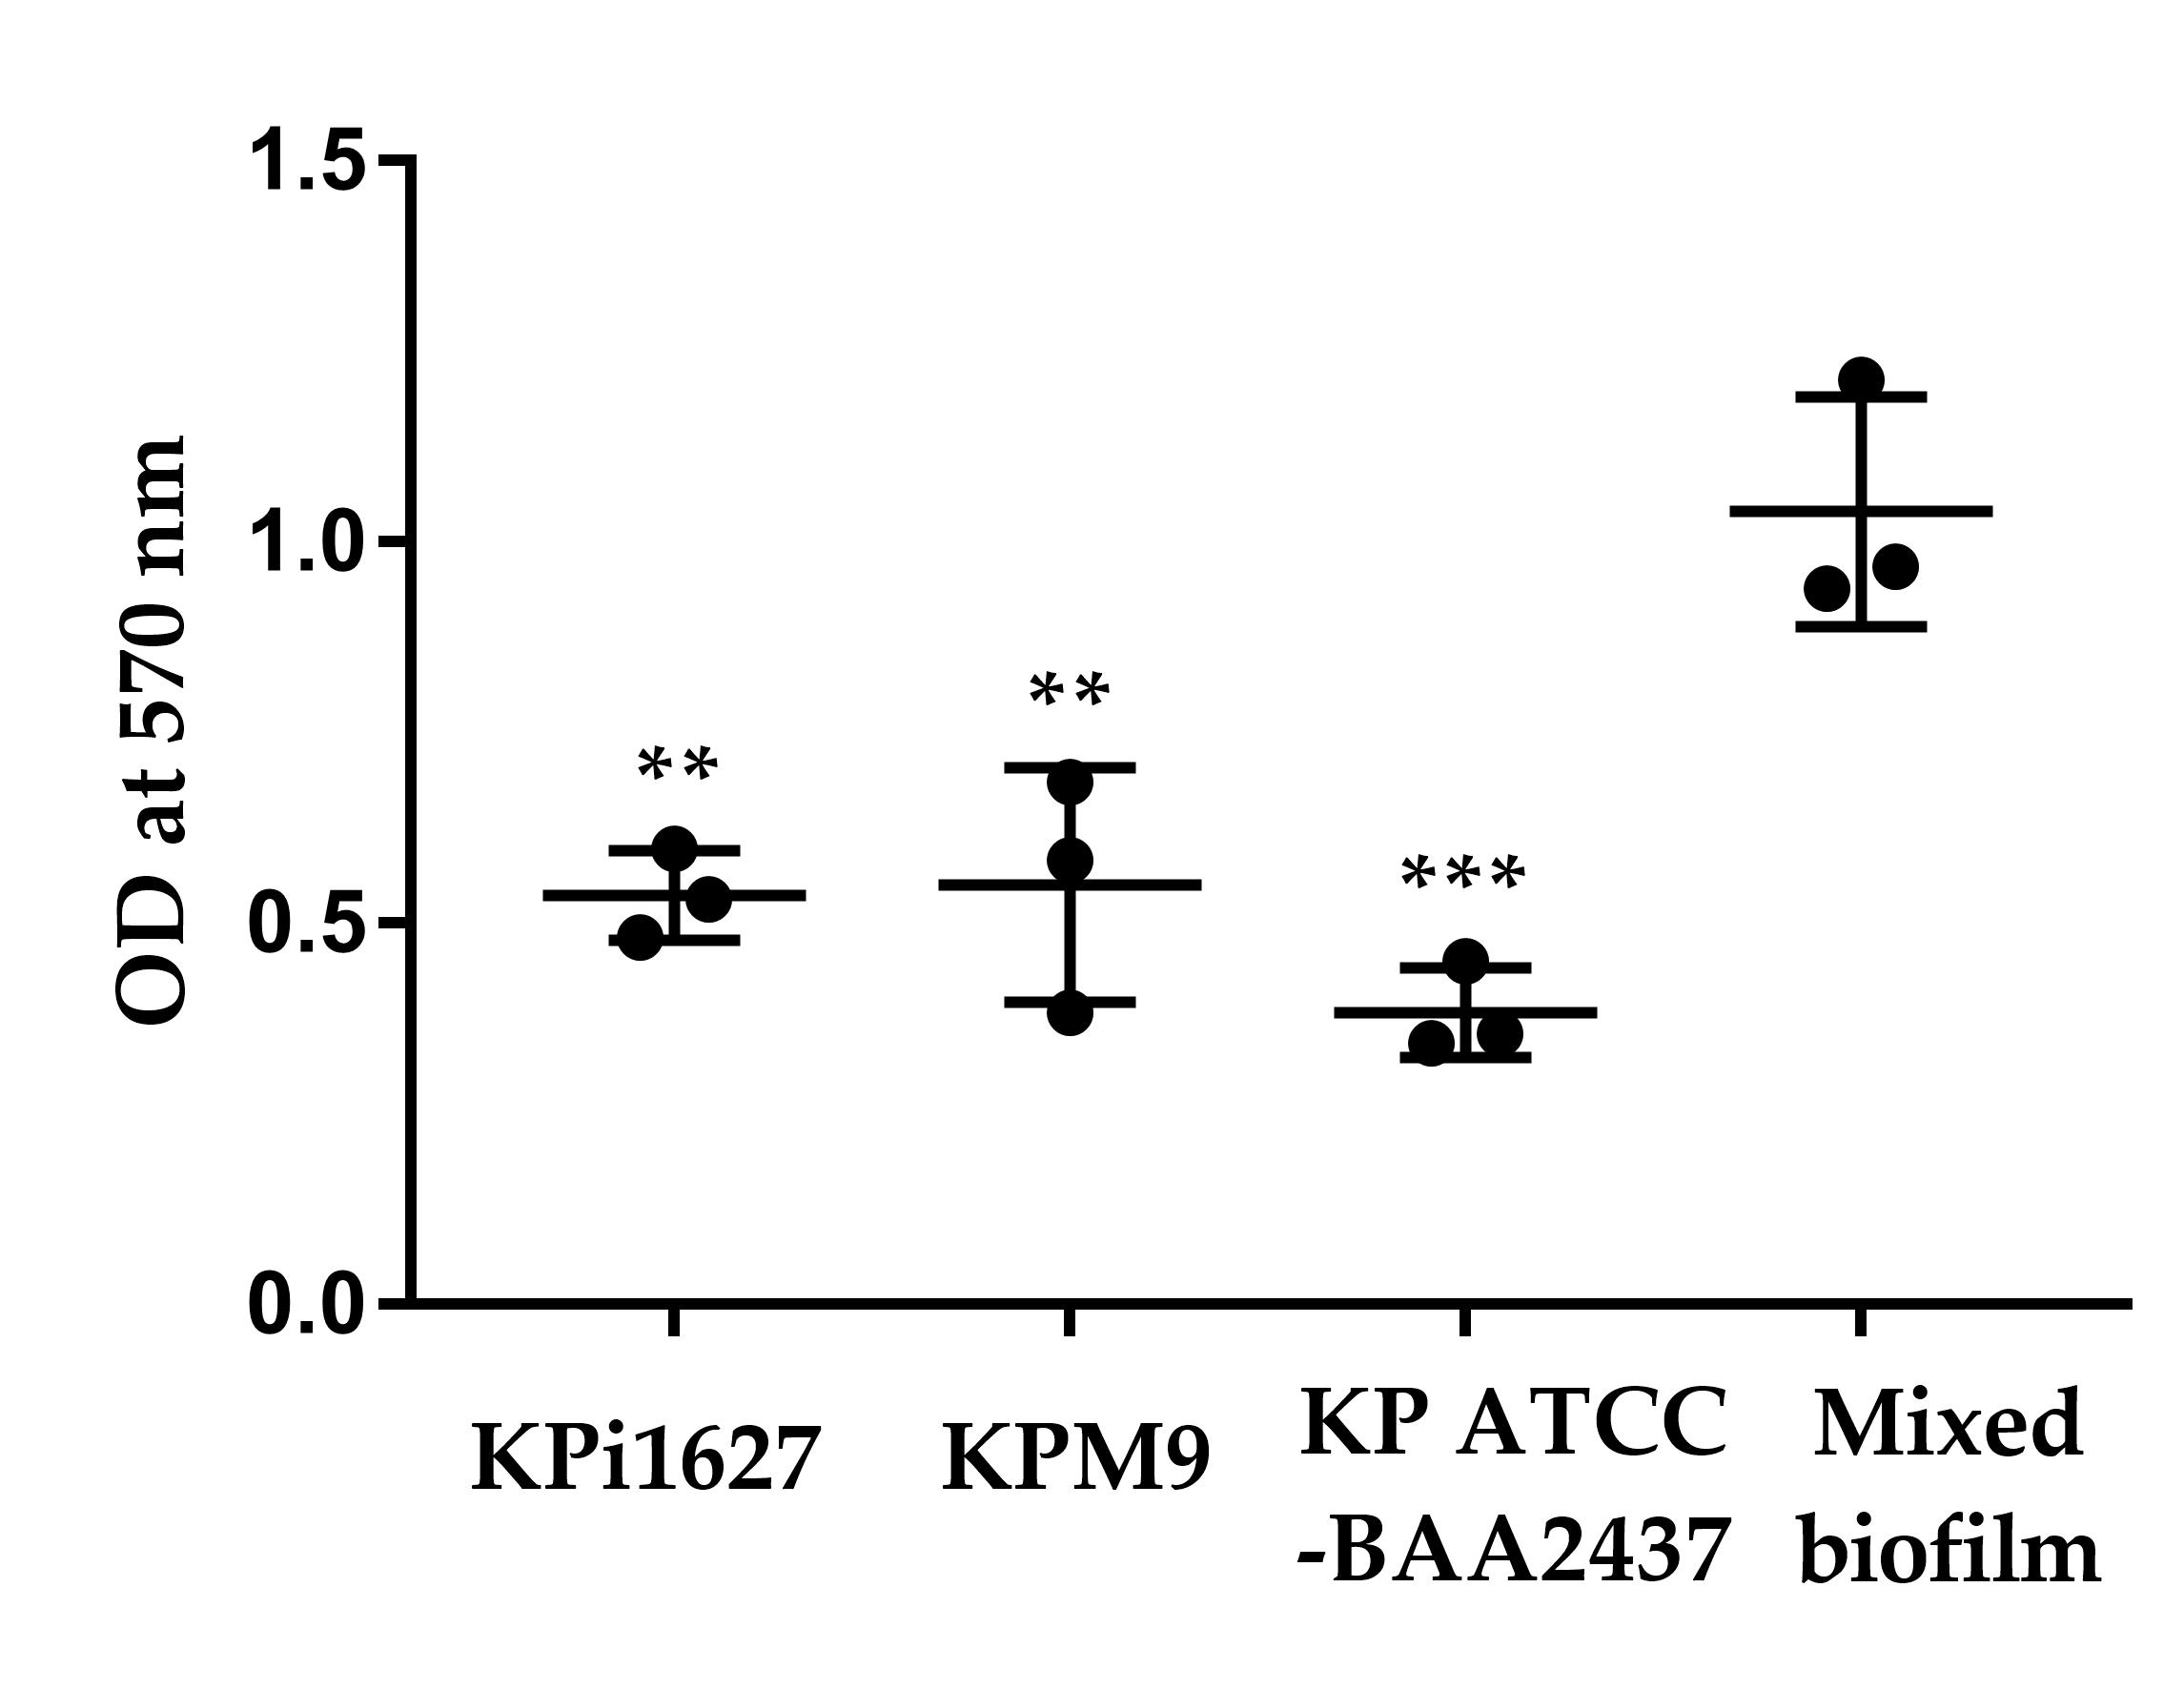
Figure 9. Quantitation of biofilm formation by hypervirulent K. pneumoniae (hvKp) strains on 96-well plates (static conditions) after 24 h. Biofilm formation (BF) was measured by the crystal violet assay at 570 nm (OD570). Biofilm establishment by each isolate was scored as either strong (BF ≥ 0.300), moderate (BF = 0.200–0.299), weak (BF = 0.100–0.199), or negative (BF < 0.100). Data were analyzed by one-way ANOVA with Tukey’s multiple comparisons test. Data is shown as mean ± STD. **p = 0.003, ****p < 0.0005 for a comparison between different bacterial strains (Kpi1627, KPM9, and Kp ATCC-BAA2437) with the mixed biofilm.
J. Activity of AWME3 on biofilm formation (see Figures 10–11)
1. Grow bacterial cultures to mid-logarithmic phase, corresponding to an optical density (OD600) of 0.5 ± 0.05.
2. Harvest cells by centrifugation and wash three times with 5 mL of sterile PBS (pH 7.4) to remove residual media components.
3. Adjust cultures to 106 CFU/mL of suspension in PBS.
4. Perform a 2-fold serial dilution of AWME3 2 mg/mL in a 96-well microplate by adding 100 μL of the sample into wells already containing 100 μL of LB broth to the following final concentrations: 1, 0.5, 0.25, and 0.125 mg/mL of AWME3.
5. Add 200 μL of LB broth to the 96-well microplate in triplicate as the negative control.
6. Add 100 μL of bacterial suspension to each well (except the blank) and then incubate at 37 °C for 24 h without shaking.
7. Remove planktonic cells by washing with 200 μL of PBS (pH 7.2) three times, followed by drying at 37 °C for 40 min.
8. Add 125 μL of 1.5% CV solution to each well and incubate at room temperature for 15 min.
9. Wash the 96-well microplate three times with distilled water to remove excess stain, followed by drying at 60 °C for 1 h.
10. Add 125 μL of 30% acetic acid to each well and then incubate at room temperature for 10 min with shaking at 400 rpm.
11. Measure the absorbance at 550 nm at room temperature.
12. Perform all tests in triplicate and repeat them three times.
13. Calculate the percentage of biofilm inhibition using the following formula: % biofilm inhibition = [ODcontrol - OD treated /ODcontrol] × 100.
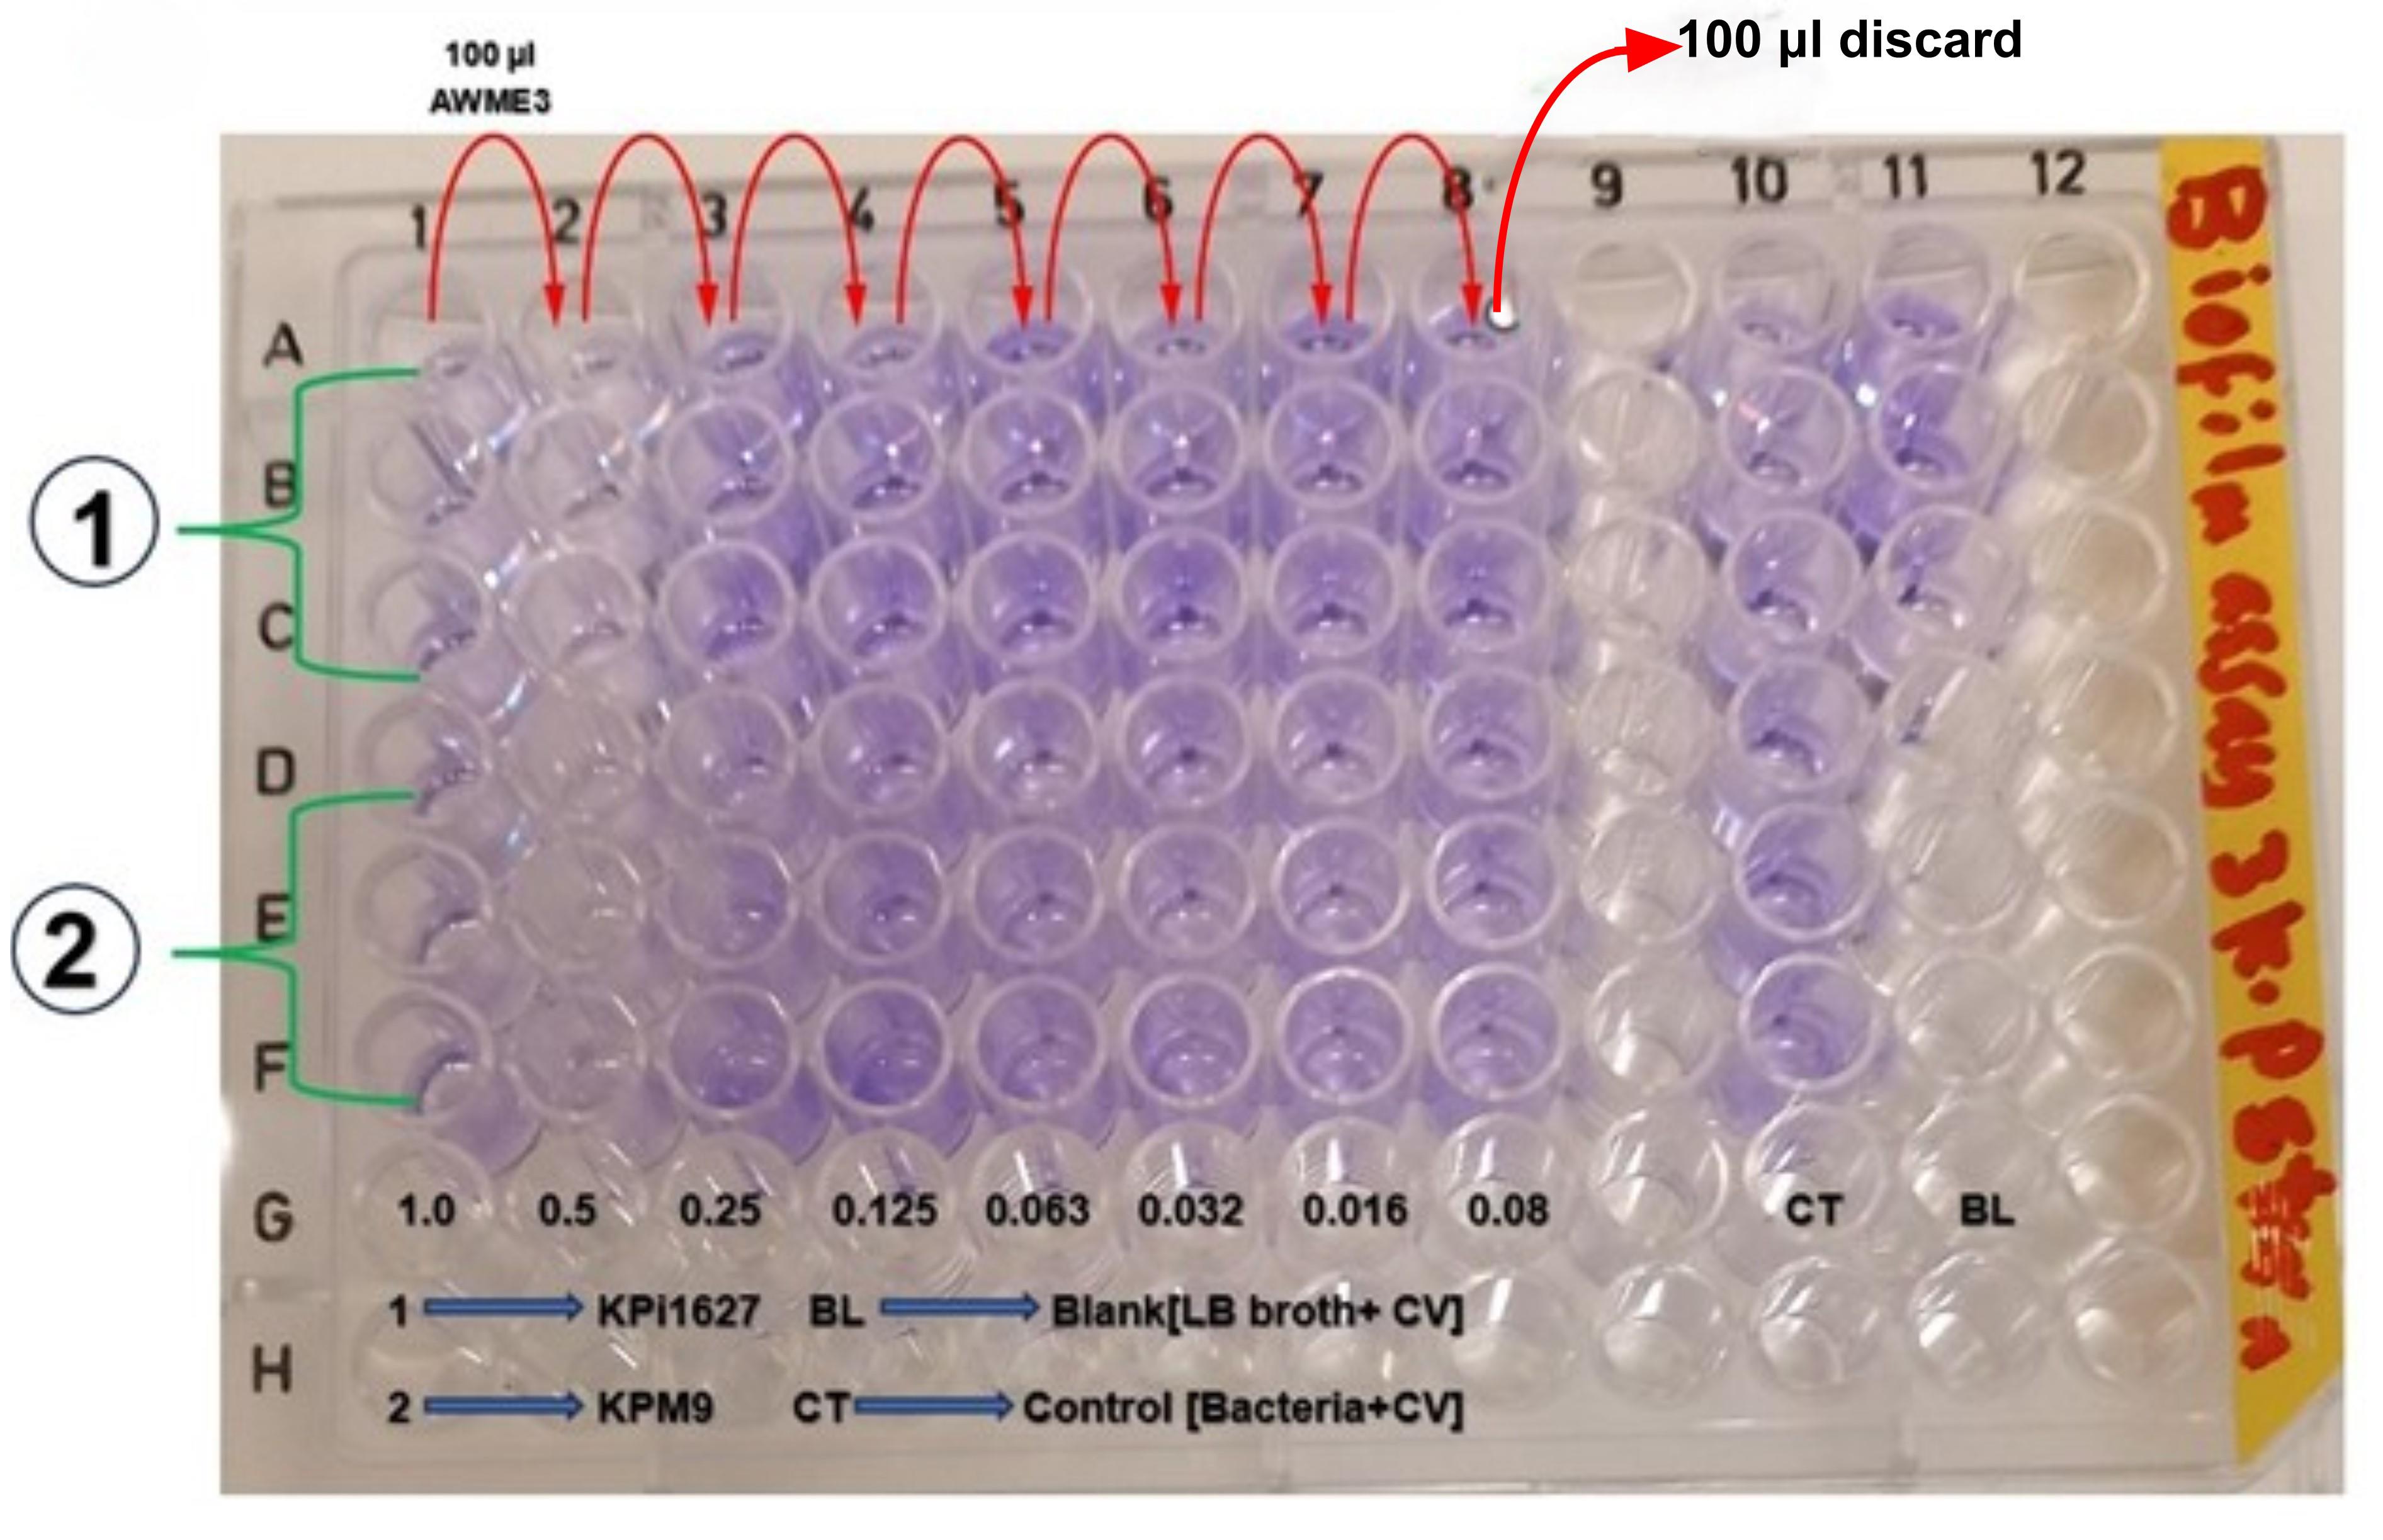
Figure 10. Schematic layout of a 96-well microplate to evaluate the activity of AWME3 on biofilms formed by K. pneumoniae strains after 24 h incubation. Column 10 represents the control group, while column 11 is the blank. 100 μL of LB broth is added to columns 1–8, and 100 μL of AWME3 extract at various final concentrations (0.08–1.0 mg/mL) is added and serially diluted across columns 1–8. Then, 100 μL bacterial suspension is added to each well (except column 11). After incubation for 24 h without shaking, biofilm disruption is evaluated by adding 125 μL of 1.5% CV solution to each well, followed by 125 μL of acetic acid. Plates are then incubated for 10 min at room temperature. Absorbance is measured at OD550 nm. All experimental conditions were performed in triplicate. Numbers in the rows correspond to the tested K. pneumoniae strains: (1) Kpi1627 and (2) ATCC BAA-2473.
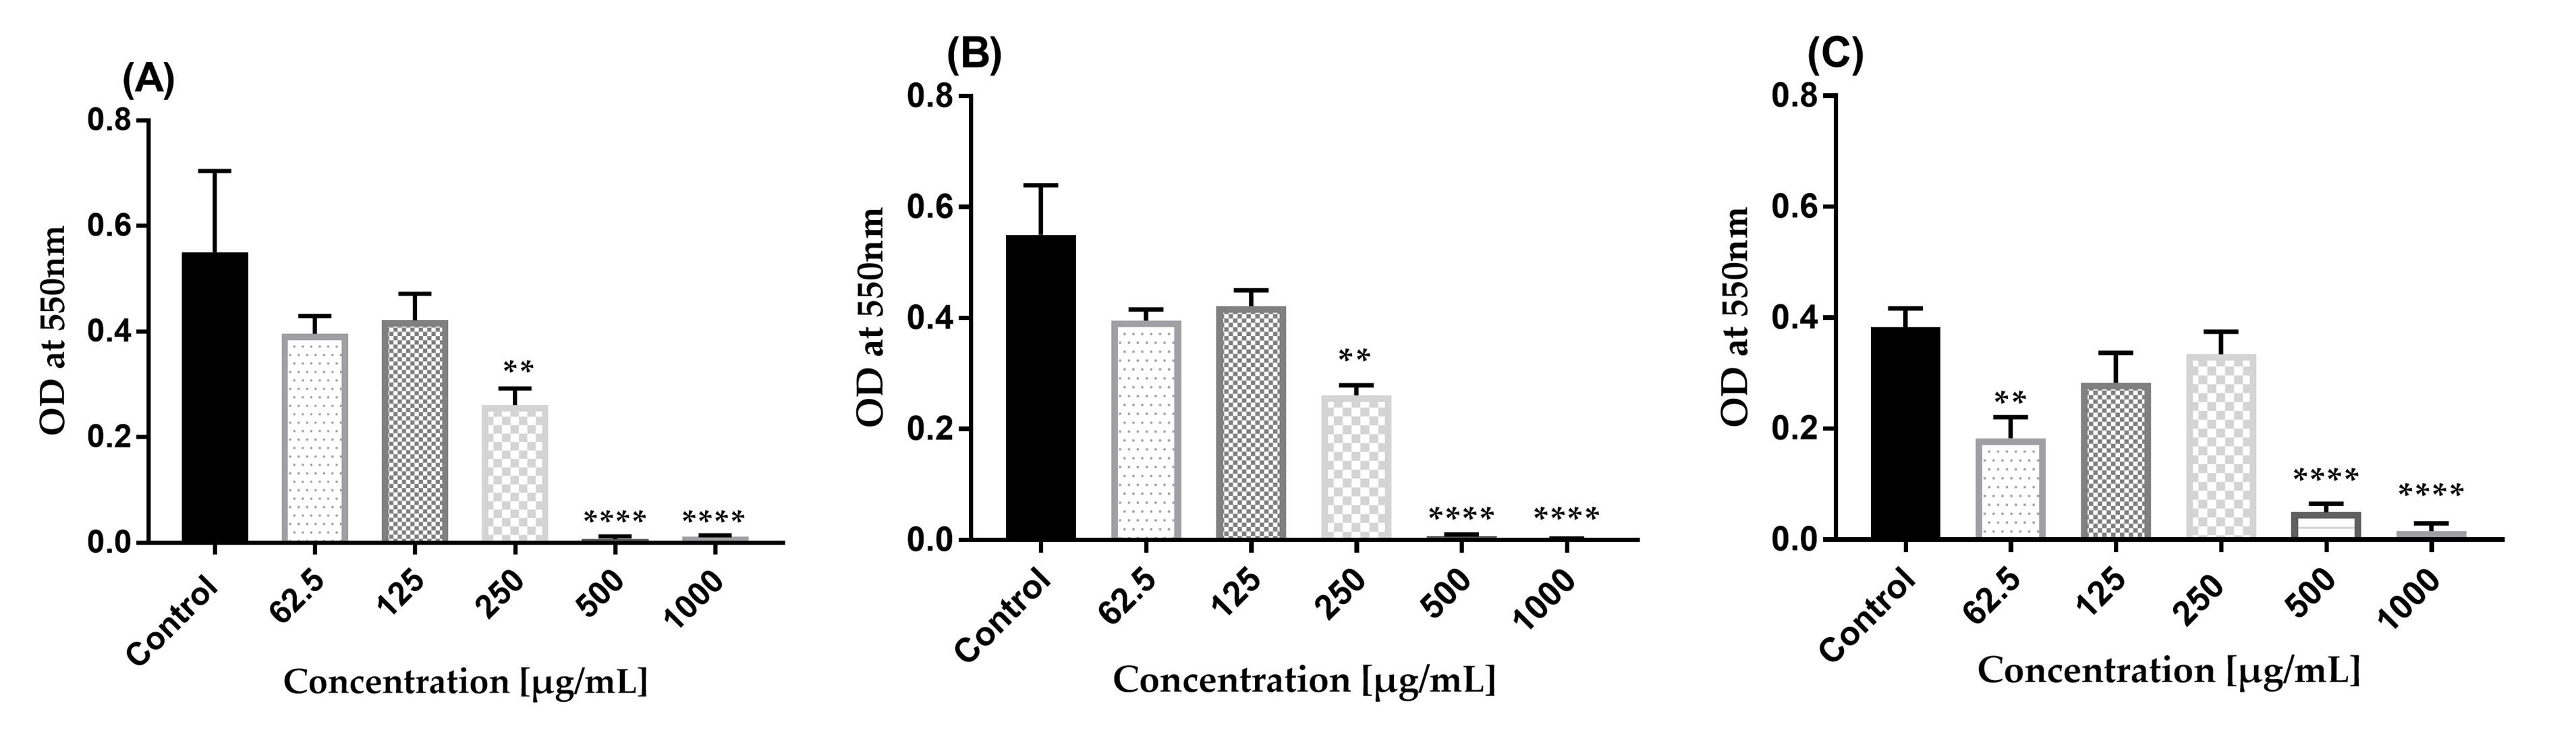
Figure 11. Effect of AWME3 against established biofilms of K. pneumoniae. (A) Kpi1627, (B) KPM9, and (C) Kp ATCC BAA-2473 strains. Data is shown as mean ± STDs. Experiments were performed in triplicate with independent cultures, and statistical significance was examined by one-way ANOVA with Dunnett’s multiple comparison test (**p = 0.001, ****p < 0.0001).
K. AWME3 disruption of mixed biofilms (see Figures 12–13)
1. Grow bacterial cultures to mid-logarithmic phase, corresponding to an optical density (OD600) of 0.5 ± 0.05.
2. Harvest cells by centrifugation and wash three times with 5 mL of sterile PBS (pH 7.4) to remove residual media components.
3. Adjust each strain to 106 CFU/mL density.
4. Prepare the mixed bacterial culture by adding an equal volume (1 mL) of each strain (1:1:1) to the same tube.
5. Prepare AWME3 by a 2-fold dilution in a 96-well microplate to final concentrations in the range of 0.08–1.0 mg/mL.
6. Introduce 0.1 mL of mixed bacteria with suspension 106 CFU/mL to each well of the 96-well microplate.
7. Add 0.1 mL of LB broth as the negative control and 0.1 mL of mixed bacteria without treatment as the positive control in triplicate.
8. Seal the 96-well microplate to prevent evaporation, followed by incubation at 37 °C for 24 h.
9. Remove the planktonic cells in the mixed biofilm during gentle washing with 200 μL of PBS. Dry and stain with 125 μL of 0.1% CV solution and incubate at room temperature for 15 min.
10. Remove the excess stain, rinse the wells with distilled water, dry, and add 125 μL of 30% acetic acid to each well to dissolve the mixed biofilm. Then, incubate at room temperature for 10 min with shaking at 400 rpm and measure the absorbance at 570 nm at room temperature.
11. Calculate the % of inhibition of the mixed biofilm using the following formula: % mixed biofilm reduction [ODcontrol - ODassay/ODcontrol] × 100.
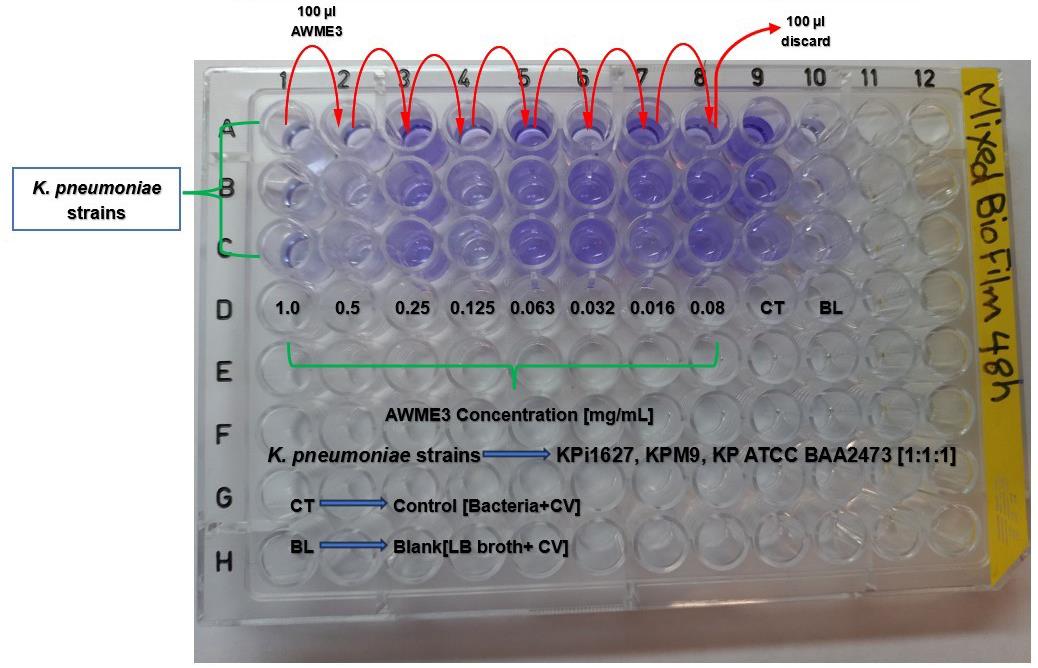
Figure 12. Schematic layout of a microplate showing that AWME3 extract disrupts mixed biofilm established by three different K. pneumoniae strains after 48 h incubation. Columns 1–8 contain serially diluted AWME3 at final concentrations ranging from 0.08 to 1 mg/mL, while columns 9 and 10 serve as the untreated control and blank, respectively. Mixed bacterial strains are added to all wells except blanks. After incubation for 48 h without shaking, biofilm disruption is assessed by staining with 0.1% crystal violet solution, followed by solubilization with 30% acetic acid. Absorbance is measured at OD570 nm. All experimental conditions are performed in triplicate.
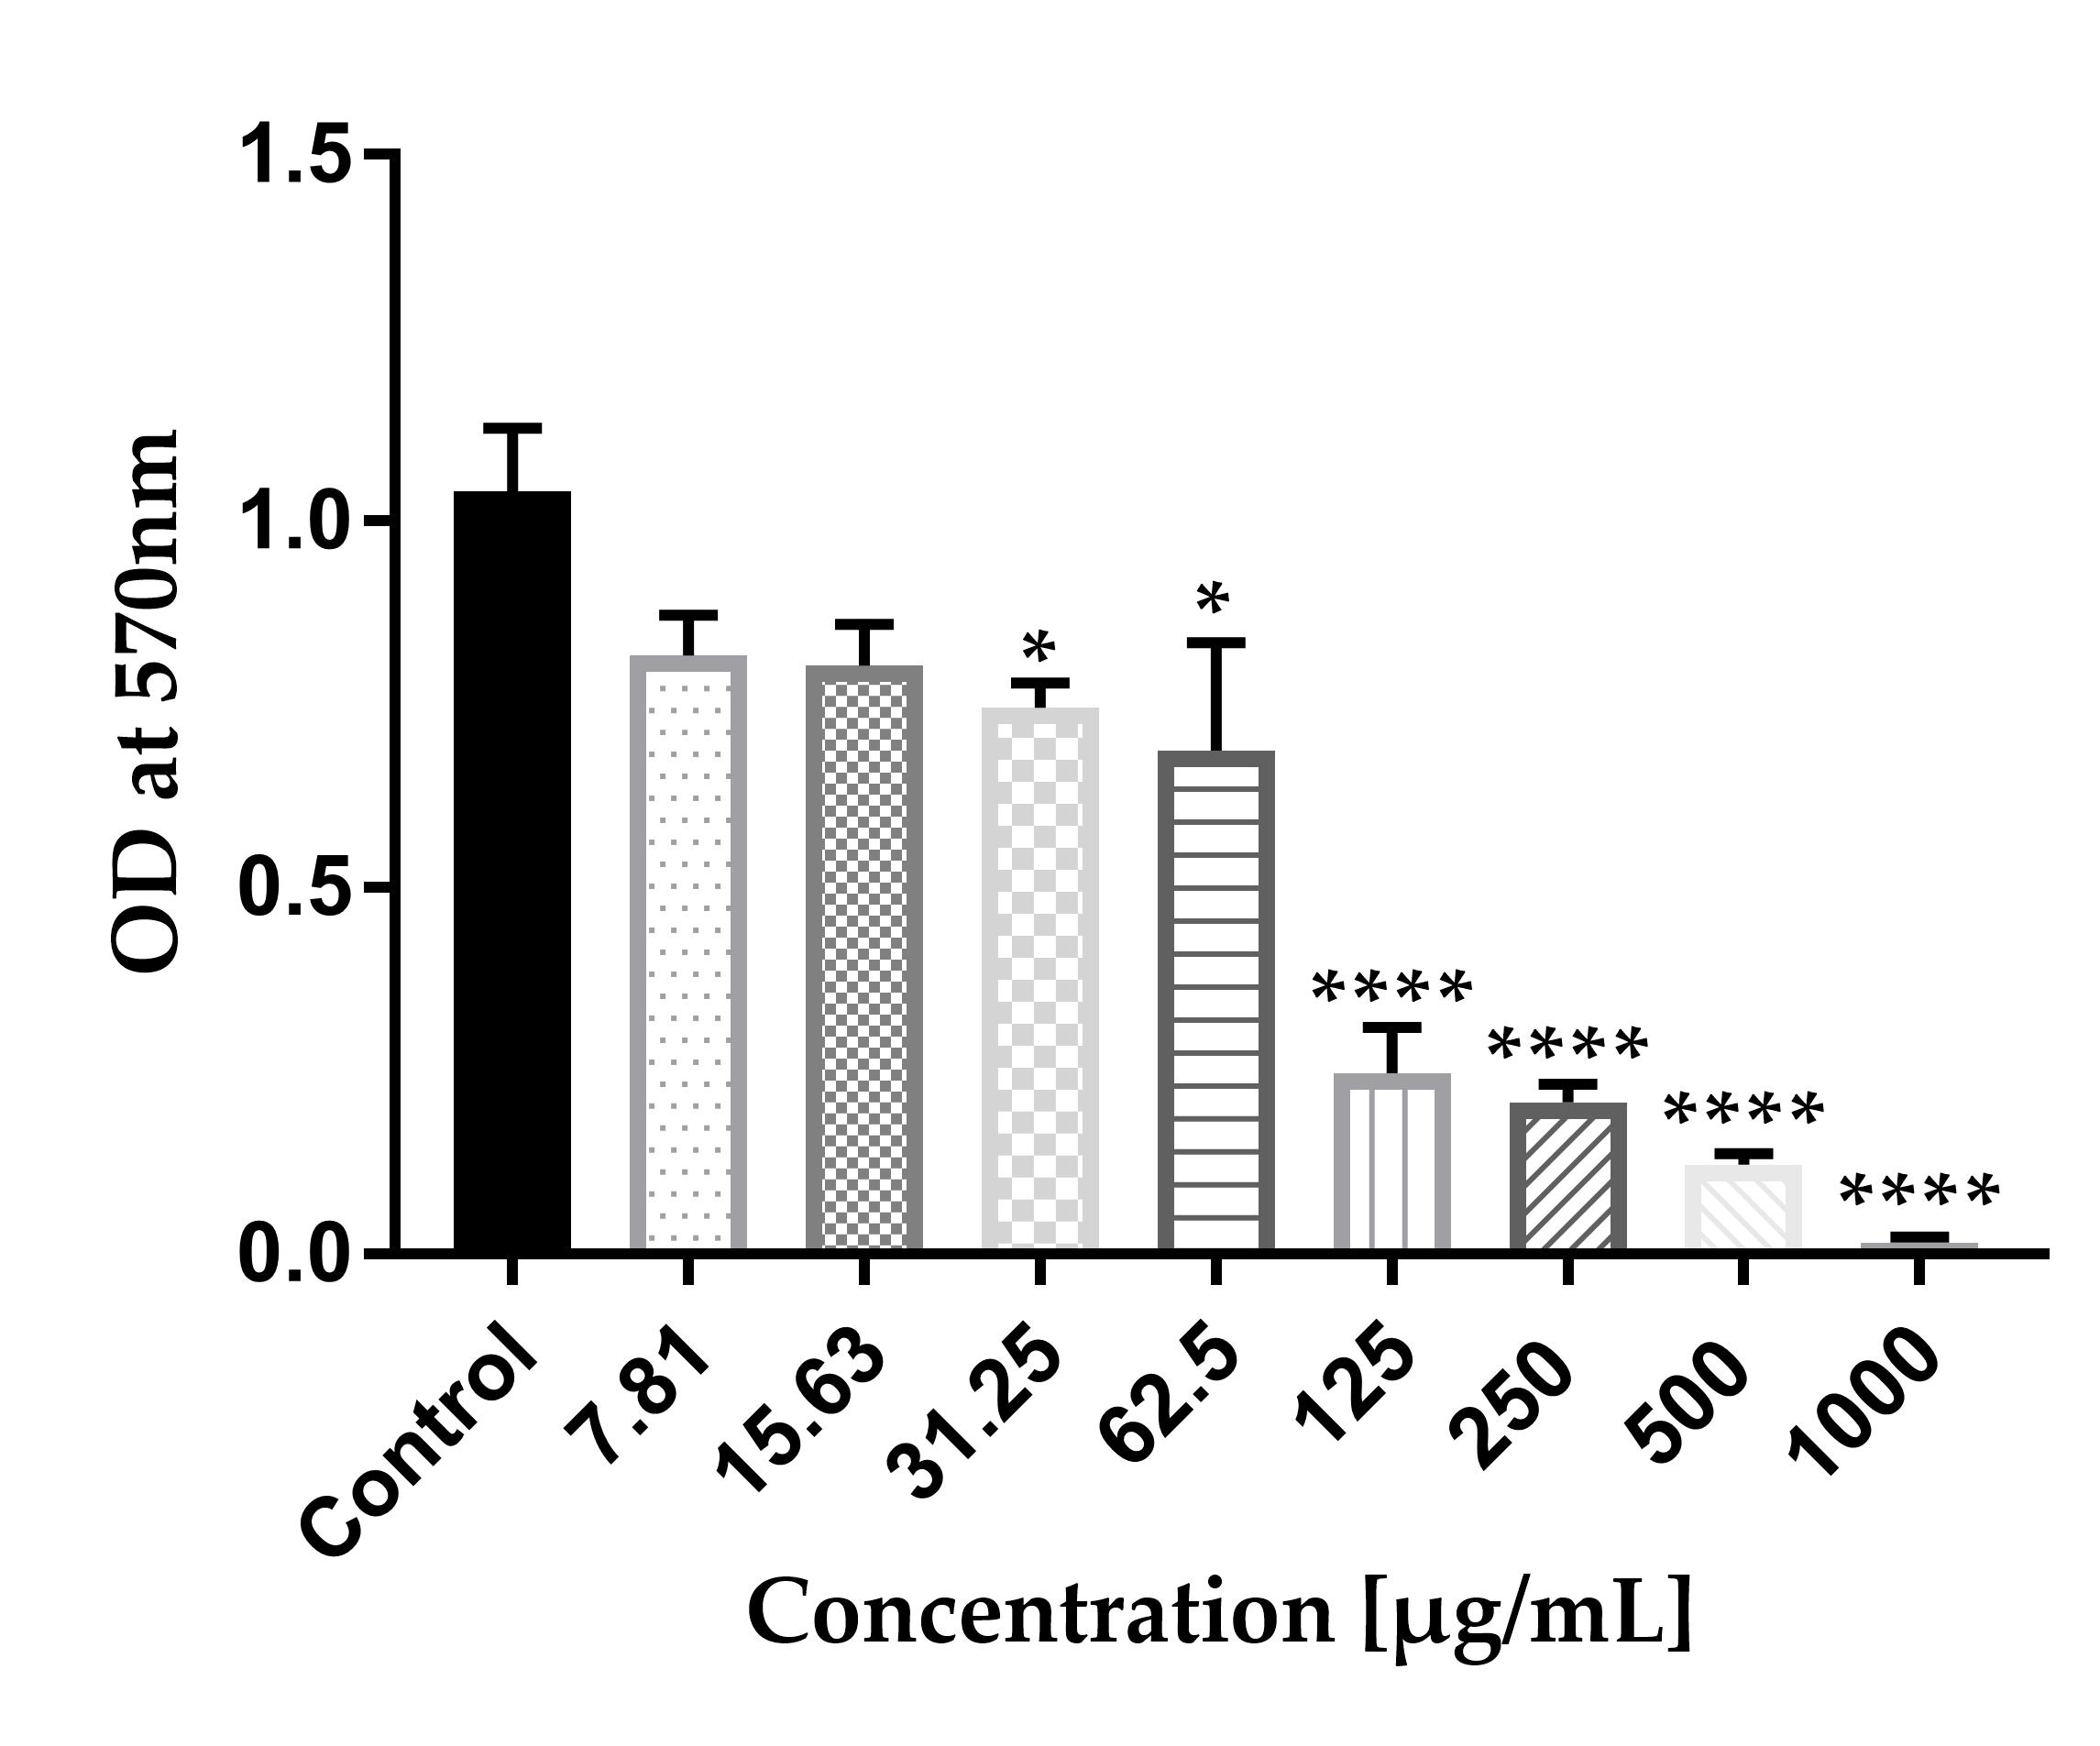
Figure 13. Eradication and inhibition of mixed biofilm growth of three different multi-drug resistant (MDR) K. pneumoniae strains. All tested Kpi1627, KPM9, and KP ATCC-BAA2473 strains were cultured separately in LB broth medium, incubated overnight, washed, pelleted, and mixed together with equal volumes (1:1:1) of bacterial suspension (OD600 ~0.1) in a 96-well plate. Next, final concentrations of 7.81, 15.63, 31.25, 62.5, 125, 250, 500, and 1,000 μg/mL of AWME3 were serially diluted in a 2-fold dilution in LB broth. Then, an aliquot of 100 μL of mixed bacteria strains was added and mixed with AWME3. Microtiter plates were sealed and then incubated without shaking at 37 °C for 48 h. The dose-response inhibition is demonstrated by the crystal violet assay. AWME3 shows the inhibition of the mixed biofilms in a dose-response manner. Results are represented by mean ± STD of three independent experiments. Data were analyzed by one-way ANOVA test with Dunnett’s multiple comparison test (*p = 0.010, ****p < 0.0001).
L. Minimal inhibitory biofilm concentration (MIBC) assay
Note: The MIBC assay is performed by the microdilution method.
1. Grow bacterial cultures to mid-logarithmic phase, corresponding to an optical density (OD600) of 0.5 ± 0.05.
2. Harvest cells by centrifugation and wash three times with 5 mL of sterile PBS (pH 7.4) to remove residual media components.
3. Adjust all K. pneumoniae strain suspensions to 1 × 10⁶ CFU/mL.
4. Prepare final concentrations of 1,000, 500, 250, 125, 62.5, 31.25, 16.53, and 7.81 µg/mL of AWME3 via two-fold serial dilution in LB broth. Subsequently, add 100 µL aliquots of the tested bacterial strains prepared in LB broth and mixed with the AWME3 solution.
5. Seal and cover all 96-well microplates with adhesive film to avoid evaporation. After 2 h of incubation, carefully remove the unattached cells and wash the 96-well microplates twice with 200 μL of PBS. Dry at 60 °C for 20 min.
6. Stain the attached biofilms with 125 μL of 1% CV solution and incubate them for 10 min at room temperature.
7. Remove the CV completely from the 96-well microplates and wash three times with 200 μL of PBS. Dry at 65 °C for 60 min.
8. Rinse the 96-well microplates with distilled water and dry at 65 °C for 30 min.
9. Add 125 μL of 30% acetic acid to each well to dissolve the biofilm-bound dye.
10. Measure the optical density at 570 nm (OD570) using a CLARIOstar® Plus multimodal plate reader.
Note: The minimum inhibitory biofilm concentration (MIBC) is defined as the lowest concentration of AWME3 that can inhibit the bacterial biofilm in OD570 compared with the positive growth control (bacteria only). When more than one concentration produces a similar 3-fold reduction, the lowest concentration meeting this criterion is recorded as the MIBC. If no concentration achieves a 3-fold decrease, the MIBC is reported as the lowest concentration that produces a statistically significant reduction (P < 0.05) in OD570 relative to the positive control.
M. Minimum eradication biofilm concentration (MEBC) assay
Note: The MEBC is determined based on the MIBC assay.
1. Grow bacterial cultures to mid-logarithmic phase, corresponding to an optical density (OD600) of 0.5 ± 0.05.
2. Harvest cells by centrifugation and wash three times with 5 mL of sterile PBS (pH 7.4) to remove residual media components.
3. Perform the MBEC assay in sterile 96-well microplates. Then, add 100 μL of K. pneumoniae suspension (1 × 10⁸ CFU/mL grown in LB) to each well, followed by 100 μL of AWME3 that was diluted in AWME3 to a final concentration of 0.08–1 mg/mL.
4. Incubate the 96-microplates at 37 °C under static conditions for 24 h.
5. Disturb the bacterial biofilm with the pipette, then pipette 30 μL of each of the MIBC, 2 MIBC, and 4 MIBC onto the sterile MH agar.
Note: MEBC is identified as the lowest concentration of AWME3 that prevents bacterial biofilm growth.
N. AWME3 activity against mature biofilms (see Figures 14–15)
1. Grow bacterial cultures to mid-logarithmic phase, corresponding to an optical density (OD600) of 0.5 ± 0.05.
2. Harvest cells by centrifugation and wash three times with 5 mL of sterile PBS (pH 7.4) to remove residual media components.
3. Culture all tested strains in LB broth for 72 h at 37 °C to form mature biofilms in 96-well microplates.
4. Discard the LB media gently.
5. Wash all wells with 200 μL of PBS to remove loosely adhered cells.
6. Add freshly prepared 100 μL of LB broth to each well.
7. Perform two-fold serial dilutions of 2 mg/mL AWME3 in LB broth after adding 100 µL of bacterial inoculum (1 × 10⁶ CFU/mL). Final concentrations should be 1, 0.5, 0.25, 0.125, 0.063, 0.032, 0.016, and 0.008 mg/mL. Incubate for 24 h at 37 °C (static). Each 96-well plate must include negative and positive controls in triplicate.
9. Wash the wells of the 96-well microplate with sterile 200 μL of PBS to remove the planktonic cells.
10. Stain all 96-well microplates with 0.1% CV solution for 30 min.
11. Remove the stain and gently wash with distilled water.
12. Dry all 96-well microplates at 60 °C for 60 min.
13. Dissolve all remaining biofilm-bound dye with 200 μL of 30% acetic acid.
14. Measure all 96-well microplates at OD570 using a CLARIOstar microplate reader.
15. Calculate the percentage (%) of disrupted biofilm with respect to the control group.
16. Determine the MEBC values of AWME3 and doxycycline by counting formed colonies (CFU/mL).
17. To calculate CFU/mL, scrape the treated biofilms and resuspend them in PBS. Serially dilute the suspension, spread 30 µL of each dilution on MH agar, and incubate at 37 °C for 48 h.
Note: MEBC is identified as the lowest concentration of AWME3 or doxycycline that is able to eliminate the bacterial biofilm growth.
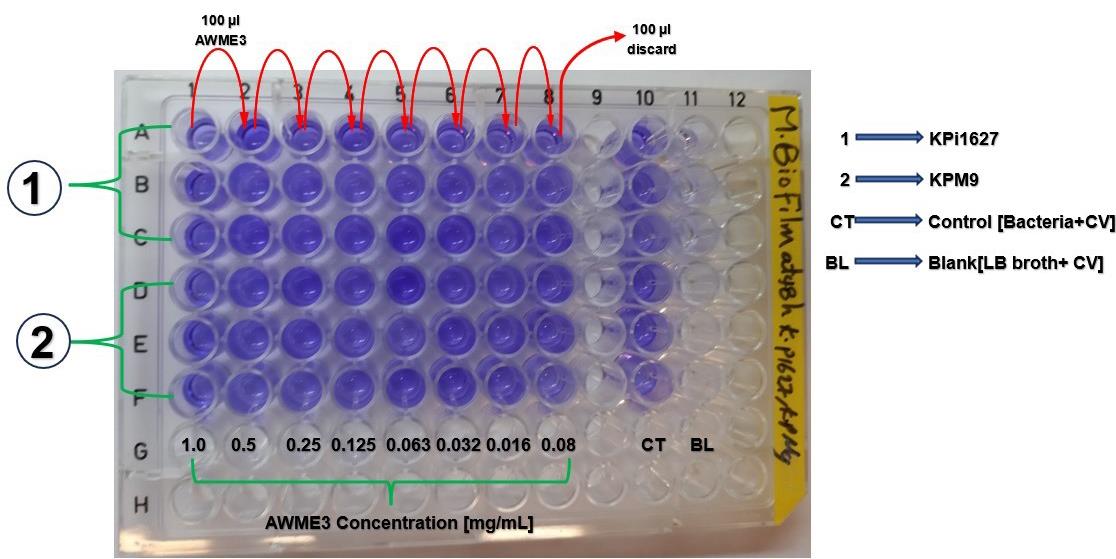
Figure 14. Microplate layout to assess the influence of AWME3 extract on mature biofilms established by three different K. pneumoniae strains after 48 h incubation. Columns 1–8 contain serially diluted AWME3 (0.08–1 mg/mL), and columns 10 and 11 serve as the untreated control and blank, respectively. Bacterial strain KPM9 prepared in LB broth is added to columns 1–8 and 10, except the blanks. After 48 h of incubation at 37 °C without shaking, biofilms are stained with 0.1% crystal violet solution, solubilized with 30% acetic acid, and quantified by measuring absorbance at OD570 nm. All conditions are performed in triplicate.
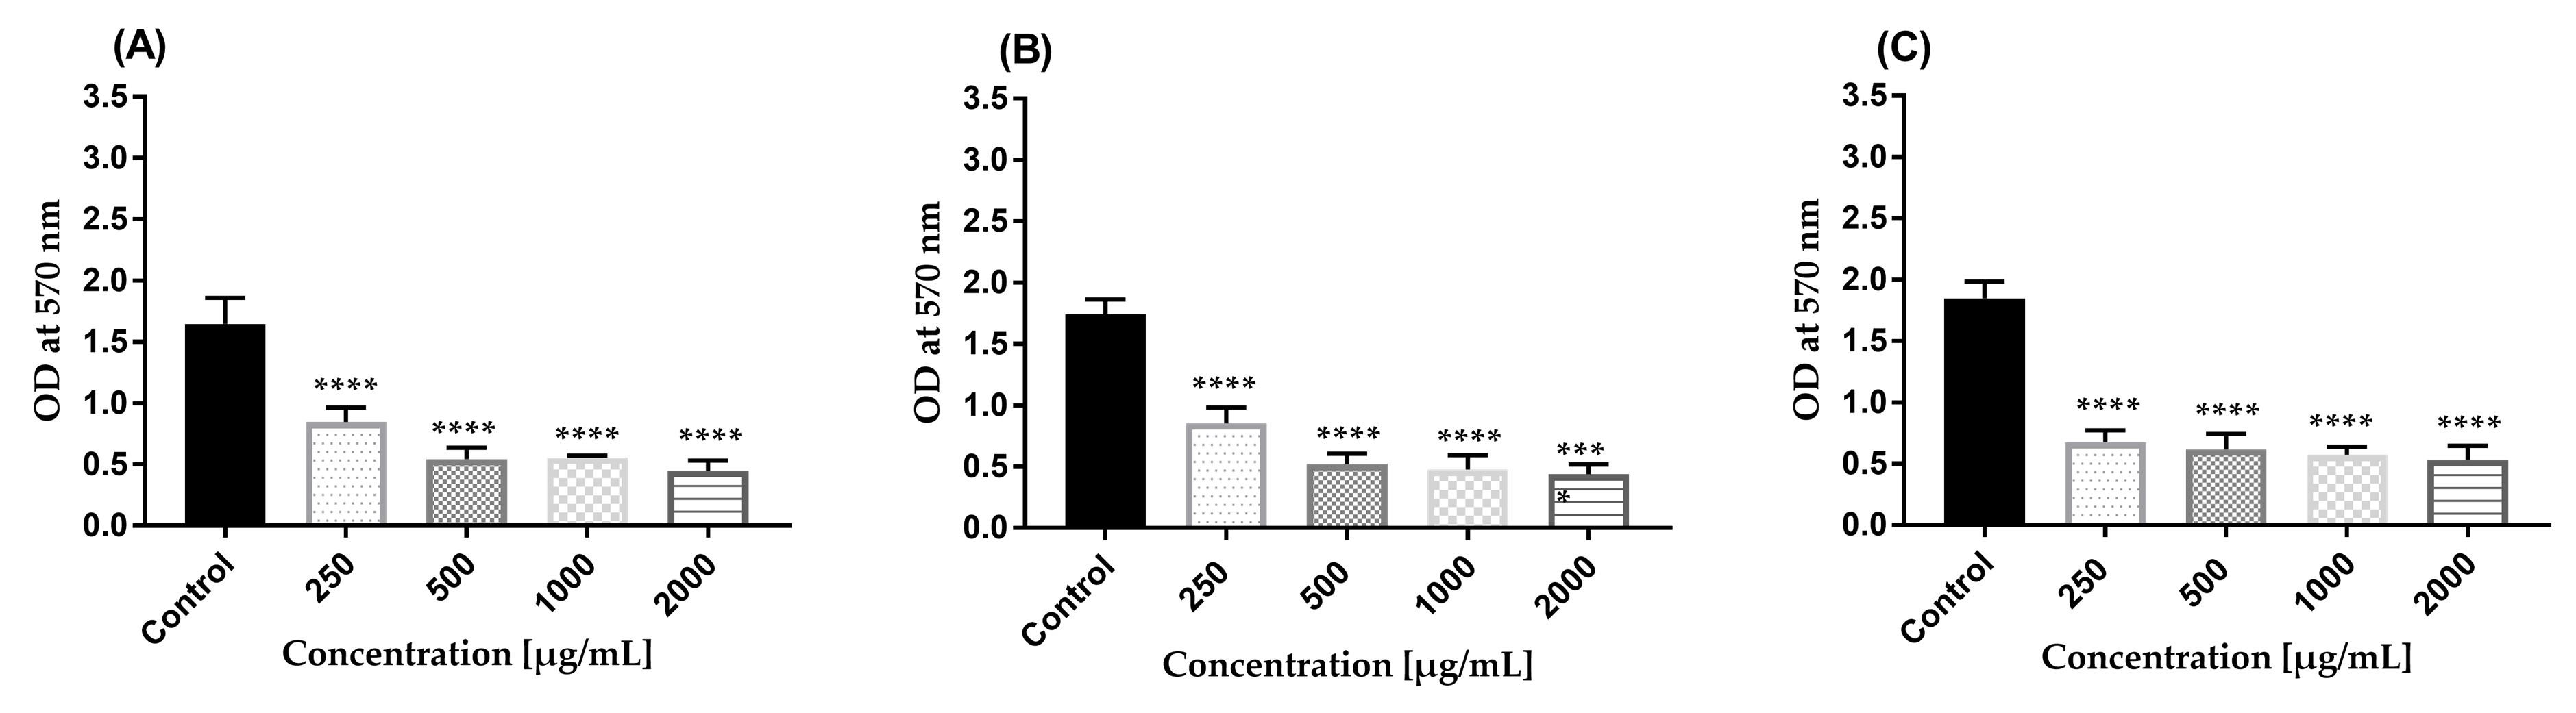
Figure 15. Effect of AWME3 on mature biofilms established by K. pneumoniae strains. (A) Kpi1627, (B) KPM9, and (C) Kp ATCC BAA-2473. The remaining biofilm mass was stained using crystal violet (CV) dye and quantified at 570 nm. Results are represented as mean ± STD of three independent experiments. Statistical significance was calculated using one-way ANOVA with Dunnett’s multiple comparison test (****p < 0.0001).
O. Virulence factor analysis (motility assays)
Note: There are three types of motility assays: swarming, swimming, and twitching motility, as shown in Figures 16 and 17.
O1. Swarming motility
1. Culture all K. pneumoniae strains in LB agar with or without sub-MIC of AWME3 for 24 h at 30 °C.
2. Prepare swarming agar plates (see Recipes).
3. Equilibrate the prepared medium to room temperature.
4. Inoculate 10 μL of each strain of K. pneumoniae containing 108 CFU/mL in the presence and absence (control) of sub-MIC of AWME3 at the center of the agar plate.
5. Incubate plates without inversion for 24 h at 30 °C.
6. Measure the swarming motility in millimeters from the center to the end of growth.
O2. Swimming motility
1. Seed all tested K. pneumoniae strains on LB agar (Sigma-Aldrich, St. Louis, USA) and incubate at 37 °C for 24 h.
2. Inoculate a single pure colony of each isolate in the presence and absence (control) of 1/2 MIC (0.125 mg/mL) AWME3 on the surface of swimming agar plates (see Recipes) and equilibrate them to room temperature.
3. Incubate all plates without inversion for 24 h at 30 °C. Then measure the swimming motility in millimeters from the center to the end of growth.
O3. Twitching motility
1. Seed all K. pneumoniae strains on LB agar and incubate them at 37 °C for 24 h.
2. Inoculate a single colony of each isolate in the presence and absence (control) of 1/2 MIC AWME3 at the bottom of twitching agar (TSA agar) plates (see Recipes).
3. Invert all plates and incubate them at 37 °C for 24 h.
4. Measure the motility zone by removing the agar carefully and staining with 2% crystal violet for 2 h. Then, determine the nearest distance in millimeters.
5. Determine the growth size of the negative control for each strain by inoculating it in tryptone soy agar under the same conditions, and measure the twitching motility in millimeters from the center to the end of growth that appeared under the agar after staining with CV (prepared in methanol).
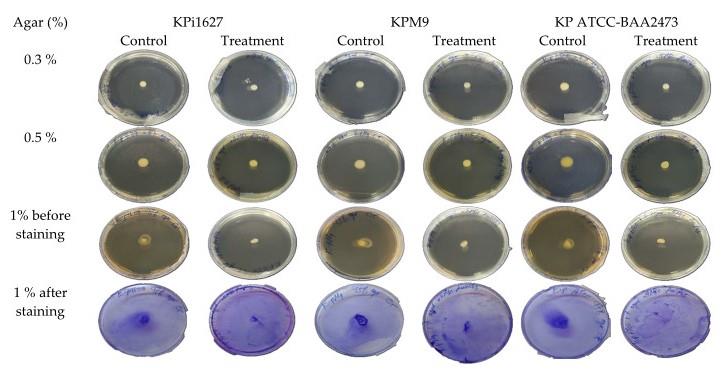
Figure 16. Effect of sub-minimum inhibitory concentration (MIC) of AWME3 on the motility of K. pneumoniae strains. 10 μL of each K. pneumoniae strain was transferred to the plates’ center of swimming (0.3%) and swarming (0.5%) agar plates. Each strain was then injected at the bottom of the twitching (1%) agar plate in the presence of 0.5 MIC (0.125 mg/mL) or absence (control) of AWME3. Twitching agar plates were stained with 2% CV solution to determine the diameter (mm) generated by each strain. Significant shrinkage in diameter size was observed in all three media types for strains subjected to sub-MIC (0.125 mg/mL) of AWME3; this concentration suppressed bacterial movement compared to control groups.
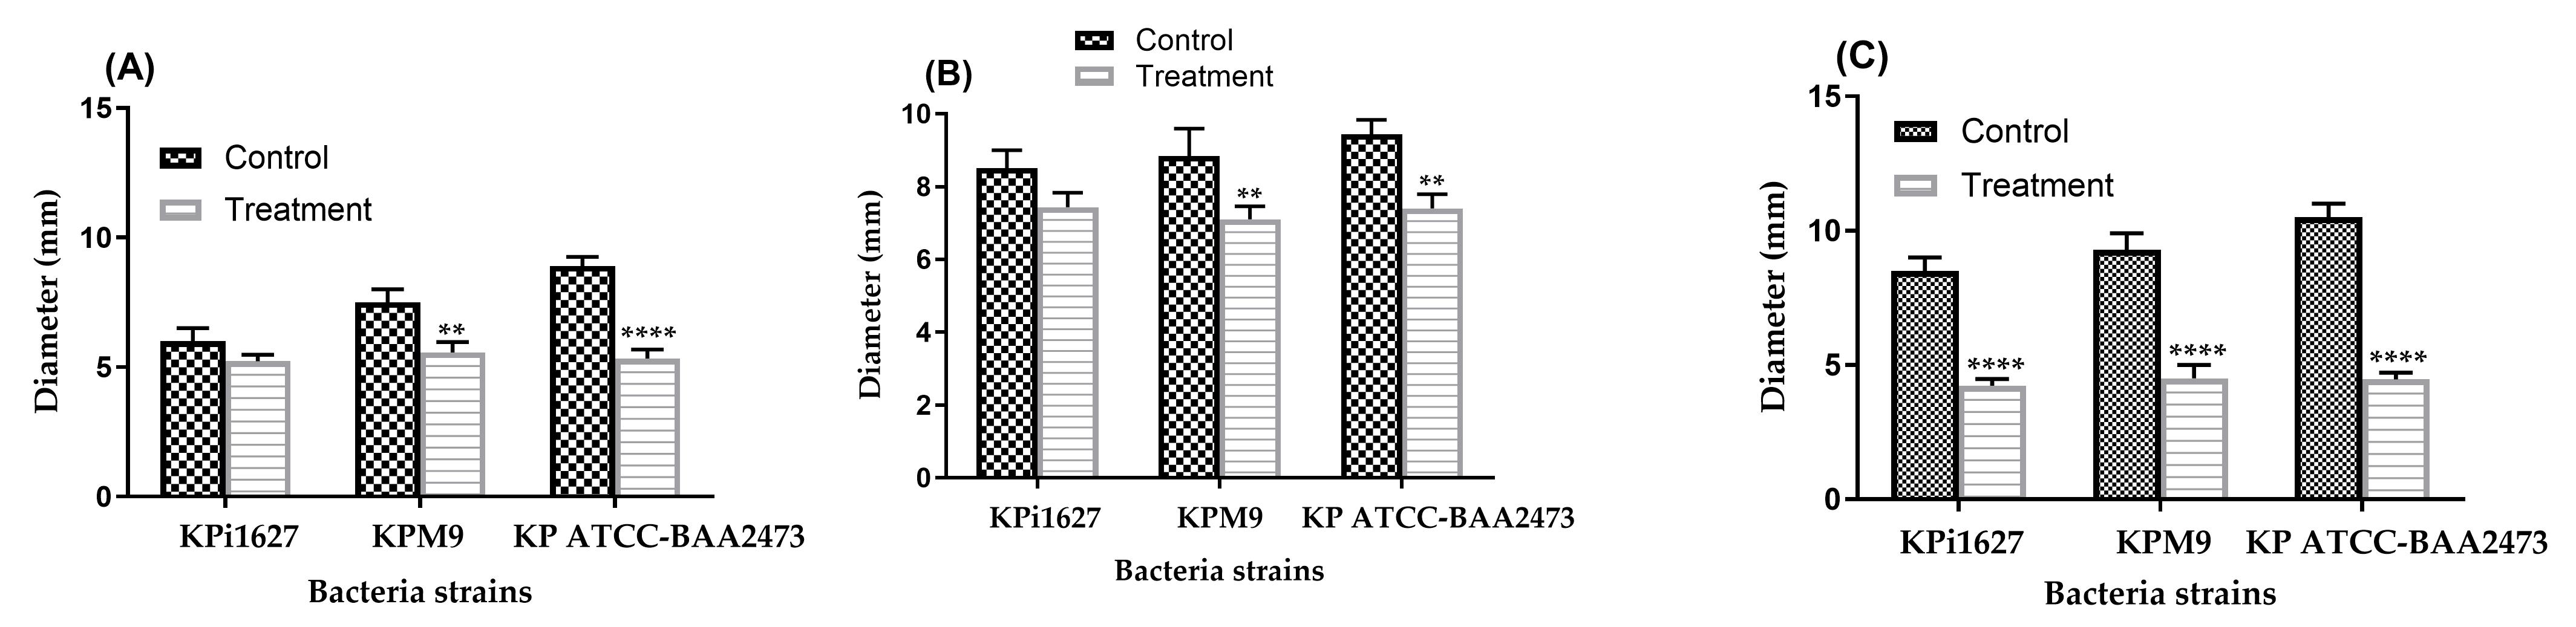
Figure 17. K. pneumoniae strain motility in the absence (control) and presence of AWME3. (A) Mean swimming motility, (B) mean swarming motility, and (C) mean twitching motility of Kpi1627, KPM9, and Kp ATCC-BAA2473 isolates. Data are represented as mean ± SD (n = 3). Data were analyzed by two-way ANOVA, followed by Sidak’s multiple comparisons test (**p = 0.003, ****p < 0.0001).
P. Biofilm visualization via light microscopy
Note: The ability of the AWME3 extract to inhibit biofilm formed by K. pneumoniae ATCC BAA-2473 strain is assessed using a microscopic technique (Figure 18).
1. Grow K. pneumoniae ATCC BAA-2473 strain to the mid-logarithmic phase, corresponding to an optical density (OD600) of 0.5 ± 0.05. Harvest cells by centrifugation at 1,700× g and wash three times with 5 mL of sterile PBS (pH 7.4) to remove residual media components.
2. Grow bacterial biofilms on glass cover slides (1 cm2), which are placed in 6-well polystyrene plates by adjusting aliquots of 1 mL of bacterial culture to 0.2 OD600. Then, dispense it on the cover glass and incubate for 6 h in static conditions at 37 °C.
3. Add 1 mL of AWME3 to each well at final concentrations of 1,000, 500, 250, and 0 μg/mL.
4. Incubate all 6-well polystyrene plates aerobically at 37 °C for 24 h without shaking at static conditions.
5. Empty all 6-well polystyrene plates and wash them with 2 mL of PBS three times to remove planktonic cells. Fix with 90% ethanol for 15 min and dry completely at 30 °C.
6. Stain biofilms with 1% CV solution for 20 min at room temperature.
7. Wash the excess dye with distilled water and dry stained slides at 60 °C for 1 h.
8. Place glass covers (1 cm2) on the slides and observe them at 40× magnification using a light microscope.
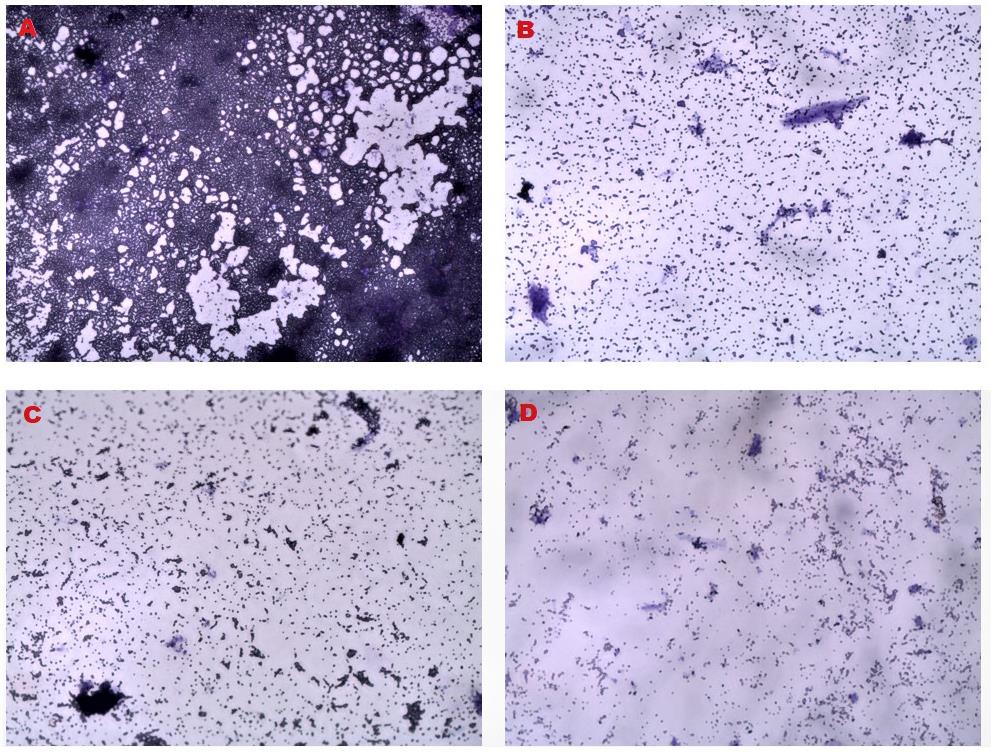
Figure 18. Light microscopy of mature biofilms disrupted by AWME3. (A) Growth control without treatment. (B, C, D) Treated bacteria with AWME3 at concentrations of (B) 0.5 MIC (0.25 mg/mL), (C) MIC (0.5 mg/mL), and (D) 2 MIC (1 mg/mL). 40× magnification.
Q. Fluorescence microscopy
Note: Biofilm architecture in the absence and presence of AWME3 extract is evaluated by fluorescence microscopy analysis (Figure 19).
1. Grow K. pneumoniae ATCC BAA-2473 strain to mid-logarithmic phase, corresponding to an optical density (OD600) of 0.5 ± 0.05.
2. Harvest cells by centrifugation at 1,700× g and wash three times with 5 mL of sterile PBS (pH 7.4) to remove residual media components.
3. Adjust the bacterial suspension to OD600 ~0.4 in PBS.
4. Grow K. pneumoniae ATCC BAA-2473 strains on coverslips (1 cm2) placed in 6-well polystyrene plates by transferring aliquots of 1 mL of the bacterial suspension (OD600 ~0.4) and dispensing it on the cover glass.
5. Add 1 mL of AWME3 to each well at final concentrations of 1,000, 500, 250, and 0 μg/mL.
6. Incubate aerobically at 37 °C for 24 h in static conditions to obtain bacterial biofilms.
7. For the negative control, incubate the untreated bacterial culture under identical conditions.
8. Wash the 6-well plate with 2 mL of PBS three times after discarding the supernatant.
9. Fix with 90% ethanol for 15 min and dry completely at 30 °C.
10. Stain biofilms with 1 mM propidium iodide (PI) solution (see Recipes) for 15 min at room temperature. Wash the excess dye with distilled water.
11. Visualize stained biofilms using a fluorescent microscope equipped with a digital camera.
12. Acquire digital images using the 40× objective. PI (excitation wavelength 543 nm; emission wavelength 617 nm) emits red fluorescence.
13. Analyze all images using Fiji ImageJ software to obtain the mean fluorescence intensities from biofilms.
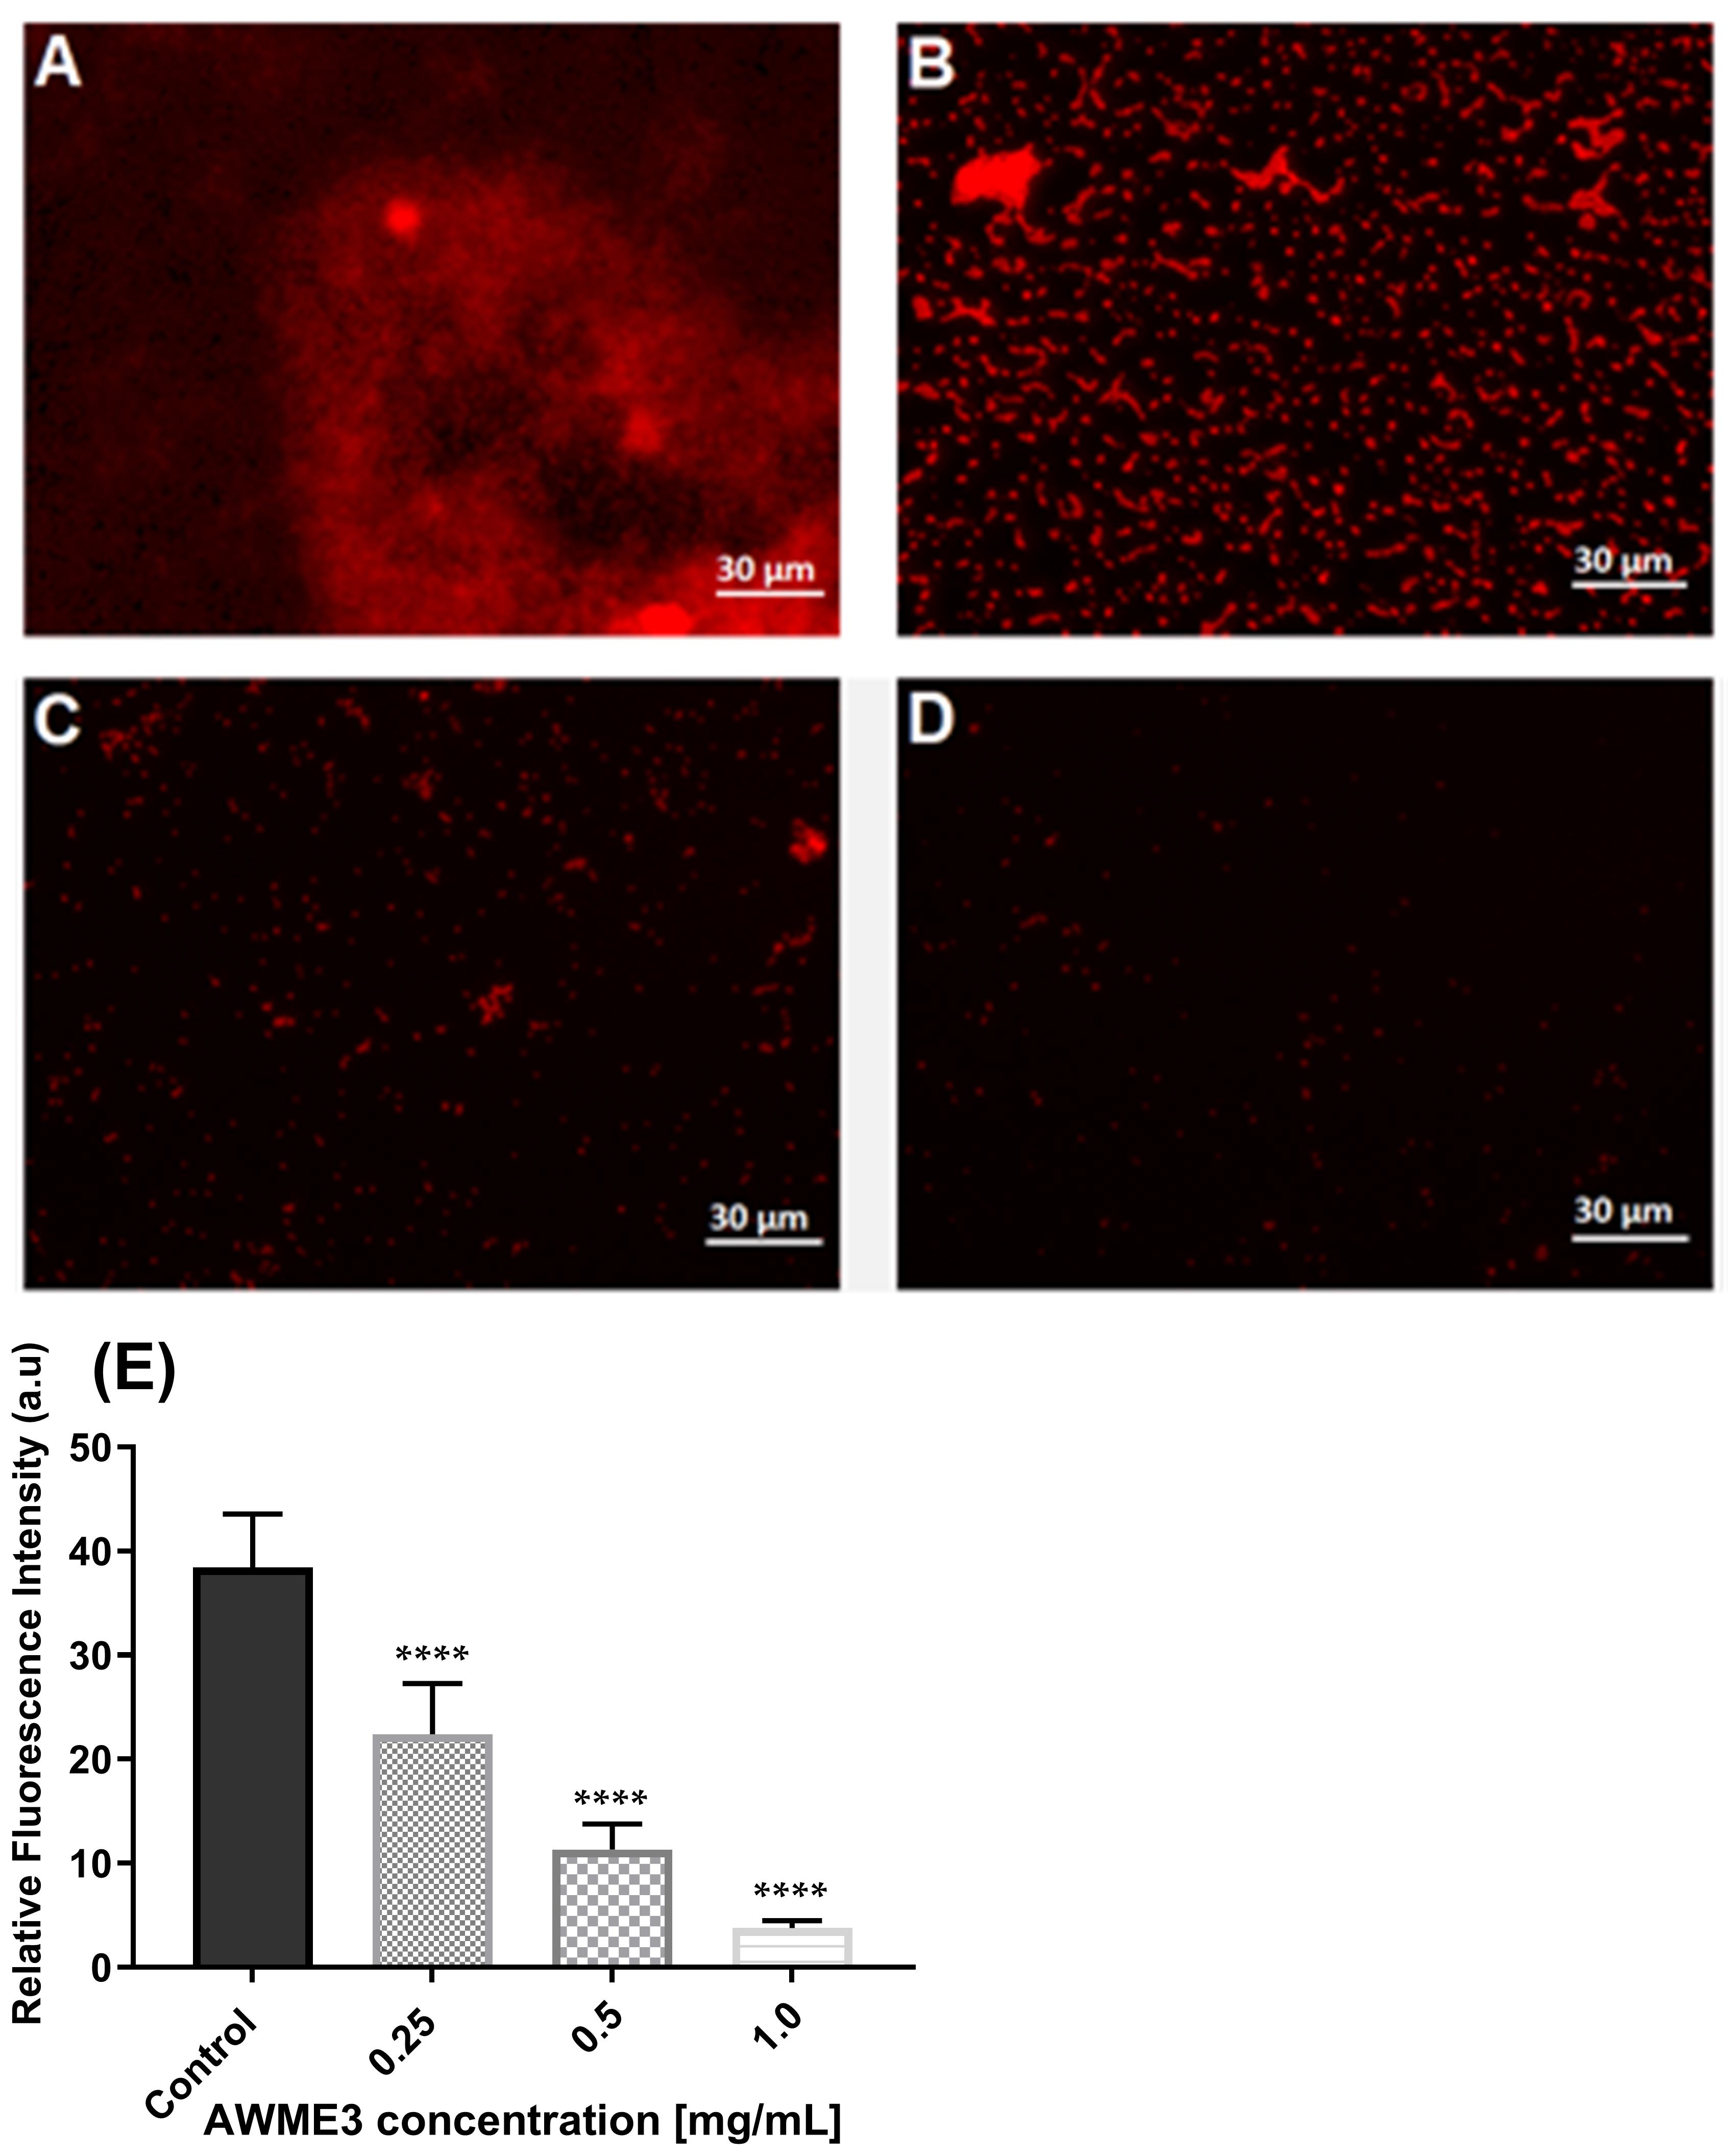
Figure 19. Concentration-related effect of AWME3 on the deposition of extracellular nucleic acids (eNAs) in K. pneumoniae biofilms. (A–D) Fluorescence microscopy representative images of (A) untreated cells (control) biofilm established by Kp ATCC BAA-2473 strain, and the same bacteria treated with (B) 0.5 MIBC (0.25 mg/mL), (C) MIBC (0.5 mg/mL), and (D) 2 MIC (1 mg/mL) of AWME3. PI staining was used to stain eNAs. (E) Relative fluorescence intensity of biofilm structures of the Kp ATCC BAA-2473 strain is reported in arbitrary units (a.u) obtained after quantification of digital images using Fiji ImageJ software. Data are expressed as the mean ± STD. Statistical significance was calculated using ordinary one-way ANOVA with Dunnett’s multiple comparison test (****p < 0.0001).
R. Scanning electron microscopy
Note: Treated and untreated biofilms of K. pneumoniae ATCC BAA-2473 strain can be visualized using a scanning electron microscope (SEM) (Figure 20).
1. Grow K. pneumoniae ATCC BAA-2473 strain to mid-logarithmic phase, corresponding to an optical density (OD600) of 0.5 ± 0.05.
2. Harvest cells by centrifugation at 1,700× g and wash three times with 5 mL of sterile PBS (pH 7.4) to remove residual media components.
3. Culture 1 mL of K. pneumoniae cells and grow them on a 1 cm2 cover glass in a six-well plate for 6 h.
4. Prepare various concentrations of AWME3 (0, 0.25, 0.5, and 1 mg/mL) in buffer solution (acidic water and methanol) and add 1 mL of each concentration to the formed biofilm in a six-well microtiter plate. Then, incubate for 24 h at 37 °C under static conditions.
5. Wash all plates to remove planktonic cells three times with 2 mL of PBS (pH 7.4).
6. Fix all adhered biofilms on the surface of the glass coverslips with 2.5% glutaraldehyde prepared in distilled water (pH 7.2) and incubate them overnight at 4 °C.
7. Wash the plates three times with 2 mL of PBS at 4 °C for 15 min.
8. Dehydrate all plates using a gradient of ethanol at the following concentrations: 30%, 50%, 70%, 80%, 90%, and 95%.
9. Visualize all dehydrated samples under SEM at different magnifications.
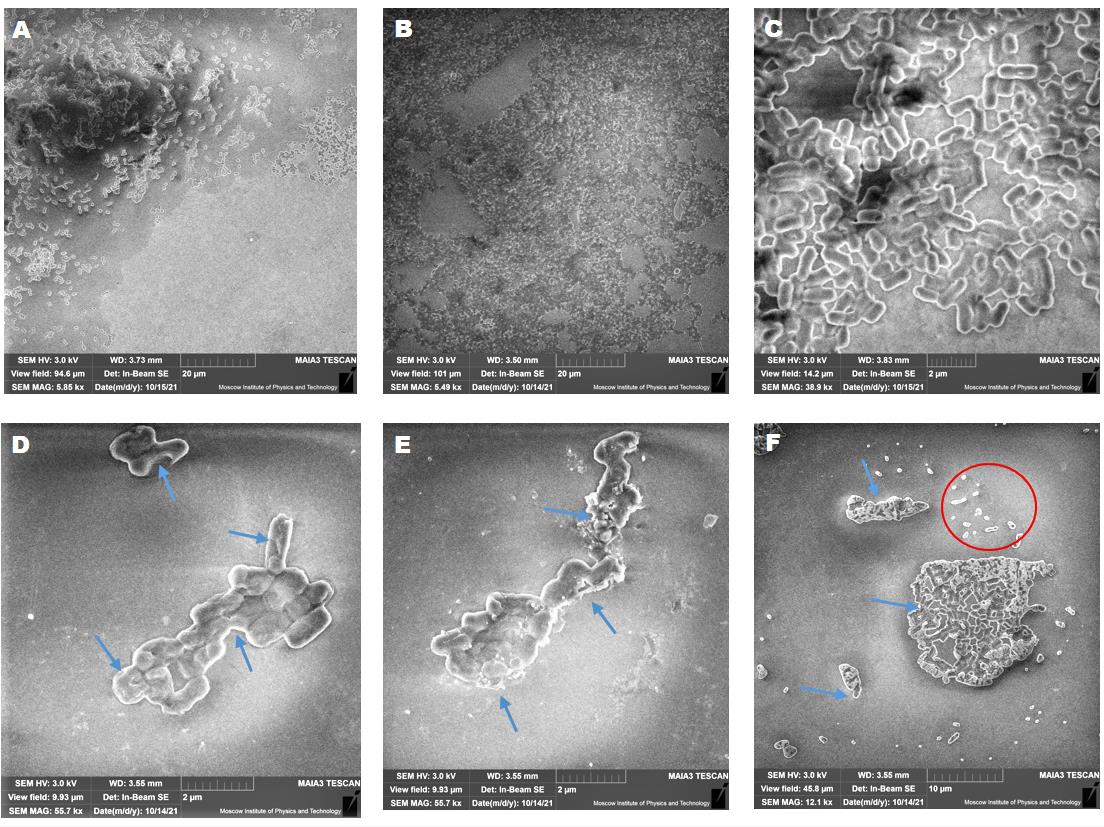
Figure 20. Concentration-related effects of AWME3 on mature biofilm dispersion and biofilm cell death. SEM micrographs of K. pneumoniae ATCC BAA-2473 biofilms were developed on a glass slide surface and incubated for 24 h at 37 °C. (A–C) Untreated biofilm at different magnifications. (D–F) Treated biofilms with (D) 0.5 MIBC (0.25 mg/mL), (E) MIBC (0.5 mg/mL), and (F) 2 MIBC (1 mg/mL) of AWME3. All figures show SEM images with a magnification range from 5,490× to 55,700×. Blue arrows refer to (D) membrane disruption and cell wall degradation or (E) cell wall rupture and severe degradation, and the red cycle refers to bacterial debris.
Data analysis
Use GraphPad Prism for statistical analysis. Perform one-way or two-way ANOVA with appropriate post hoc tests (Dunnett’s, Sidak’s, Tukey’s). Significance is considered at p < 0.05. Fluorescence quantification is performed using ImageJ.
Validation of protocol
This protocol or parts of it has been used and validated in the following research articles:
• Marusich et al. [8]. Fatty Acids from Hermetia illucens Larvae Fat Inhibit the Proliferation and Growth of Actual Phytopathogens. Microorganisms 2020, 8, 1423. (Figure 1).
• Mohamed et al. [9]. Fatty Acids-Enriched Fractions of Hermetia illucens (Black Soldier Fly) Larvae Fat Can Combat MDR Pathogenic Fish Bacteria Aeromonas spp. Int. J. Mol. Sci. 2021, 22, 8829. (Figures 1, 2, and 4).
• Mohamed et al. [10]. Bacterial Outer Membrane Permeability Increase Underlies the Bactericidal Effect of Fatty Acids From Hermetia illucens (Black Soldier Fly) Larvae Fat Against Hypermucoviscous Isolates of Klebsiella pneumoniae. Frontiers in Microbiology, 13, 844811. (Figures 1 and 5).
• Mohamed et al. [11]. A unique combination of natural fatty acids from Hermetia illucens fly larvae fat effectively combats virulence factors and biofilms of MDR hypervirulent mucoviscous Klebsiella pneumoniae strains by increasing Lewis acid–base/van der Waals interactions in bacterial wall membranes. Frontiers in Cellular and Infection Microbiology, 14, 1408179. (Figures 1–7).
• Mohamed et al. [12]. Mechanism of bactericidal efficacy against nosocomial pathogenic Staphylococcus aureus strain caused by fatty acids from Hermetia illucens larvae fat. Scientific Reports, 15(1), 1–16. (Figures 2, 7, and 8).
General notes and troubleshooting
1. The minimum inhibitory concentration (MIC) of AWME3 used in this protocol was determined in our previous study (Mohamed et al. [10]) to be 0.250 mg/mL against all multidrug-resistant Klebsiella pneumoniae strains using the standard broth microdilution method. Researchers applying this protocol to other bacterial strains are advised to determine the MIC of AWME3 independently before performing biofilm or virulence assays, as MIC values may vary among strains. This ensures accurate interpretation of results and minimizes variability in antimicrobial testing outcomes.
2. Expected yield of fatty acids: The extraction of fatty acids from Hermetia illucens (HI) larvae fat typically yields 180 mg of total fatty acids per gram of dried larvae fat, depending on the developmental stage, storage conditions, and extraction efficiency. If yields are below this range, ensure that the larvae are fully dried and that solvent-to-sample ratios and sonication conditions are optimized.
3. Calculation of the normalized value of membrane permeability based on EtBr uptake: Based on the assay protocol we provide earlier (see section D; EtBr-based membrane permeability test for K. pneumoniae treated with AWME3) [11], step D9 refers to a standard step in fluorescence-based microbiology experiments. Normalization adjusts raw data to account for variability (e.g., from instrument settings, EtBr concentration differences, or background noise), making results comparable and interpretable. It ensures that differences in fluorescence readings reflect biological effects (like membrane disruption by AWME3) rather than technical artifacts. This is a common approach in plate reader assays, often using percentage-of-maximum or relative fluorescence units (RFU).
Positive control (maximal fluorescence) contains only EtBr at the same concentration (5 μg/mL) but without any bacteria. Since there is no bacterial uptake or binding, all EtBr remains free in the solution (supernatant), emitting the highest possible fluorescence when excited at 330 nm and measured at 585 nm. This represents 100% extracellular EtBr (or “maximal intensity”). We use a positive control to establish the upper limit of fluorescence under the assay conditions. Without bacteria, there is no cellular barrier, efflux, or intracellular binding to reduce the signal in the supernatant. Also, the negative control represents wells with bacteria but no EtBr (to measure autofluorescence or background from cells/PBS alone). The untreated control represents bacteria with EtBr but no AWME3 (to compare baseline permeability/efflux without the antimicrobial). In our protocol, normalization focuses on the positive control, and any background fluorescence is subtracted from the treated samples to give the fluorescence that is generated from AWME3 activity only after incubation under sterile conditions at 37 °C.
4. Collect raw data: After incubation, centrifugation, and measurement on the CLARIOstar® Plus plate reader, we get raw fluorescence values (in arbitrary units, e.g., RFU) for:
• The positive control (EtBr only): We call this F_max (e.g., 10,000 RFU).
• Treated samples (bacteria + AWME3 at various concentrations + EtBr): Ftreated (e.g., 5,000 RFU for a sample at MIC).
• Negative control, as needed.
Data is collected in triplicates, so we average the three readings per condition (e.g., mean ± standard deviation) to reduce error. Then:
• Subtract the negative control’s fluorescence (Fbackground, e.g., from bacteria/PBS without EtBr) from all other readings.
• Correct Fmax = Fmax - Fbackground.
• Correct Ftreated = Ftreated - Fbackground.
• Calculate normalized values as follows:
a. Express each sample’s fluorescence as a percentage (or fraction) of the maximal intensity (F_max).
b. Formula: Normalized Fluorescence (%) = (Ftreated/Fmax) × 100.
c. Example: If Fmax = 10,000 RFU and Ftreated = 5,000 RFU, then normalized = (5,000/10,000) × 100 = 50%.
d. For fractional normalization (0–1 scale): Normalized = Ftreated/Fmax.
e. Apply this to all concentrations (1/4 MIC to 2 MIC) and replicates.
5. Handle variability and statistics:
a. Average the normalized triplicates for each condition.
b. Calculate error metrics (e.g., standard error of the mean, SEM) for graphing.
c. Use software like GraphPad Prism to calculate standard deviation.
d. Compare groups statistically using ANOVA to determine if differences (e.g., vs. untreated) are significant (p < 0.05).
6. Fixation and dehydration for SEM analysis: To prevent sample detachment during the graded ethanol dehydration steps, do the following:
a. Gradually dehydrate the fixed biofilms in increasing ethanol concentrations (30%, 50%, 70%, 90%, and 100%), maintaining each step for 10–15 min.
b. Avoid excessive vortexing or shaking during transfer steps.
c. If detachment persists, increase the initial fixation time with 2.5% glutaraldehyde from 12 to 15 h at 4 °C to improve cell adhesion to coverslips.
d. Allow samples to air-dry completely before sputter coating.
7. AWME3 should be freshly prepared in the extraction reagent before use to prevent fatty acid precipitation. Store aliquots at 4 °C and avoid repeated freeze–thaw cycles.
Acknowledgments
The authors thank Denis Kuzmin, PhD, the Director of the School of Biological and Medical Physics at MIPT (Moscow, Russia), for his support of this project. All thanks to Andrey Drozdov, PhD, Senior researcher in the Laboratory of Nano-biotechnology, for support during SEM visualization. We also thank Gennady Ivanov, the Director of NordTechSad, LLC (Archangelsk, Russia), for kindly providing fat from Hermetia illucens larvae.
H.M.: Conceptualization, methodology, validation, formal analysis, investigation, writing—original draft, visualization, design, and implementation of all the experiments, software, and analysis of the microscopy data. S.L.: Revised and edited the original draft, work administration, and financial support. E.M.: Conceived, designed, and supervised the study and edited and revised the manuscript. All the authors have read and agreed to the published version of the manuscript.
This research was funded by the Ministry of Science and Higher Education of the Russian Federation (State Task) 075-03-2026 -305, Project No. FSMG -2026-0018. This protocol was used in [8–12].
Competing interests
There are no conflicts of interest or competing interests.
References
- Algammal, A. M., Wahdan, A. and Elhaig, M. M. (2019). Potential efficiency of conventional and advanced approaches used to detect Mycobacterium bovis in cattle. Microb Pathogen. 134: 103574. https://doi.org/10.1016/j.micpath.2019.103574
- Kareem, S. M., Al-kadmy, I. M., Kazaal, S. S., Mohammed Ali, A. N., Aziz, S. N., Makharita, R. R., Algammal, A. M., Al-Rejaie, S., Behl, T., Batiha, G. S., et al. (2021). Detection of gyrA and parC Mutations and Prevalence of Plasmid-Mediated Quinolone Resistance Genes in Klebsiella pneumoniae. Infect Drug Resist. 14: 555–563. https://doi.org/10.2147/idr.s275852
- Shafiq, M., Zeng, M., Permana, B., Bilal, H., Huang, J., Yao, F., Algammal, A. M., Li, X., Yuan, Y., Jiao, X., et al. (2022). Coexistence of blaNDM–5 and tet(X4) in international high-risk Escherichia coli clone ST648 of human origin in China. Front Microbiol. 13: e1031688. https://doi.org/10.3389/fmicb.2022.1031688
- Murray, C. J. L., Ikuta, K. S., Sharara, F., Swetschinski, L., Robles Aguilar, G., Gray, A., Han, C., Bisignano, C., Rao, P., Wool, E., et al. (2022). Global burden of bacterial antimicrobial resistance in 2019: a systematic analysis. Lancet. 399(10325): 629–655. https://doi.org/10.1016/s0140-6736(21)02724-0
- Trunk, T., S. Khalil, H. and C. Leo, J. (2018). Bacterial autoaggregation. AIMS Microbiol. 4(1): 140–164. https://doi.org/10.3934/microbiol.2018.1.140
- Amdan, N. A. N. (2018). Investigation into mechanisms of biofilm formation by Klebsiella pneumoniae.
- Kumar, P., Lee, J. H., Beyenal, H. and Lee, J. (2020). Fatty Acids as Antibiofilm and Antivirulence Agents. Trends Microbiol. 28(9): 753–768. https://doi.org/10.1016/j.tim.2020.03.014
- Marusich, E., Mohamed, H., Afanasev, Y. and Leonov, S. (2020). Fatty Acids from Hermetia illucens Larvae Fat Inhibit the Proliferation and Growth of Actual Phytopathogens. Microorganisms. 8(9): 1423. https://doi.org/10.3390/microorganisms8091423
- Mohamed, H., Marusich, E., Afanasev, Y. and Leonov, S. (2021). Fatty Acids-Enriched Fractions of Hermetia illucens (Black Soldier Fly) Larvae Fat Can Combat MDR Pathogenic Fish Bacteria Aeromonas spp. Int J Mol Sci. 22(16): 8829. https://doi.org/10.3390/ijms22168829
- Mohamed, H., Marusich, E., Afanasev, Y. and Leonov, S. (2022). Bacterial Outer Membrane Permeability Increase Underlies the Bactericidal Effect of Fatty Acids From Hermetia illucens (Black Soldier Fly) Larvae Fat Against Hypermucoviscous Isolates of Klebsiella pneumoniae. Front Microbiol. 13: e844811. https://doi.org/10.3389/fmicb.2022.844811
- Mohamed, H., Marusich, E., Divashuk, M. and Leonov, S. (2024). A unique combination of natural fatty acids from Hermetia illucens fly larvae fat effectively combats virulence factors and biofilms of MDR hypervirulent mucoviscus Klebsiella pneumoniae strains by increasing Lewis acid–base/van der Waals interactions in bacterial wall membranes. Front Cell Infect Microbiol. 14: e1408179. https://doi.org/10.3389/fcimb.2024.1408179
- Mohamed, H., Marusich, E., Pustovalova, M. and Leonov, S. (2025). Mechanism of bactericidal efficacy against nosocomial pathogenic Staphylococcus aureus strain caused by fatty acids from Hermetia illucens larvae fat. Sci Rep. 15(1): 1–16. https://doi.org/10.1038/s41598-025-15858-0
- Lev, A. I., Astashkin, E. I., Kislichkina, A. A., Solovieva, E. V., Kombarova, T. I., Korobova, O. V., et al. (2018). Comparative analysis of Klebsiella pneumoniaestrains isolated in 2012–2016 that differ by antibiotic resistance genes and virulence genes profiles. Pathog Glob Health. 112: 142–151. https://doi.org/10.1080/20477724.2018.1460949
Article Information
Publication history
Received: Sep 20, 2025
Accepted: Jan 16, 2026
Available online: Feb 26, 2026
Published: Mar 5, 2026
Copyright
© 2026 The Author(s); This is an open access article under the CC BY-NC license (https://creativecommons.org/licenses/by-nc/4.0/).
How to cite
Mohamed, H., Marusich, E. and Leonov, S. (2026). Framework for Analyzing the Anti-biofilm and Anti-virulence Activities of Fatty Acids from Hermetia illucens Larvae Targeting Multidrug-Resistant Klebsiella pneumoniae. Bio-protocol 16(5): e5629. DOI: 10.21769/BioProtoc.5629.
Category
Microbiology > Microbial biofilm > Response to antimicrobials
Biological Sciences > Biological techniques > Microbiology techniques
Do you have any questions about this protocol?
Post your question to gather feedback from the community. We will also invite the authors of this article to respond.