- Protocols

- Articles and Issues
- For Authors
- About
- Become a Reviewer

Dynamic Mapping of RNA-Binding Proteins During Bacillus subtilis Sporulation Using Orthogonal Organic Phase Separation
Published: Vol 16, Iss 5, Mar 5, 2026 DOI: 10.21769/BioProtoc.5622 Views: 446
Reviewed by: Shengze YaoJing LiAnu Thomas
Original research article
The authors used this protocol in:
Sep 2025
Advertisement


Protocol Collections
Comprehensive collections of detailed, peer-reviewed protocols focusing on specific topics


Abstract
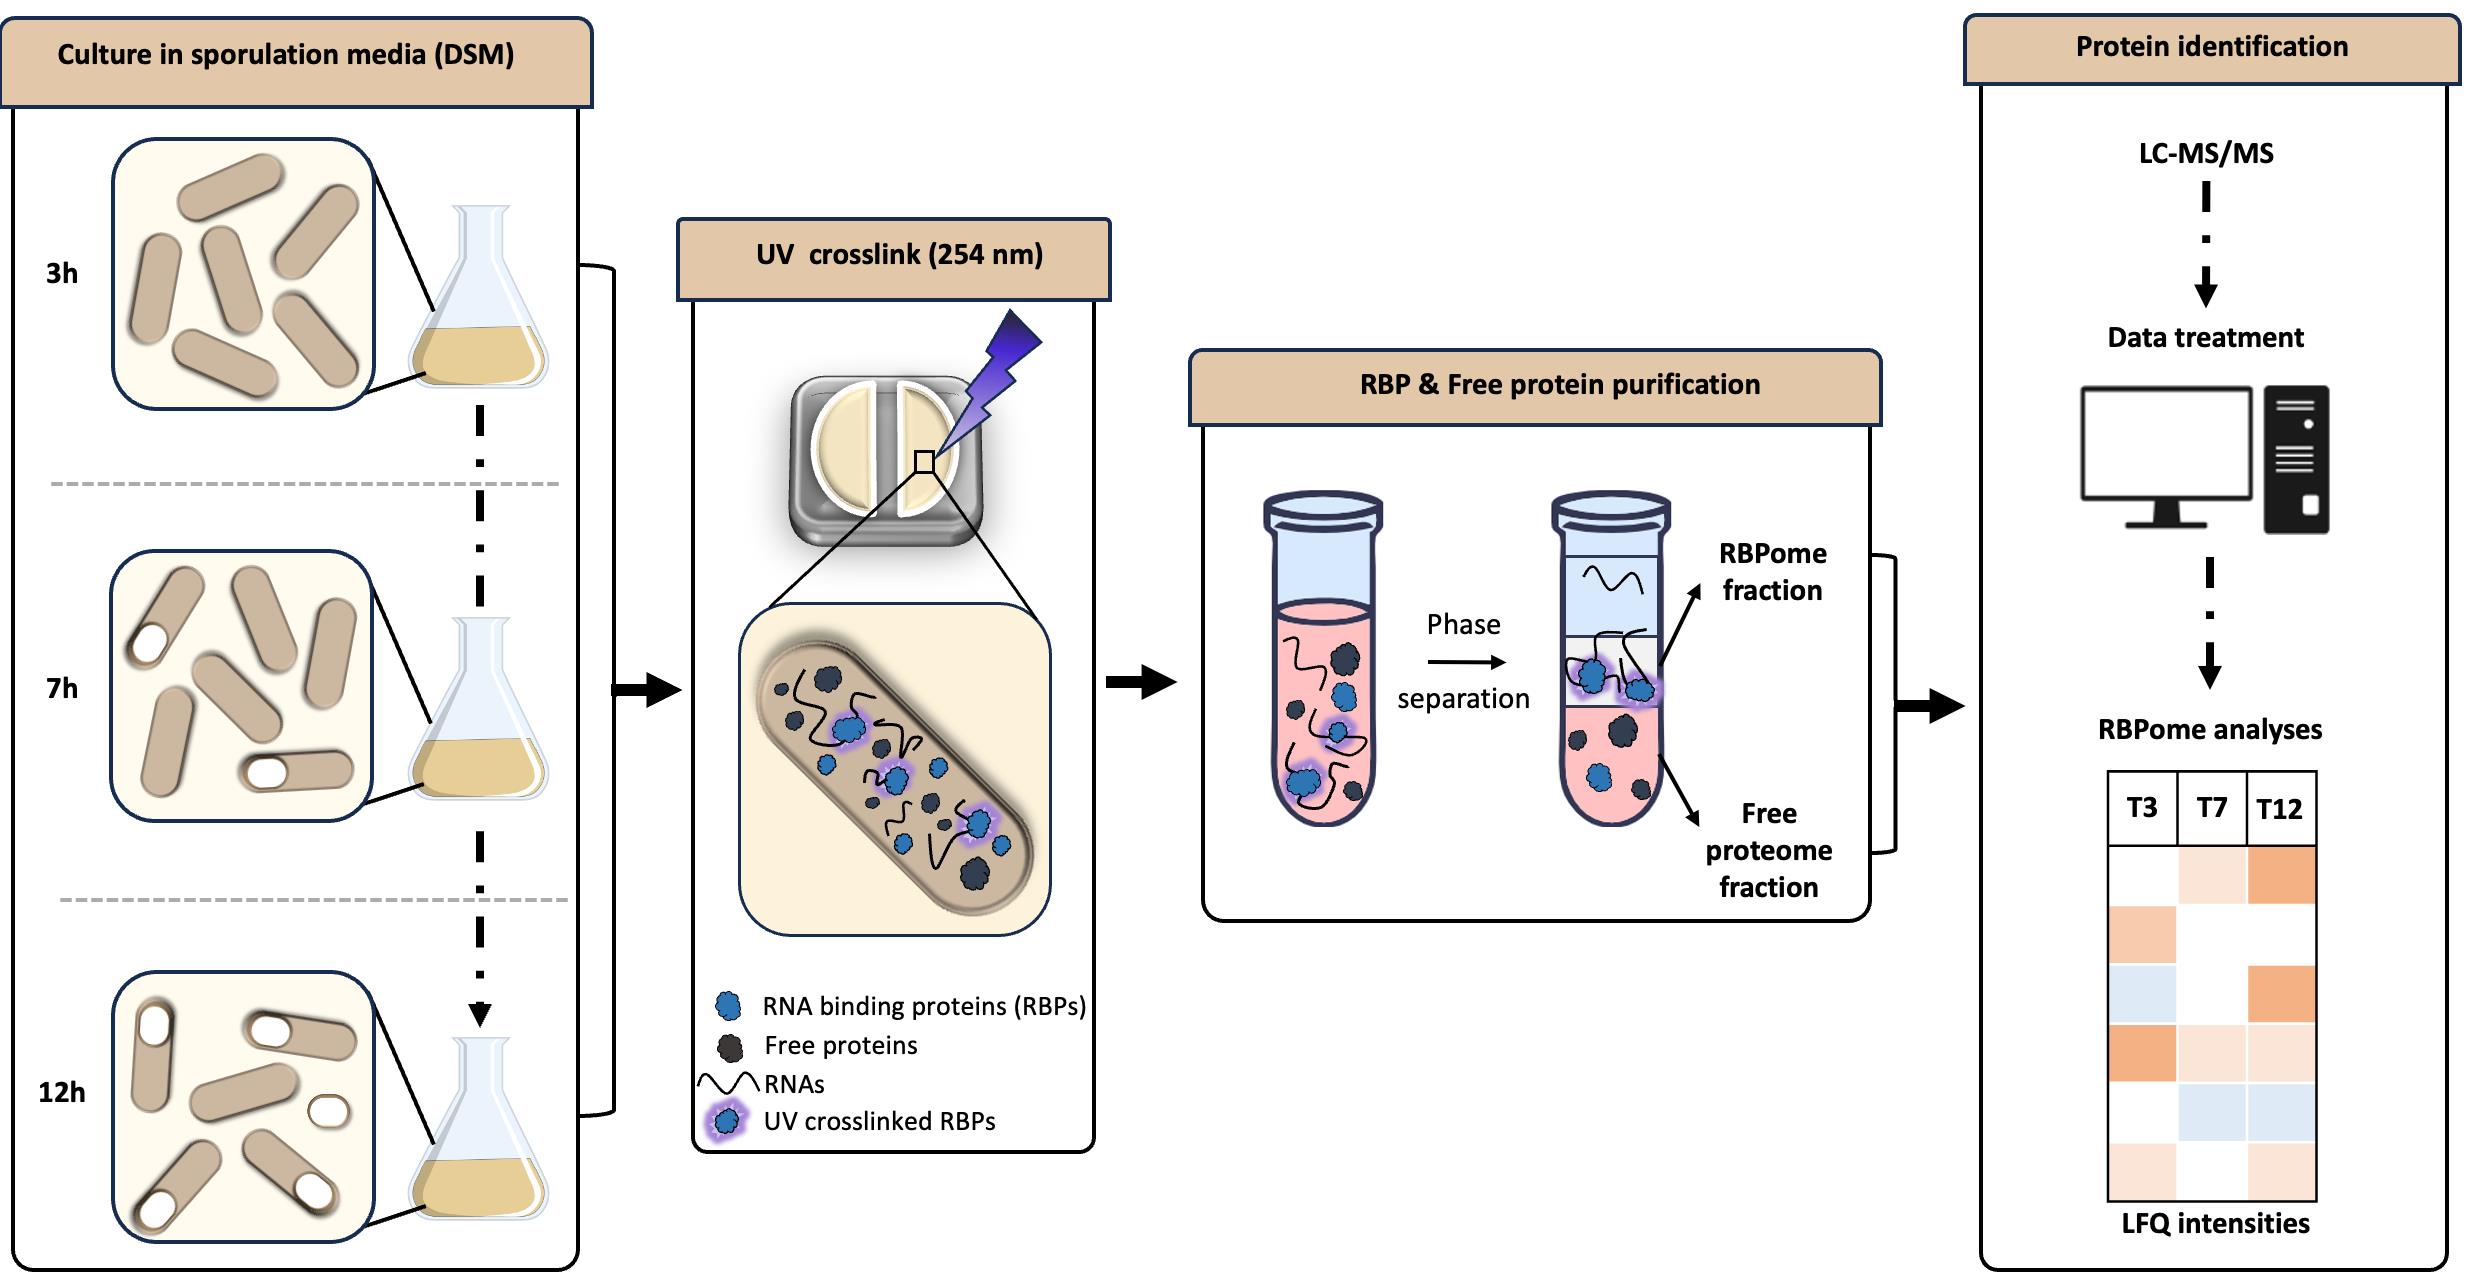
RNA-binding proteins (RBPs) have pleiotropic roles in modulating the physiology of both eukaryotic and prokaryotic cells, enabling them to adapt to environmental variations. The importance of RBPs has led to the development of a variety of methods aiming to identify them. However, most of these approaches have primarily been implemented and optimized in eukaryotic systems. To both uncover novel RBPs involved in Bacillus subtilis sporulation and capture their RNA-binding ability dynamically, we adapted the orthogonal organic phase separation technique (OOPS), which had previously been used in Escherichia coli to reveal its RNA-binding proteome (RBPome). We optimized the UV cross-linking process used to stabilize RNA–protein interactions in vivo and the bacterial lysis process to overcome the robust cell wall of Gram-positive sporulating cells. RNA–protein complexes are then recovered after phase separation steps using guanidinium thiocyanate–phenol–chloroform, and RNA-associated proteins are identified and label-free-quantified by liquid chromatography–mass spectrometry. Collecting samples at various time points during sporulation further enables tracking the dynamics of the RBPome. In addition to being applicable to bacteria and requiring minimal starting material, this method has provided a comprehensive map of the RBPome during sporulation, refining the roles of known factors and revealing new players.
Key features
• The high-throughput method OOPS, developed in [1], was successfully applied to both sporulating and vegetative cells of a Gram-positive bacterium to specifically purify the RBPome.
• OOPS allowed tracking of RBPome remodeling dynamics (both RBP abundance and RNA binding ability) across different stages of B. subtilis sporulation.
• OOPS enabled the identification of novel RBPs in the context of sporulation, revealing potential new players in RNA-mediated regulation.
Keywords: RNA binding proteinsGraphical overview
Background
RNA-binding proteins (RBPs) have emerged as key post-transcriptional regulators that help bacteria to adjust gene expression, especially in the face of rapid environmental changes. Based on the global transcriptome study of Nicolas et al. [2] in Bacillus subtilis, we observed that sporulation is the condition associated with the highest number of expressed putative small regulatory RNAs (sRNAs). While this suggests extensive post-transcriptional regulation during sporulation, its impact on the process remains largely unexplored. Given the diversity of both RNA–RBP interactions involving multiple classes of RNAs and RBP functions, a global approach centered on RNA–protein interactions was required to understand the complexity of these regulatory networks.
Sporulation is a highly dynamic process governed by sequential regulatory cascades known to act at transcriptional, translational, and post-translational levels. Therefore, to capture this temporal complexity, we adopted a dynamic strategy that would not only identify RBPs but also monitor how RNA–protein interactions are modulated over time. To achieve this, in our recent work on B. subtilis, we applied a global proteome-wide approach that would allow tracking the remodeling of the RBPome during the sporulation process and identify new candidate RBPs for further functional characterization.
Global mapping of RNA–protein interactions in bacteria remains technically challenging. Most RBPome methods were initially developed for eukaryotes and rely on poly(A) selection or large amounts of starting material, making them poorly suited to non-polyadenylated bacterial transcriptomes and to conditions in which biomass is limiting. Orthogonal organic phase separation (OOPS) overcomes several of these constraints by coupling UV cross-linking with TRIzol-based phase separation to enrich RNA–protein complexes directly from cell lysates in a sequence-independent manner [3,4]. Compared with related phase-extraction methods, OOPS required less input (for human cells, ~3 × 10⁶ cells for OOPS vs. ~5 × 10⁶ for PTex and ~8 × 10⁷ for XRNAX) [3,4], which is a major advantage for time-resolved experiments. Although no systematic head-to-head comparison is available, published datasets suggest that OOPS achieves a depth of coverage comparable to alternative strategies; for instance, PTex recovered 384 enriched RBPs in Staphylococcus aureus, a number similar to the 364 E. coli RBPs identified using OOPS [5]. Additionally, the OOPS protocol is technically accessible, cost-effective, and rapid to implement, requiring no highly specialized expertise beyond standard proteomics and basic RNA handling. In our study, we used label-free quantification, which is less precise than isotope-based approaches such as SILAC but provides sufficient quantitative resolution to capture global RBPome remodeling and relative changes in RNA binding over the course of sporulation, while substantially reducing cost and experimental complexity.
OOPS was therefore ideally suited to our objective of obtaining an overview of the RBPome during sporulation and identifying new post-transcriptional regulators of this process. We applied OOPS to cultures sampled at different stages of sporulation—from vegetative cells to the appearance of the first mature spores—enabling dynamic tracking of the RBPome modulation during the process. Prior to our study, bacterial applications of OOPS had focused only on Gram-negative E. coli and had not yet been extended to a Gram-positive bacterium [3]. Consequently, we also had to adapt the UV cross-linking and cell lysis procedures to B. subtilis. Indeed, the cell wall of Gram-positive bacteria is composed of a thick layer of peptidoglycan and is more resistant than that of Gram-negative bacteria. B. subtilis forms prespores and highly resistant spores that require specific lysis conditions and show reduced sensitivity to UV treatment. This adapted protocol, based largely on the original OOPS workflow [4], includes targeted methodological adjustments that are in line with our study model. This approach allowed us to detect not only proteins that have already been described as RBP but also to provide dynamic monitoring of their binding to RNA during sporulation. Moreover, we identified a new candidate RBP that is particularly enriched during this process. Together, these results broaden our understanding of the proteins that may contribute to post-transcriptional regulation during sporulation [1].
Materials and reagents
Biological materials
1. B. subtilis WT168 (laboratory stock)
Reagents
1. BactoTM tryptone (Thermo Fisher Scientific, catalog number: 211705); store at room temperature (RT) in a dry place
2. BactoTM yeast extract (Thermo Fisher Scientific, catalog number: 212750); store at RT in a dry place
3. NaCl (Sigma-Aldrich, catalog number: S9888); store at RT in a dry place
4. Nutrient broth No. 4 (DSM) (Fluka Analytical, catalog number: 03856); store at RT in a dry place
5. KCl (Thermo Scientific, catalog number: 7447-40-7); store at RT in a dry place
6. MgSO4 (Sigma-Aldrich, catalog number: M1880-500G); store at RT in a dry place
7. Phosphate buffer saline (PBS) tablets, pH 7.4 (Euromedex, catalog number: EU1-2052-100); store at RT in a dry place
8. RNaseZapTM RNase decontamination solution (Invitrogen, catalog number: AM9782); store at RT
9. Lysing matrix B bulk (MP Biomedicals, catalog number: 6540425); store at RT in a dry place
10. TRIzol (Thermo Fisher Scientific, catalog number: 15596018), store at 4°C
Caution: This chemical is corrosive, irritating, and toxic.
11. Chloroform (Carlo Erba, catalog number: 438581); store at RT
Caution: This chemical is toxic.
12. Propan-2-ol (Carlo Erba, catalog number: 415154); store at RT
Caution: This chemical is flammable and irritating.
13. Phenol:chloroform:isoamyl alcohol (25:24:1, v/v) (PanReac AppliChem, catalog number: A0944); store at 4 °C
Caution: This chemical is corrosive, irritating, and toxic.
14. Ethanol absolute anhydrous (Carlo Erba, catalog number: 4146012); store at RT
Caution: This chemical is flammable.
15. Methanol (Carlo Erba, catalog number: 414819); store at RT
Caution: This chemical is flammable and toxic.
16. Proteinase K, recombinant PCR grade (Roche, catalog number: 03115887001); store at -20 °C
17. Sodium acetate (3 M, pH 5.5) (Thermo Fisher Scientific, catalog number: AM9740); store at 4 °C
18. EDTA (Sigma-Aldrich, catalog number: EDS); store at RT
Caution: This chemical is irritating and toxic.
19. RNace-It (RNase A/T1) cocktail (Agilent, catalog number: 400720); store at -20 °C
20. MgCl2 (Sigma-Aldrich, catalog number: M8266); store at RT
21. Tris-base (Euromedex, catalog number: 26-128-3094-B); store at RT
22. Sodium dodecyl sulfate (SDS) (Sigma-Aldrich, catalog number: M8266); store at RT
23. Triethylammonium bicarbonate (TEAB) buffer (1 M, pH 8.5) (Sigma-Aldrich, catalog number: T708); store at 4 °C
24. UltraPure water from PURELAB flex system (ELGA); store at RT
25. Imperial Blue staining solution (Thermo Fisher Scientific, catalog number: 24615); store at RT protected from light
26. Sequencing-grade modified trypsin (Promega, catalog number: V5111); store at -20 °C
27. Ammonium bicarbonate (ABC) (Sigma/Merck, catalog number: 09830); store at RT
28. Iodoacetamide (IAA) (Sigma/Merck, catalog number: I1149); store at -20 °C
29. Acetonitrile LCMS (ACN) (Sigma/Merck, catalog number: 1.00029); store at RT
30. DL-Dithiothreitol (DTT) (Sigma/Merck, catalog number: D9163); store at -20 °C
31. Color protein standard (New England Biolabs, catalog number: P7719S)
32. NuPAGETM 4%–12% Bis-Tris gel (Invitrogen, catalog numbers: NP0321BOX and NP0322BOX)
33. NuPAGETM MOPS SDS running buffer 20× (Invitrogen, catalog number: NP001)
Solutions
1. LB media (see Recipes)
2. DSM stock solution (see Recipes)
3. DSM working solution (see Recipes)
4. TN150 solution (see Recipes)
5. Lysis solution (see Recipes)
6. 10 mM DTT (see Recipes)
7. 55 mM IAA (see Recipes)
8. 20× Trypsin/Lys-C (see Recipes)
9. 1× Trypsin/Lys-C mix (see Recipes)
Recipes
1. LB media
| Reagent | Final concentration | Volume |
|---|---|---|
| Bacto tryptone | 10 g/L | 10 g |
| Yeast extract | 5 g/L | 5 g |
| NaCl | 5 g/L | 5 g |
| Demineralized water | n/a | 1 L |
| Total | n/a | 1 L |
2. DSM stock solution
| Reagent | Final concentration | Volume |
|---|---|---|
| Difco nutrient broth | 8 g/L | 8 g |
| KCl | 1 g/L | 1 g |
| MgSO4·7H2O | 0.25 g/L | 0.25 g |
| Demineralized water | n/a | 1 L |
| Total | n/a | 1 L |
3. DSM working solution
| Reagent | Final concentration | Volume |
|---|---|---|
| DSM stock solution | n/a | 10 mL |
| 1 M Ca(NO3)2 | 1 mM | 10 μL |
| 10 mM MnCl2 | 10 μM | 10 μL |
| 83 mM FAC (ferric ammonium citrate) | 80 μM | 10 μL |
| 1 mM FeSO4 | 200 nM | 2 μL |
| Total | n/a | 10 mL |
All elements must be added on the day of the culture.
4. TN150 solution
| Reagent | Final concentration | Volume |
|---|---|---|
| Tris-HCl pH 7.8 (1.0 M) | 50 mM | 250 μL |
| NaCl (5.0 M) | 150 mM | 150 μL |
| NP-40/IGEPAL CA-630 (10%) | 0.1% | 50 μL |
| RNase-free H2O | n/a | 4.55 mL |
| Total | n/a | 5 mL |
TN150 can be stored at 4 °C for 1–3 months.
5. Lysis solution
| Reagent | Final concentration | Volume |
|---|---|---|
| TN150 | n/a | 1.72 mL |
| Lysozyme (100 mg/mL) | 10 mg/mL | 200 μL |
| DNase RQ1 (1 U/μL) | 0.035 U/μL | 80 μL |
| Total | n/a | 2 mL |
Prepare freshly prior to use and avoid storage.
6. 10 mM DTT
| Reagent | Final concentration | Quantity or volume |
|---|---|---|
| 100 mM ammonium bicarbonate (ABC) | 100 mM | 1.5 mL |
| DTT | 1.54 g/L | 2.3 mg |
| Total | n/a | 1.5 mL |
Aliquot and store at -20 °C for 3–6 months.
7. 55 mM IAA
| Reagent | Final concentration | Quantity or volume |
|---|---|---|
| 100 mM ABC | 100 mM | 1.5 mL |
| IAA | 10.17 g/L | 15.3 mg |
| Total | n/a | 1.5 mL |
Aliquot and store at -20 °C for 3–6 months protected from light.
8. 20× Trypsin/Lys-C
| Reagent | Final concentration | Quantity or volume |
|---|---|---|
| Manufacturer resuspension buffer | n/a | 100 μL |
| Trypsin/Lys-C (lyophilized) | 200 ng/μL | 20 μg (lyophilized) |
| Total | n/a | 100 μL |
Aliquot and store at -20 °C for 6–12 months.
9. 1× Trypsin/Lys-C mix
| Reagent | Final concentration | Volume |
|---|---|---|
| 20× Trypsin/Lys-C | 10 ng/μL | 10 μL |
| 25 mM ABC | 25 mM | 185 μL |
| 1% ProteaseMax | 0.025% | 5 μL |
| Total | n/a | 200 μL |
Prepare freshly; avoid storage.
Laboratory supplies
1. 1 L culture flasks
2. INFORS HT Multitron shaking incubator
3. Sarstedt tubes 15 mL (Sarstedt, catalog number: 62.554.502) and 50 mL (Sarstedt, catalog number: 62.547.254)
4. Nylon filter membranes, 0.45 μm pore size, 90 mm (Merck Millipore, catalog number: HNWP09000)
5. Microfuge tubes 1.5 mL (Sarstedt, catalog number: 72.690.001)
6. Disposable gloves
7. Paper towels
8. Micropipettes (2 μL, 20 μL, 200 μL, 1 mL)
9. C18 trap column (0.3 × 5 mm) PepMap Neo C18 5 μm, 300 μm × 5 mm 17400 (Thermo Scientific, catalog number: 174500)
10. EASY-SprayTM PepMapTM Neo capillary column (75 μm × 50 cm or 75 μm × 15 cm, 2 μm, 100 Å) (Thermo Scientific, catalog numbers: ES75500PN or ES75750PN)
11. Scalpels (Swann Morton, catalog number: 0501)
12. Protein Lo-Bind tubes (Eppendorf, catalog number: 0030108116)
Equipment
1. Hybridization incubator (UVP, model: HL-2000)
2. DWK Life DURANTM filter funnel head, with PP funnel and two FKM seals (Fisher Scientific, catalog number: 10202321)
3. DWK Life Sciences DURANTM filter disc, fused glass rim (Fisher Scientific, catalog number: 10179560)
4. Thermo shaker (Thermal Shake lite) (VWR, catalog number: 460−0249)
5. FastPrep®-24 5G bead beating grinder and lysis system (MP Biomedicals)
6. Table-top vortex
7. Fume extraction hood
8. NanoDropTM One/OneC Microvolume UV-Visible Spectrophotometer (Thermo ScientificTM)
9. InvitrogenTM mini gel tank and transfer module set (Invitrogen, catalog number: 15384604)
10. S700 ChillBlockTM tube racks for MCT (Simport Scientific, catalog numbers: S700-16 and S700-14)
11. Centrifuge (Eppendorf, model: 5810/5810 R)
12. Centrifuge paillasse (Eppendorf)
13. SavantTM SpeedVacTM DNA 130 Integrated Vacuum Concentration System (Thermo Fisher)
14. Q-Exactive Plus (Orbitrap, Thermo Fisher)
Software and datasets
1. MaxQuant (v.2.5.0.0; downloaded from https://maxquant.net/maxquant/, Cox lab, Max Planck Institute of Biochemistry, Martinsried, Germany)
2. Perseus software (v 1.6.15)
3. Microsoft Excel (Microsoft 365)
Procedure
A. Culture and UV cross-linking (Figure 1)
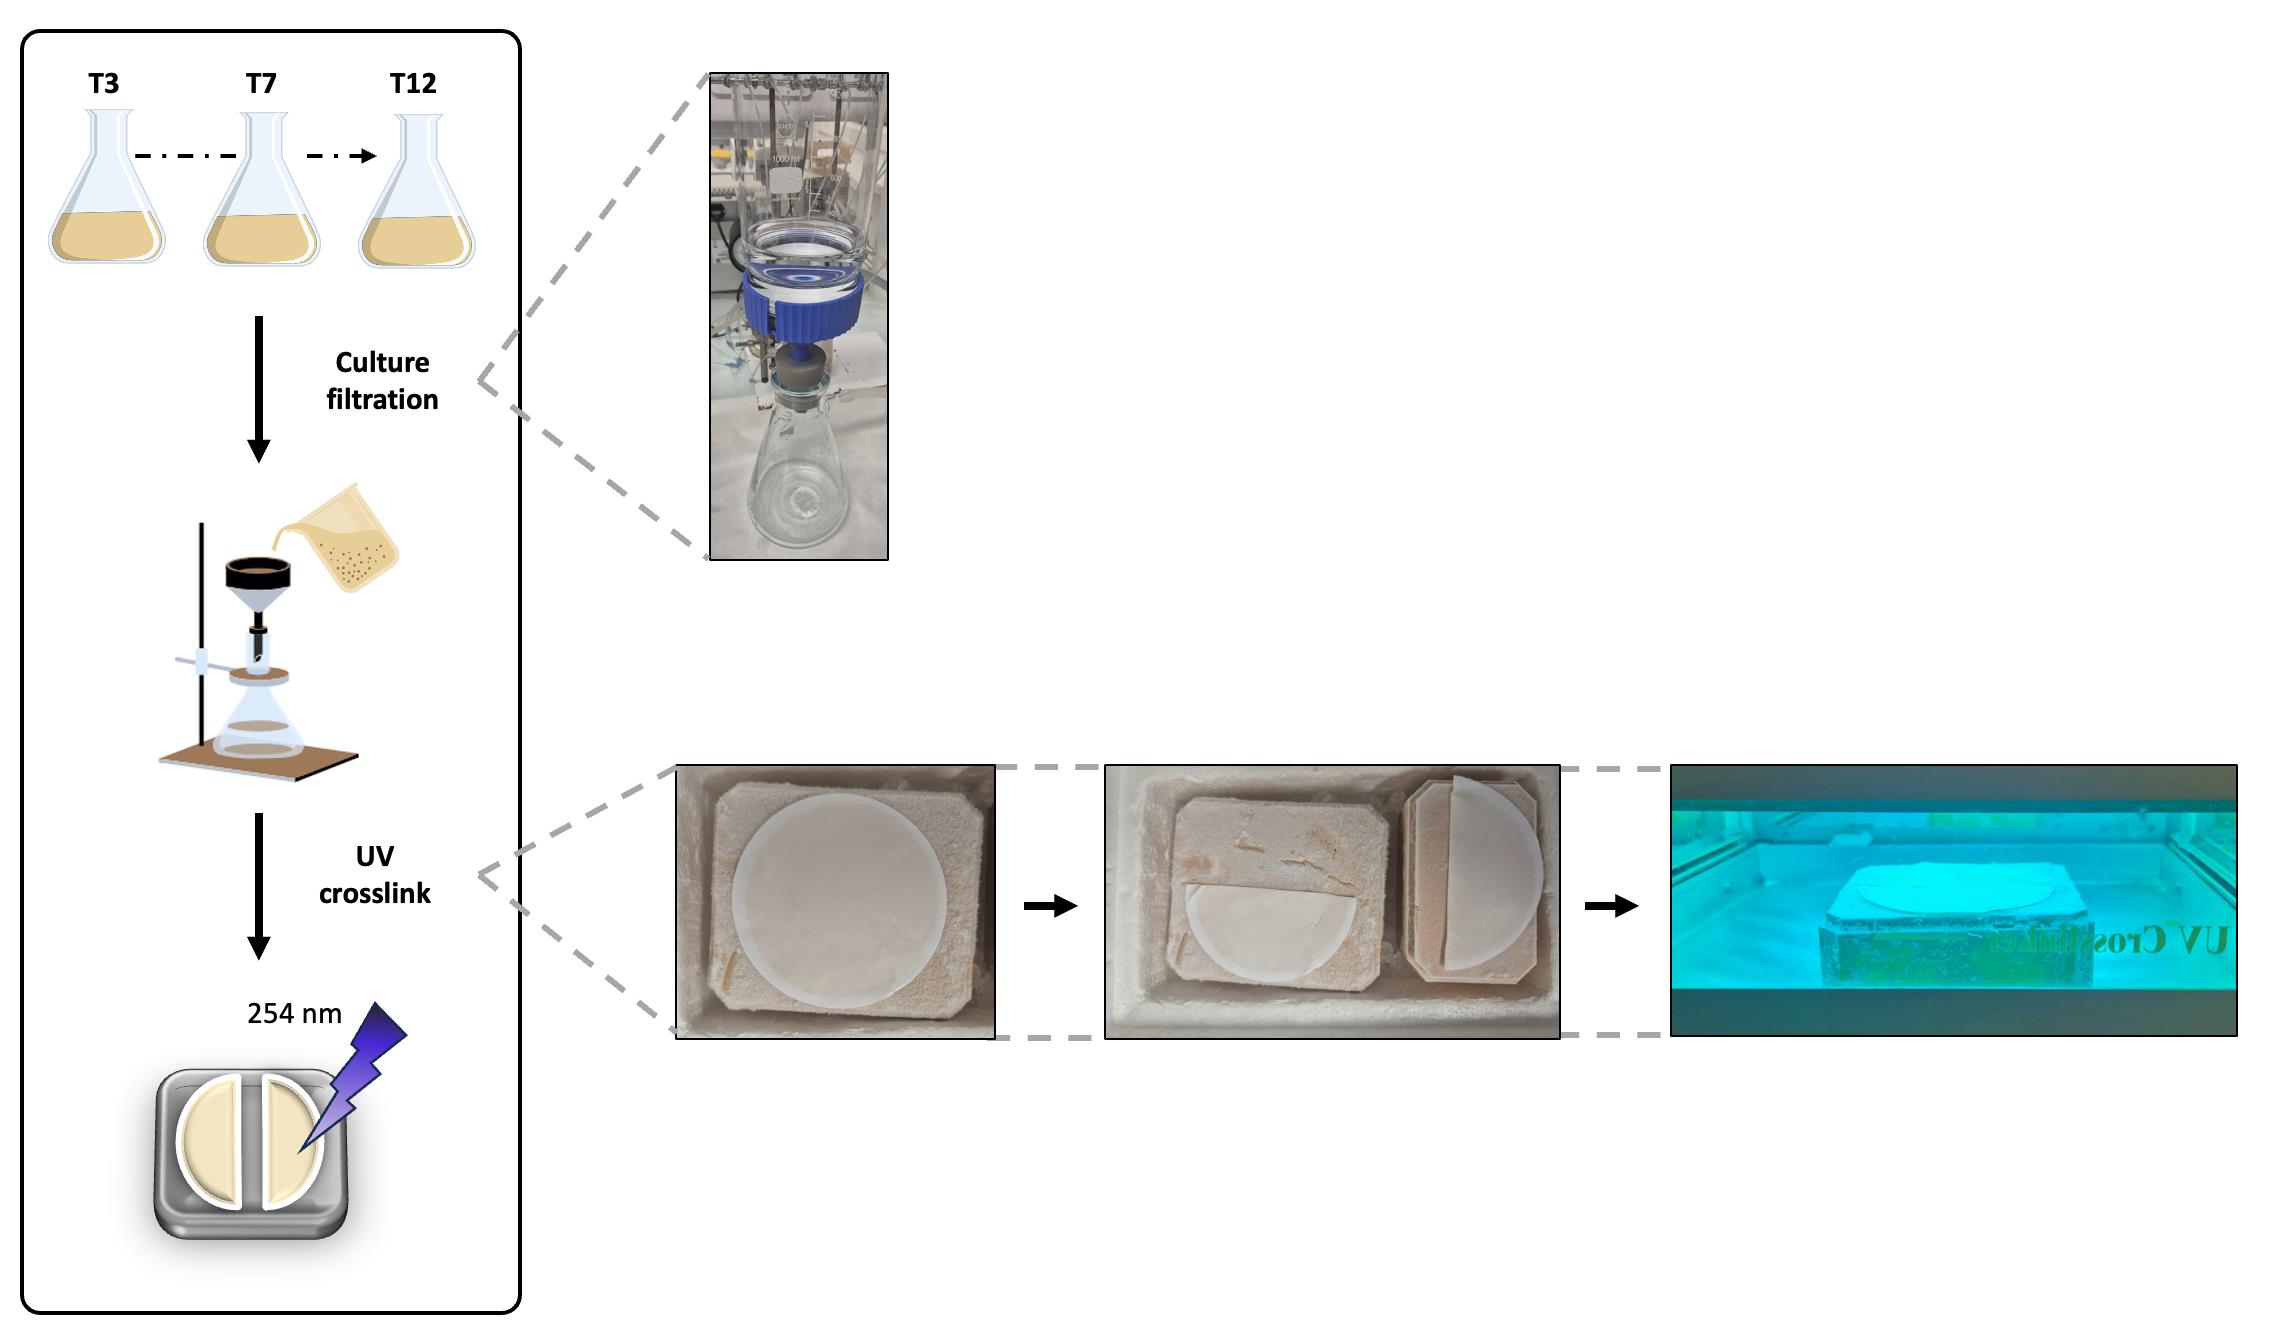
Figure 1. Culture filtration and UV cross-linking of RNA–protein complexes. Cultures are grown in sporulation medium (DSM) in triplicate and sampled at different stages (3, 7, and 12 h). At each time point, a volume of cells corresponding to 200 OD600nm units is collected and filtered through a nylon membrane. After filtration, the membrane is immediately frozen on a pre-chilled metal block (previously kept at -70 °C) and divided into two halves. One half is exposed to UV irradiation (UV+), whereas the other is left untreated (UV-), before resuspension in ice-cold RNase-free PBS.
1. Start 3 × 20 mL DSM pre-cultures at 37 °C until OD600nm = 1.
2. Inoculate 3 × 200 mL DSM cultures at OD600nm = 0.1 from pre-cultures. This corresponds to the T0.
3. Measure OD600nm and collect 200 OD600nm units at the desired culture time points (in our case: 3, 7, and 12 h from different cultures). For example, if the culture reaches an OD600nm = 1, you will need 200 mL to obtain 200 OD600nm units.
Notes:
1. We performed label-free quantitative proteomics (instead of SILAC used in the original protocol [4]). Therefore, a minimum of three to four biological replicates is required for each condition/time point. Additional replicates may be required if statistical analysis of the proteomics data shows high variability between replicates.
2. To follow the dynamics of a biological process such as sporulation, samples should ideally be collected from the same culture at different time points. The sampled culture volumes should be adjusted accordingly to ensure that 200 OD600nm units are collected and filtered per sample.
3. We use DSM medium for sporulation and LB for control cultures (vegetative growth). Please use the appropriate medium for your study.
4. Filter culture onto nylon membrane filters using a filtration system equipped with sintered glass (Figure 1).
Note: We recommend using no more than 200 OD600nm units per 90 mm membrane filter. This prevents cell overlap, which can affect cross-link efficiency and cause membrane saturation, thereby blocking medium flow. The membranes have a diameter of 9 cm, giving an area of 63.6 cm2 and an average of 3.14 OD600nm per cm2 when filtering 200 OD600nm units.
5. Add 25 mL of cold RNase-free PBS and filter again to eliminate residual media.
Note: We opted for filtration instead of centrifugation of the cultures, as in the original protocol [4]. This allows efficient removal by PBS of residual culture medium that may hinder UV cross-linking; also, this allows obtaining cells as a thin layer on the nylon membrane filter, which is good for UV cross-linking.
6. Quickly freeze the cells by putting the membrane on a cold metal block previously stored at -70 °C (Figure 1).
Note: This step improves cross-linking efficiency (Figure 2C).
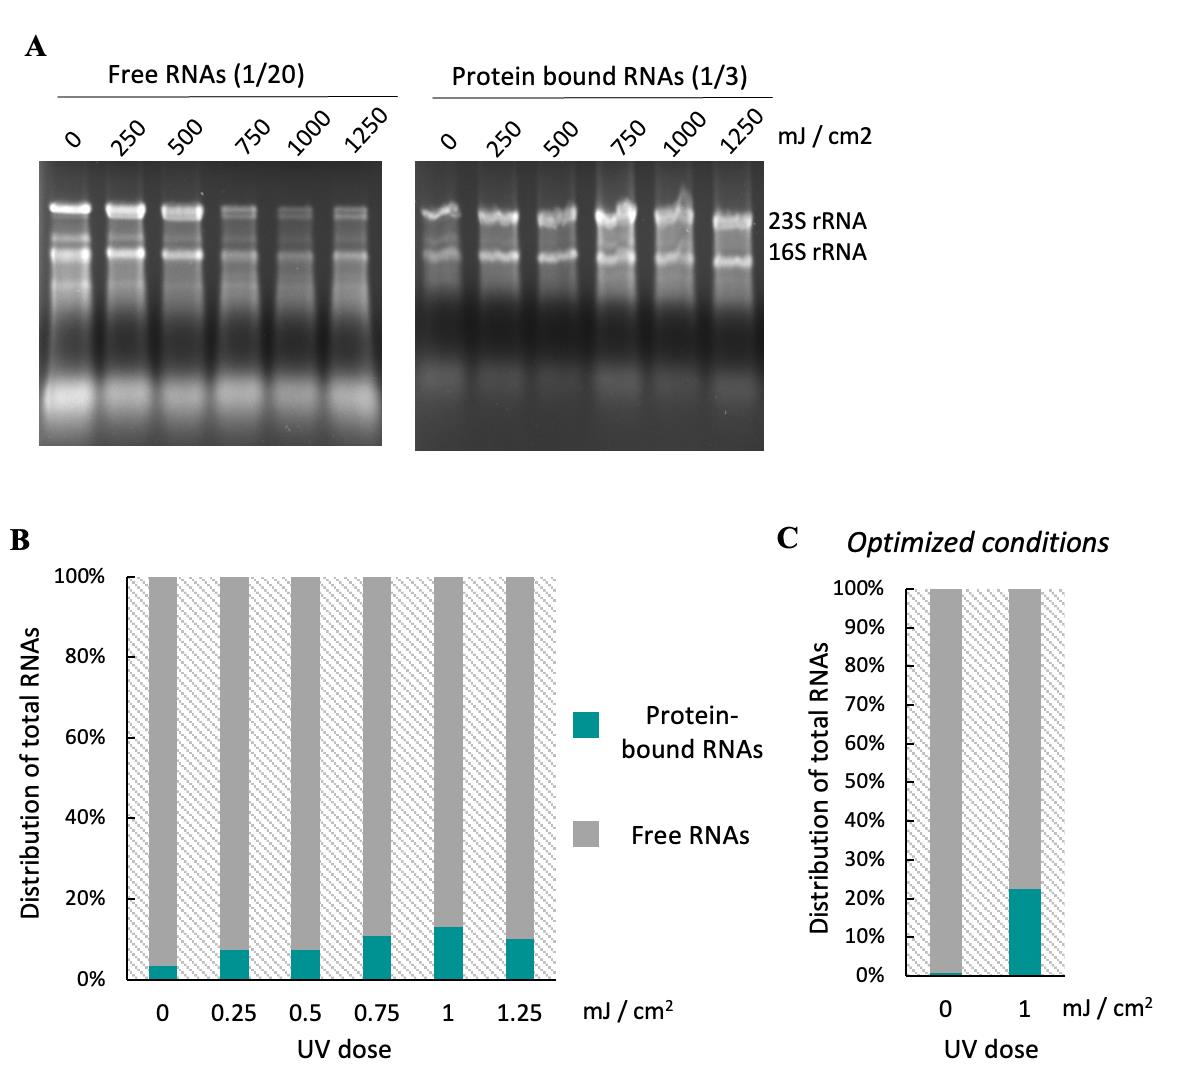
Figure 2. UV cross-linking efficiency on Bacillus subtilis. (A) 1/20th of recovered free RNAs (following the optional sections H1 and H2 in the Procedure) from cells exposed to different UV doses under standard conditions were separated on a 1% agarose gel. (B) Free RNAs and protein-bound RNAs were quantified to determine the UV dose that maximizes RNA–protein cross-linking while using the lowest effective intensity. Cross-linking efficiency (proportion of protein-bound RNAs among total RNAs) reached its maximum (14%) at 1 J/cm2 and did not increase further beyond this dose. (C) Free RNA and protein-bound RNAs recovered from cells, either not cross-linked or exposed to 1 J/cm2 UV under optimized conditions (with fewer cells harvested on the filter membrane and freezing the membrane prior to cross-linking), were quantified to determine cross-linking efficiency. Optimized conditions improved efficiency to 23%.
7. Cut the filter membrane into two equal pieces (100 OD600nm/sample) using a clean scalpel (Figure 1).
8. Expose one half of the membrane to UV radiation (UV+, λ = 254 nm) using a total energy dose of 1 J/cm2 (corresponding to 1 × 9,999 × 100 µJ/cm2 on the cross-linker, with exposure lasting approximately 2 min) using a prewarmed lamp (0.5 J in an empty UV cross-linker right before irradiating the cells). Leave the other half unexposed (UV-) (Figure 1).
Notes:
1. As mentioned in the original protocol [4], the UV +/- conditions facilitate assessment of the extent to which protein extraction using OOPS is UV-dependent.
2. We did not perform the additional RNase control done in the original paper because it was mentioned that 95% of the proteins in the interphase are RNase sensitive [4].
Critical: It is essential to evaluate UV cross-linking efficiency before applying the entire protocol if the study model or culture conditions are modified. We have been testing increasing UV doses and found 1 J/cm2 to be the optimal dose that maximizes RNA–protein cross-linking while using the lowest effective intensity (Figure 2; see the optional section H1–2).
9. Transfer the membrane halves to a 50 mL tube containing 20 mL of cold RNase-free PBS.
10. Shake to resuspend the bacteria on the membrane.
11. Remove (with clean tweezers) the membrane and discard it.
12. Centrifuge the cells at 3,200× g for 15 min at 4 °C.
13. Discard the supernatant and store the pellets at -70 °C.
Note: Although we did not flash-freeze the pellets in liquid nitrogen in our experiments, this step could be implemented to further preserve molecular integrity and immediately halt enzymatic activity.
Pause point: Pellets can be stored at -70 °C for 1 year.
B. Bacterial lysis (Figure 3)
Note: This part of the protocol has been optimized to facilitate lysis of B. subtilis, which has thick cell walls.
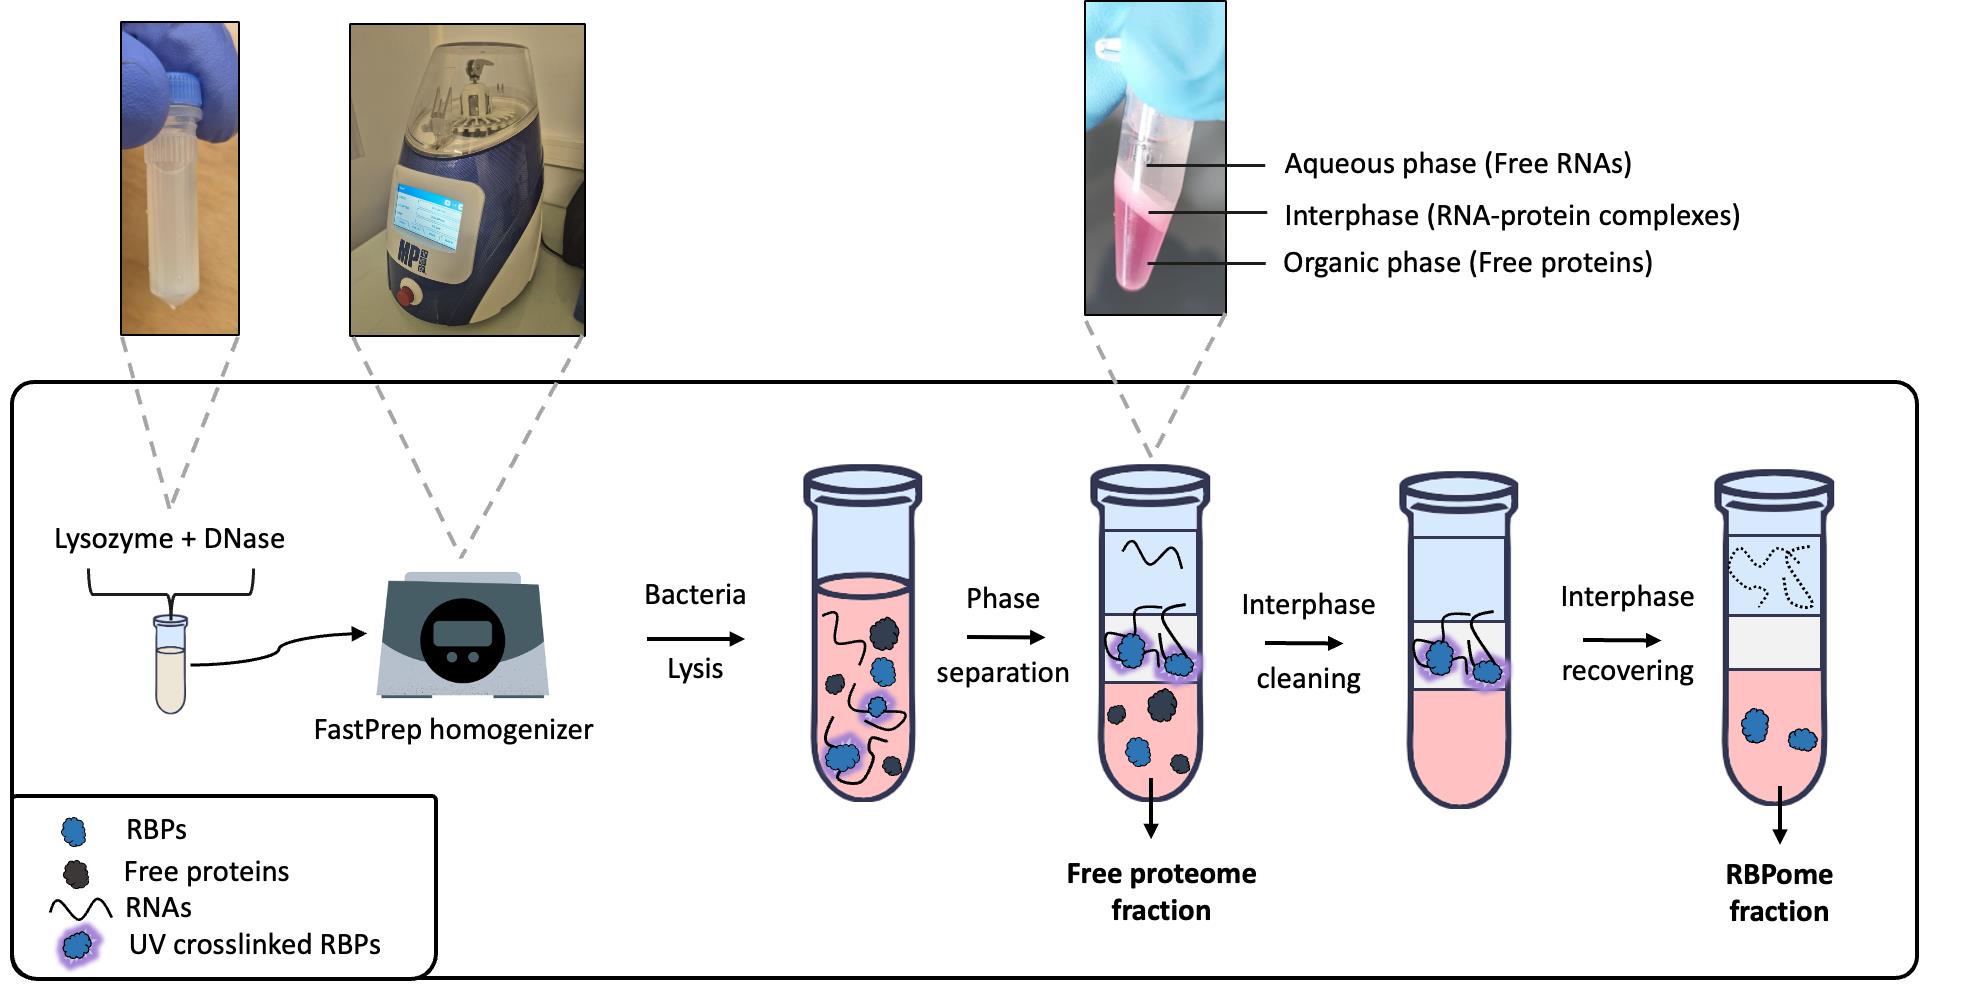
Figure 3. B. subtilis cell lysis and phase separation workflow. First, bacteria are resuspended in a solution containing lysozyme and DNase to degrade peptidoglycan and DNA, and incubated at 37 °C. Following this initial enzymatic lysis step, mechanical lysis is performed using a FastPrep homogenizer. After centrifugation, the clarified lysate is recovered and mixed with TRIzol. The addition of chloroform induces an initial phase separation, partitioning free RNAs in the aqueous phase, RNA–protein complexes in the interphase, and free proteins in the organic phase; each phase is collected separately. The interphase is washed through repeated phase separation steps to enrich UV cross-linked RNA–protein complexes while removing non-cross-linked RNAs and protein contaminants. Finally, after RNase treatment of the interphase, RNA-associated proteins are recovered from the organic phase.
1. Resuspend pellets in 50 μL of lysis solution.
2. Transfer the sample to a FastPrep tube preloaded with 500 mg (close to the 0.5 mL mark) of lysing matrix B bulk beads and incubate at 37 °C for 30 min.
3. Add 150 μL of TRIzol to each sample.
Caution: This chemical is corrosive, irritating, and toxic.
4. Perform bacterial lysis using FastPrep with 6 cycles of 45 s at 6.5 m/s, including a 2-min break between cycles (put the samples on ice during breaks).
Note: The supernatant should generally appear clear; however, for extended cultures (later time points in DSM), it may appear more turbid. Lysis efficiency can be assessed by phase microscopy by comparing cell integrity before and immediately after lysis, especially for pre-spores and spores.
5. Add 1 mL of TRIzol and shake on a tabletop shaker at 1,000 rpm for 5 min at 4 °C.
Caution: This chemical is corrosive, irritating, and toxic.
6. Transfer 1 mL of supernatant to a new tube.
7. Centrifuge at 3,200× g for 10 min at 4 °C.
8. Transfer the supernatant to a new tube.
Critical: The sample should appear homogeneous.
Pause point: Samples can be stored at -70 °C for 1 year.
Optional: To perform both standard OOPS and assess UV cross-linking efficiency, quantify and calculate the ratio between protein-bound RNAs recovered in the interphase (C) and free RNAs present in the aqueous phase. In this case, divide the supernatant obtained in step B8 into two tubes containing 500 μL of supernatant each. Then, add 500 μL of TRIzol to each tube (1 mL total) and proceed with phase separation as described below.
Note: From this point onward, the protocol largely follows the original OOPS procedure [4].
C. Phase separation and interphase cleaning (Figure 3)
1. Add 1:5 volume (v/v, chloroform:TRIzol) of chloroform (200 μL) to the TRIzol homogenate.
Caution: This chemical is toxic.
2. Vortex the sample for 15 s at maximum speed until the sample is homogeneously light-pink.
3. Centrifuge at 12,000× g for 15 min at 4 °C.
4. Carefully transfer the supernatant (free RNA fraction, upper transparent phase) to a clean 1.5 mL tube and store on ice for up to 2 h (or at -70 °C for up to 1 year).
Note: This fraction is required to estimate UV cross-linking efficiency. See the optional section H.
5. (Critical) Pass slowly through the interphase and transfer the lower pink organic phase to another tube (free proteome fraction).
Notes:
1. Use a 20–200 μL pipette equipped with filter tips and apply a moderate suction force. To collect the aqueous phase, slightly tilt the microcentrifuge tube and gently aspirate the liquid by positioning the pipette tip against the tube wall. To collect the organic phase, tilt the tube and place the tip against the tube wall, then carefully pass through the interphase to position the tip at the bottom of the tube and gently aspirate the organic phase. After removal of both the upper and lower phases, no more than 100 μL of liquid should remain in the tube. If a larger volume remains, carefully remove additional aqueous and/or organic phases as appropriate.
2. Free proteome fraction samples can be stored on ice up to 2 h or at -20 °C for 1 month.
3. Go directly to step E14 for processing these samples.
4. Once the supernatant and/or organic phase have been collected, remove as much of the aqueous and/or organic phase as possible, taking care not to take the interphase. Ideally, the TRIzol-to-sample ratio should be at least 10:1 (v/v).
6. Add 1 mL of TRIzol to the interphase.
Caution: This chemical is corrosive, irritating, and toxic.
7. Vortex for 15 s at maximum speed until complete interphase homogenization.
8. Add 1:5 volume chloroform to the interphase TRIzol homogenate.
Caution: This chemical is toxic.
9. Vortex for 15 s at maximum speed until the sample is homogeneously light-pink.
10. Centrifuge at 12,000× g for 15 min at 4 °C.
11. (Critical) Remove the upper aqueous phase as much as possible, taking care not to remove the interphase, and discard it.
12. Pass the pipette tip carefully through the interphase to the bottom of the tube.
13. (Critical) Remove and discard the lower organic phase as much as possible, taking care not to remove the interphase.
14. Optional: Repeat steps C6–13.
Note: In contrast to the original protocol, we only performed two phase separations to increase the yield. Performing a third round of phase separation may lead to a cleaner interphase.
D. Recovering cleaned interphase (Figure 3)
1. Add 9:1 methanol to the interphase (e.g., for a 100 μL sample, add 900 μL of methanol).
Caution: This chemical is flammable and toxic.
2. Invert the tubes three times.
3. Vortex at max speed for 15 s.
4. Pellet the interphases by centrifugation at 14,000× g for 10 min at 4 °C.
5. (Critical) Completely remove and discard the supernatant. Be careful to avoid contamination with organic phase traces (pink). Samples contaminated with phenol will not be efficiently cleaned with C18 desalting and might jeopardize mass spectrometry analysis.
6. (Optional) Add 1 mL of 100% methanol, repeat centrifugation at 14,000× g for 10 min, and discard the supernatant to further clean the interphase.
Caution: This chemical is flammable and toxic.
Pause point: Samples can be stored at -70 °C for 1 year.
E. Recovering RNA-binding proteins for LC–MS/MS using ethanol precipitation (Figure 3)
Note: This section of the protocol is optimized to maximize protein recovery at the expense of potential partial protein degradation, which is not critical for LC–MS/MS analyses.
1. Add 100 μL of 100 mM TEAB supplemented with 1% SDS to the interphase pellets obtained at step D5.
2. Sonicate in ice water for 15 min using a high setting and 30-s sonication/rest cycles.
Note: Sonication initiates breaking the nucleic acid chains present in the interphase.
3. Add 1 mM MgCl2 (final concentration) to enhance RNA hydrolysis, minimally affecting RNase activity.
4. Incubate at 95 °C for 20 min.
5. Cool samples on ice for 2 min.
6. Add 1 μL of RNaceIT cocktail and incubate at 37 °C for 2 h (can be extended to 4 h).
7. Add 1 μL of RNaceIT cocktail and incubate at 37 °C overnight (8–16 h).
8. Add 1 mL of TRIzol to the sample.
Caution: This chemical is corrosive, irritating, and toxic.
9. Homogenize by vortexing at maximum speed for 15 s.
Pause point: Samples can now be stored at -70 °C for 1 year.
10. Add 200 μL of chloroform.
Caution: This chemical is toxic.
11. Homogenize by vortexing at maximum speed for 15 s.
12. Centrifuge at 12,000× g for 15 min at 4 °C.
13. Remove and discard the upper aqueous phase and the interphase.
Note: The interphase contains undigested nucleic acids and other contaminants. Remove it completely. Alternatively, because interphase can be difficult to collect, leave it in the tube, pass the pipette tip through it, and transfer the lower organic phase, without taking the interphase, to a new Lo-Bind protein tube. If using the second option, collect 450 μL of organic phase from the bottom of the tube, leaving 50−80 μL of organic phase with the interphase to ensure that no interphase is transferred to the new tube.
Critical: From this step onward, the same procedure can be applied to the “free protein” samples retained at step C5.
14. Transfer 225 μL of the organic phase to a new Lo-Bind protein tube.
15. Add 900 μL of 100% ethanol.
Caution: This chemical is flammable.
16. Mix the sample by vortexing at maximum speed for 15 s.
17. Centrifuge at maximum speed for 10 min at 4 °C.
18. Remove the supernatant. The pellet should be small if visible.
19. Repeat steps E14–18 until all the collected organic phase is precipitated. Keep using the same tube from step E14 for all precipitations, transferring 225 μL of the organic phase each time per round of centrifugation.
20. Wash the precipitated sample by adding 1 mL of 80% ethanol. Do not vortex.
Caution: This chemical is flammable.
21. Centrifuge at maximum speed for 10 min at 4 °C.
22. Remove the supernatant and leave the tubes to air-dry for 2 min.
Note: It is common at this stage not to see the pellet.
Pause point: Samples can be stored at -20 °C for 1 month.
F. Sample preparation for MS (Figure 4)
Note: Depending on the proteomics platform used, samples may need to be submitted either embedded in polyacrylamide gel or in solution. Please contact the proteomics facility in advance and follow their specific requirements.
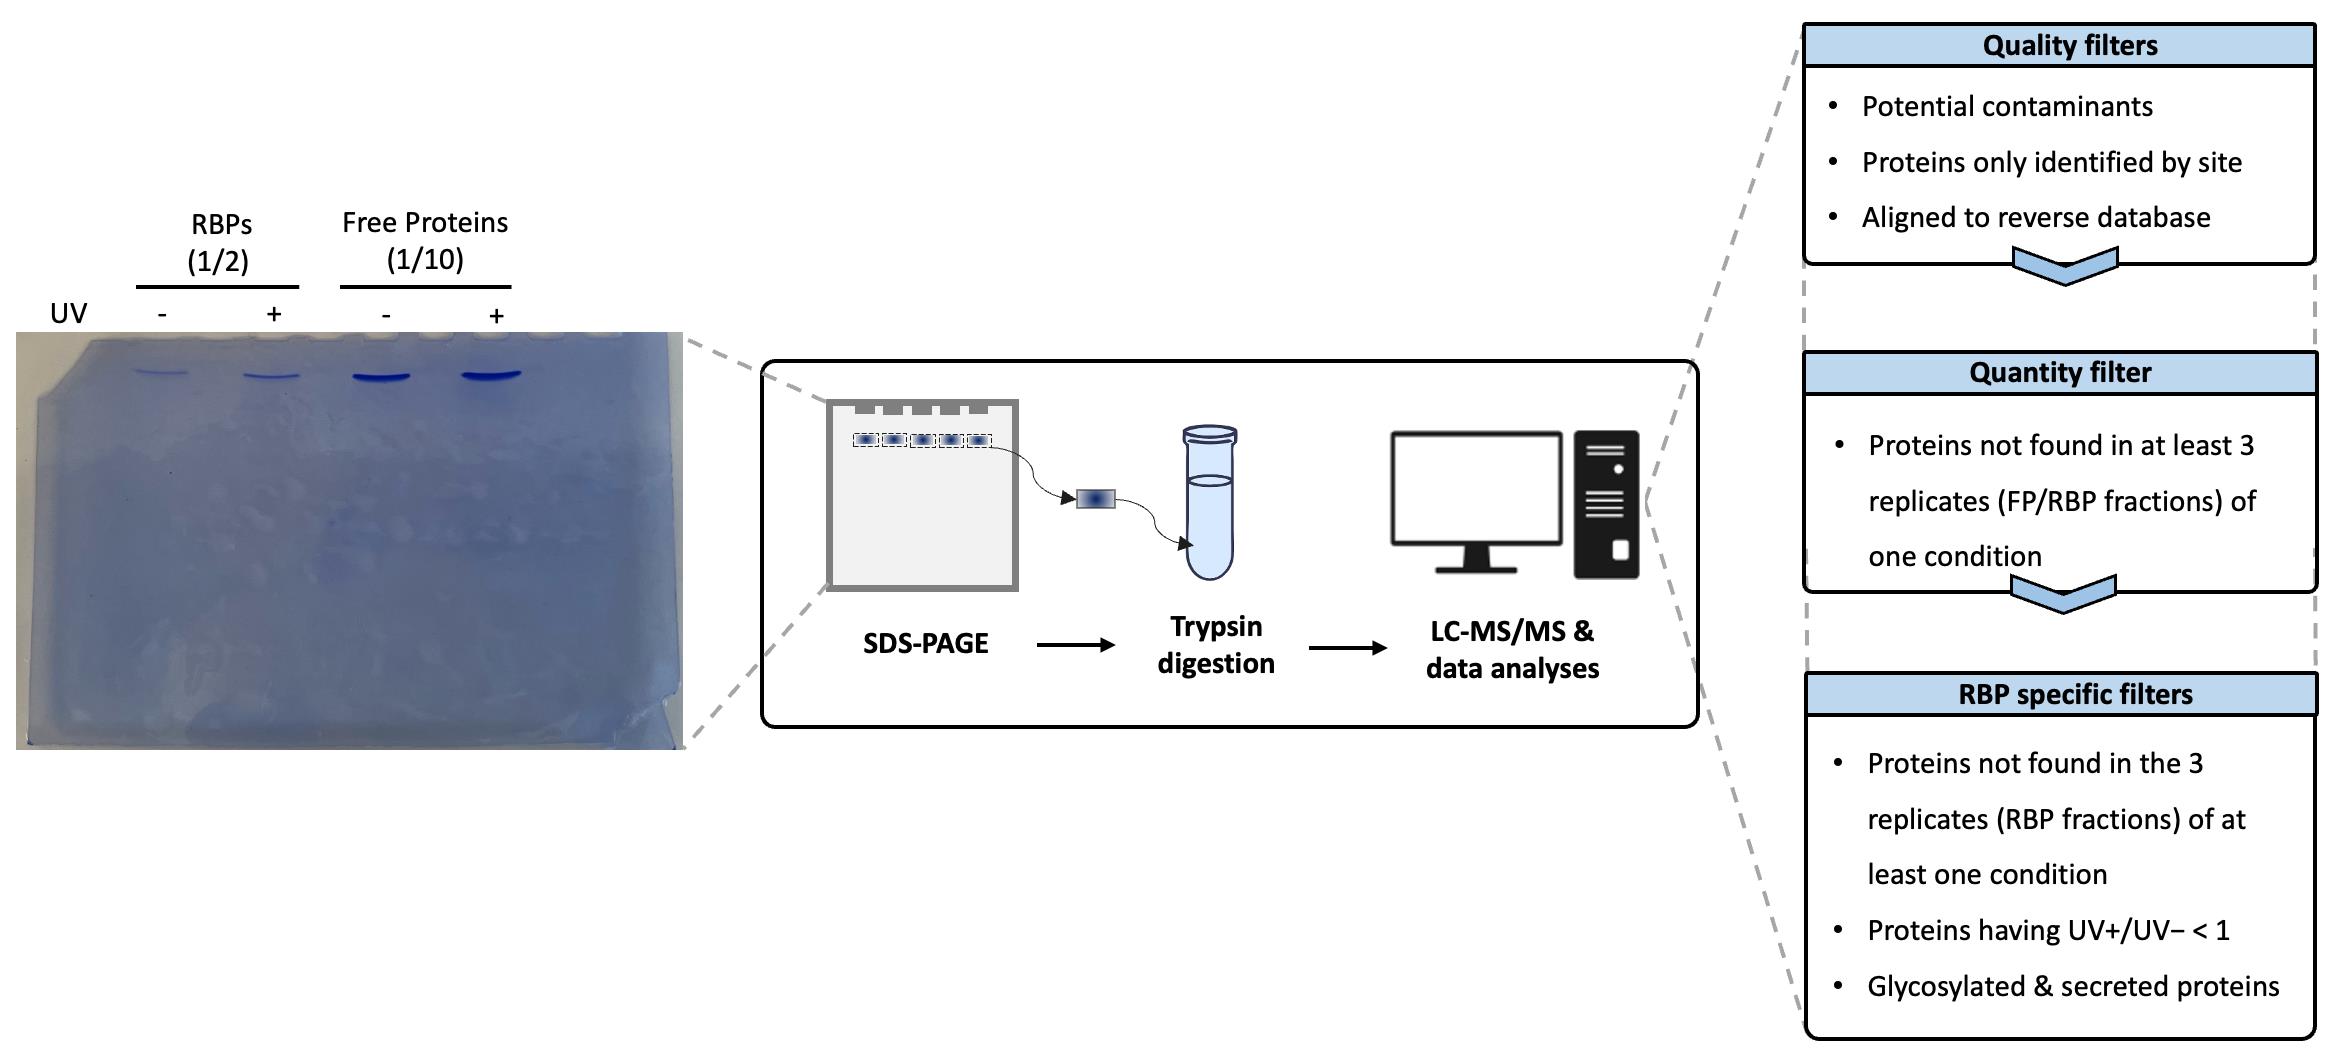
Figure 4. Protein identification by liquid chromatography–mass spectrometry and data analysis. Proteins from the RNA-binding protein (RBP) or free protein fractions are loaded onto an SDS-PAGE (1/2 of recovered RBPs and 1/10th of free proteins) and undergo brief migration through the gel. After staining, the corresponding gel bands are excised, washed, reduced, alkylated, and digested with trypsin/Lys-C. The resulting peptides are then extracted, dried, and resuspended prior to analysis by LC–MS/MS. The peptides are separated using a 2%–50% acetonitrile (ACN) gradient in 0.1% formic acid on a PepMapTM C18 nano-LC column and analyzed on an Orbitrap mass spectrometer. Raw data are subsequently processed using quality, quantitative, and RBP-specific filters to eliminate contaminants and minimize false positive identifications.
F1. Gel migration
1. Add UltraPure water to pellets (100 μL for the free proteome fraction and 20 μL for the RBP fraction).
Note: As the free proteome fraction samples have higher protein levels, we dilute them more than the RBPome fraction samples. This should be considered during the analysis.
2. Transfer 20 μL of free proteome samples to a new tube.
3. Add 5 μL of NuPAGE loading buffer 4× to a 20 μL sample.
4. Alternative: Add 200 μL of 100 mM TEAB and 1% (wt/vol) + DTT to the pellets of the free proteome fraction and 40 μL to the RBP fraction.
5. Denature for 5 min at 65 °C.
6. Install the gel on the apparatus and clean the wells with a syringe.
7. Load aliquots on gel.
8. Run the gel for 3 min at 150 V.
9. Stain in Imperial Blue for 20–40 min.
10. Destain in UltraPure water 3 × 15 min until the gel is white or leave it overnight (Figure 4).
11. Cut the bands.
F2. Trypsin digestion
1. Band washing and discoloration
a. Wash gel with 80 μL of 100 mM ABC and 80 μL of ACN.
Note: Increase the volume if necessary to ensure the gels are fully immersed.
b. Incubate at 400 rpm for 10 min at 37 °C.
Note: If the color is still too intense, leave it for up to 30 min.
c. Remove the supernatant.
d. Repeat steps F2.1a–c at least once more and up to four times to remove any remaining blue coloring.
e. Add 80 μL of ACN and leave for 15 min until the gel turns white.
f. Remove the supernatant.
2. Reduction and alkylation
a. Add 50–80 μL of DTT 10 mM and incubate for 45 min at 56 °C in the dark.
b. Remove the supernatant.
c. Add an equal volume (50–80 μL) of IAA 55 mM and incubate for 30 min at RT in the dark.
d. Remove the supernatant.
3. Reduced and alkylated band washing
a. Add 80 μL of ABC 100 mM and 80 μL of ACN and incubate for 10 min at 400 rpm.
b. Remove the supernatant and repeat a second time.
4. Gel drying to “shrink” bands
a. Add 50 μL of ACN and incubate for a maximum of 15 min or for 10–15 min in speed vacuum V-HV.
b. Remove the supernatant.
c. Let the ACN evaporate for 5 min under the fume cupboard with the tubes open.
5. Trypsin digestion
a. Add 10–20 μL of 1× Trypsin/Lys-C mix depending on the staining or gel size and incubate for 45 min on ice.
Alternative: To improve the digestion of cytoplasmic or soluble proteins, add a final concentration of 0.01% ProteaseMAXTM (e.g., 0.2 μL of 1% stock solution in 20 μL). Use 0.03%–0.05% for highly hydrophobic membrane proteins. Do not exceed 0.05% (risk of peptide loss/MS artefacts).
b. Add 50–80 μL of 25 mM ABC and incubate overnight at 37 °C (at least 6 h).
6. Tryptic digest extraction
a. Do a short spin to collect condensate from stoppers.
b. Transfer the digestion to new tubes (digestion tubes).
c. Add 25–40 μL of acidified water to the gels (0.1%–0.3% TFA or 5% formic acid) and incubate at 400 rpm for 5 min at RT.
d. Add 25–40 μL of ACN to the gels and incubate at 400 rpm for 5 min at RT.
e. Transfer the supernatant to the digestion tubes.
f. Repeat steps F2.6c–e.
7. Sample drying
a. Dry samples for 2–4 h in a speed vacuum (V-HV position).
b. Store at 4 °C.
8. Sample resuspension
a. Resuspend peptide samples with loading buffer containing 0.05% TFA and 2% ACN in ultrapure H2O (prepared extemporaneously) in 10 μL (3 μL are used for injection at step G1).
b. Sonicate for 5–10 min on ice.
c. Transfer into new tubes and shortly spin to remove potential bubbles.
G. Mass spectrometry
1. Peptides (3 μL out of the 10 μL resuspended at step F2.8a) are trapped on a C18 PepMap 300 trap column (300 μm × 5 mm, 5 μm, 300 Å) and separated on an EASY-SprayTM PepMapTM Neo capillary column (75 μm × 50 cm or 75 μm × 15 cm, 2 μm, 100 Å) at a flow rate of 250 nL/min.
2. The mobile phases consist of 0.1% formic acid in water (A) and 80% ACN/20% water with 0.1% formic acid (B). The gradient elution is from 2% to 25% B over 90 min, followed by an increase to 50% B over 20 min.
3. Acquire MS spectra at a resolution of 70,000 over a mass range of 350–1,900 m/z, with a maximum injection time of 100 ms.
4. Record fragmentation spectra of the 10 most abundant precursors with charge states ≥2 (Top10 method in Data-Dependent Acquisition mode) using high-energy collision dissociation (HCD) with a normalized collision energy of 27%.
5. Process raw data and search against the B. subtilis database (Taxonomy ID: 224308, downloaded from UniProt on 2022-10-17) using Proteome Discoverer 3.0.
6. Perform protein identification with the Sequest HT algorithm using the following parameters:
a. Dynamic modifications: methionine oxidation.
b. N-terminal acetylation and N-terminal methionine loss.
c. Static modification: carbamidomethylation of cysteines.
d. Mass tolerances: 10 ppm for precursor ions and 0.02 Da for fragment ions.
e. Up to three missed tryptic cleavages.
7. Conduct label-free quantification based on precursor ion intensities, with normalization to the total peptide amount.
H. (Optional) Estimate UV cross-linking efficiency (Figure 2)
1. Recovering free RNA from the first upper phase (collected at step C4)
a. Add 600 μL of 100% propan-2-ol and vortex for 15 s at maximum speed.
Caution: This chemical is flammable and irritating.
b. Precipitate for 10 min in ice.
c. Centrifuge at maximum speed for 10 min at 4 °C.
d. Remove and discard all the supernatant using a pipette.
Critical: Avoid disturbing the pellet, which might be difficult to see; follow this advice until step H1j.
e. Add 900 μL of 100% ethanol.
Caution: This chemical is flammable.
f. Centrifuge at maximum speed for 5 min at 4 °C.
g. Remove and discard all the supernatant using a pipette.
h. Add 900 μL of 70% (v/v) ethanol.
Caution: This chemical is flammable.
i. Centrifuge at maximum speed for 5 min at 4 °C.
j. Remove and discard all the supernatant using a pipette.
k. Air-dry for 5 min at RT.
l. Resuspend the pellet in 20 μL of RNase-free water.
Pause: Free RNAs can be stored at -70 °C for 1 year.
2. Recovering protein-bound RNAs from interphase (collected at step D5)
a. Prepare proteinase K solution by adding 20 μL of proteinase K (20 mg/mL) to 300 μL of proteinase K buffer (10 mM Tris-HCl, pH 8, 10 mM EDTA) per sample.
Caution: EDTA is irritating and toxic.
b. Incubate the solution in the thermo shaker at 400 rpm for 15 min at 50 °C.
Critical: Incubation of the enzyme and buffer mix removes any RNase contamination from the solutions. This is an important step considering the temperature and length of the incubation.
c. Add 300 μL of proteinase K solution to the precipitated interphase from step D5.
Note: The interphase is really sticky at this point. Do not try to solubilize it with the pipette. Proteinase K digests the proteins present in the interphase without the need to solubilize beforehand.
d. Incubate in the thermo shaker at 400 rpm for 2 h at 50 °C.
e. Add 300 μL of phenol:chloroform:isoamyl alcohol (v/v, 25:24:1).
Caution: This chemical is corrosive, irritating, and toxic.
f. Vortex at maximum speed for 15 s.
g. Centrifuge at 12,000× g for 15 min at 4 °C.
h. Transfer the upper aqueous phase to a new tube, taking extra care to avoid the interphase. Add 50 μL of NaAc and 600 μL of 100% propan-2-ol.
Caution: This chemical is flammable and irritating.
i. Vortex for 15 s at maximum speed.
j. Incubate for 10 min in ice. Ice incubation helps with nucleic acid precipitation.
k. Centrifuge at maximum speed for 10 min at 4 °C.
l. Remove and discard all the supernatant using a pipette, taking care not to disturb the pellet (which may be translucent).
m. Add 900 μL of 100% ethanol, not disturbing the pellet.
Caution: This chemical is flammable.
n. Centrifuge at maximum speed for 5 min at 4 °C.
o. Remove and discard all the supernatant using a pipette.
p. Add 900 μL of 70% (v/v) ethanol.
Caution: This chemical is flammable.
q. Centrifuge at maximum speed for 5 min at 4 °C.
r. Remove and discard all the supernatant using a pipette.
s. Air-dry for 5 min at RT.
t. Resuspend the pellet in 100 μL of RNase-free water.
Pause point: Protein-bound RNAs can be stored at -70 °C for 1 year.
Notes:
1. Integrity and quantity can be checked by the separation of 1/20th free RNA fraction (5 μL) and 1/3rd protein-bound RNA fraction (6.6 μL) on a 1% agarose gel after denaturation at 65 °C for 10 min.
2. Quantification of total RNAs in each fraction allows calculation of the ratio between protein-bound RNAs and free RNAs to estimate UV cross-linking efficiency.
3. Calculation of the ratio should also be done in a non-cross-linked sample and should be below 5%. If it is above 5%, it might reveal an inefficient lysis or insufficient interphase washing.
Data analysis
Proteomics analysis
1. The databank was the same as the one used for Proteome Discoverer analysis.
2. MS/MS data are processed using Perseus software for label-free quantification [6].
Note: We chose to use Perseus because it is specifically designed for the downstream analysis of quantitative proteomics data, offering great flexibility to interactively manipulate matrices (filters, normalization, imputation, annotations, statistical tests, PCA, clustering). This approach better suits our needs for exploration, condition comparisons, and biological interpretation, whereas Proteome Discoverer is primarily optimized for the identification/quantification part and managing analysis workflows on raw files.
3. Maximum missed cleavages by trypsin were set to 3, carbamidomethyl of cysteines was set as the fixed modification, and oxidation of methionines and acetylation of N-terminal were the variables.
4. Match between runs was used with a match time window of 0.7 min and an alignment time window of 20 min. All other parameters were left to default.
5. The ProteinGroup.txt file generated by MaxQuant was uploaded to the Perseus software (v 1.6.15) [7], downloaded from https://maxquant.net/perseus.
6. We applied quantity and quality filters (Figure 4) to the two fractions (free proteins and RBPs) to preserve only the proteins robustly identified in at least three replicates from one condition. To avoid proteins that could be found at the interphase independently of their RNA binding ability, proteins showing a CL+/CL- ratio lower than 1 and proteins annotated as secreted and glycoproteins were filtered out from identified RBPs.
7. Missing values were replaced with a normal distribution.
8. Subsequently, you may isolate proteins exclusively detected in the RBP fraction and extract label-free quantification intensities (LFQ) for in-depth analysis using Excel or other data analysis tools.
9. For our study, which is dynamic, we calculated a "fraction correlation coefficient" for each protein identified in the free protein (FP) fraction and/or RBP fraction to assess differences in the recovery of one protein in both fractions according to the following formula [1]:
Beyond enabling us to conclude that the RNA-binding profile during sporulation was independent of protein production, it allowed us to estimate the capacity of RBPs to transiently or constitutively bind RNAs.
10. Additionally, we created a general overview of our data by clustering proteins according to their production levels and RNA-binding profiles during sporulation [1].
Validation of protocol
The robustness and reproducibility of the method were validated by analyzing variability in experimental replicates using Pearson's correlation and principal component analysis. Additionally, by following LFQ intensity distributions across time points in both fractions, we demonstrate that the recovery of a protein in the RBP fraction is independent of its production level (free protein fraction). Furthermore, gene ontology (GO) terms enrichment analysis revealed that seven of the ten most enriched GO terms are associated with RNA function. Finally, beyond the numerous known RBPs recovered through our approach, we selected proteins such as SpoVR, for which the ability to bind RNA was unknown. Through a complementary approach, we confirmed that SpoVR binds RNA. This highlights the relevance of the OOPS data.
This protocol (or parts of it) has been used and validated in the following research article(s):
• Queiroz et al. [3]. Comprehensive identification of RNA-protein interactions in any organism using orthogonal organic phase separation (OOPS), Nat Biotechnol. 2019.
• Villanueva et al. [4]. Efficient recovery of the RNA-bound proteome and protein-bound transcriptome using phase separation (OOPS), Nat Protoc. 2020.
• Kaboré et al. [1]. Remodeling of RNA-binding proteome and RNA-mediated regulation as a new layer of control of sporulation. mSystems. 2025 (Figure S1, panel ABC; Figure 4, panel ABC).
General notes and troubleshooting
General notes
1. Yield: As a reference, although protein and RNA yields may vary between experiments, the values below provide an estimate of typical recoveries and relative proportions between fractions. We recovered approximately 450–600 μg of free RNAs and from ~5 μg (for non-UV-irradiated samples) to ~140 μg of protein-bound RNAs (for UV-irradiated samples following optimized UV cross-linking conditions). For proteins, the UV-treated RBP fraction contained ~2.5-fold more protein (≈3 μg) than the corresponding non-irradiated samples (≈1.2–1.5 μg). In contrast, UV treatment did not affect protein recovery in the free-protein fraction, which consistently yielded ≈30 μg of protein.
2. Limitations and technical considerations: This protocol was specifically calibrated to follow RBPome dynamics during sporulation. Lysis conditions were optimized for samples collected up to 12 h after the onset of sporulation, which predominantly contain prespores and only a limited fraction of mature spores. Importantly, we did not aim to maximize the lysis of fully mature spores, as our primary objective was to identify upstream post-transcriptional regulators acting during sporulation, rather than RNA–protein complexes present in dormant spores.
Comprehensive analysis of RNA–protein complexes in mature spores presents several challenges. A major constraint is UV cross-linking efficiency, as the multi-layered spore structure provides substantial protection from UV radiation. This limitation is illustrated by a significant decrease in correlation between replicates, likely due to the variability in the proportion of mature spores across samples. Consequently, extending this protocol to mature spores will require rigorous re-optimization to achieve an appropriate balance between efficient mechanical lysis, sufficient cross-linking efficiency, and preservation of RNA–RBP complexes. In addition, mature spores contain a higher proportion of glycoproteins than vegetative cells, as these are abundant in the various protective layers of spores. Consequently, the increased presence of these contaminants could likely negatively impact the depth of proteomic analysis and quantitative accuracy.
Consistently, UV cross-linking efficiency in B. subtilis was markedly lower than that reported for E. coli using the original protocol; while cross-linking efficiencies exceeding 50% were achieved in E. coli with 700 mJ/cm2 UV dose, we observed a maximum of ~23% cross-linking in B. subtilis even at 1 J/cm2 (Figure 2). This difference is in line with the thicker cell wall of B. subtilis, which confers increased protection against UV irradiation and consequently reduces cross-linking efficiency.
Troubleshooting
Note: Most of the information in this section is taken from the original article [4].
Problem 1: Non-lysed pre-spores and spores (see section B).
Possible cause: Inefficient cell lysis.
Solution: Increase the incubation time and lysozyme concentration to effectively lyse these cells. Scaling down starting material can improve lysis.
Problem 2: Aggregates in TRIzol lysis (see section B).
Possible causes: Inefficient cell lysis or incomplete removal of cellular debris.
Solution: Inefficient cellular disruption might lead to remnants of the cell wall, which may populate the interphase during phase separation. If cellular lysis has already been optimized, increase the speed at which you pellet the cellular debris. This spin takes place after cell lysis and resuspension in TRIzol and should not surpass 12,000× g. Scaling down the starting material can improve lysis.
Problem 3: Low cross-linking efficiency (see step H2).
Possible causes: B. subtilis cell wall, spores, and the protective layers of spores block UV at 254 nm, which has low penetrance. Any shadowing of the lower layer of cells by the upper layers can affect cross-linking efficacy. Media absorbance of UV light at 254 nm may hinder crosslinking.
Solutions: Ensure cells are as close as possible to a monolayer. Diminish the volume of liquid covering the cells or the number of cells per membrane. If possible, cross-link your cells when dry. Any pigments within colored cell growth media might absorb UV light at 254 nm. Check if the media is lowering the UV cross-link. Exposing cells to UV at other wavelengths that are more penetrating but may have less effect on RNA–protein interactions is an approach that may be worth exploring.
Problem 4: Proteins in the non-cross-linked control interphase (see section E).
Possible cause: Many RBPs (mainly ribosomal proteins and proteins strongly bound to RNA) can be found in the interphase in the absence of cross-linking. However, you should at least recover twice the amount of proteins in UV-irradiated interphases compared to non-UV-treated samples (refer to General note 1). A smaller ratio between both conditions could reflect problems in cell lysis, too much starting material, or inefficient interphase washes.
Solutions: The interphase has to be completely homogenized when doing the repeated chloroform/TRIzol phase separations. Inefficient interphase homogenization impedes the release of the interphase contaminants from the interphase in the washing steps. Check cellular lysis. If cell lysis and interphase homogenization are not likely to be the source of the problem, scale down the starting material.
Problem 5: Low quantity of proteins recovered from the interphase (less than 1 μg).
Note: After trypsin digestion, it is possible to estimate peptide quantity using the Qubit Protein kit or another peptide quantitation method following the manufacturer’s instructions.
Possible causes: Insufficient digestion of the RNAs and low RBPs yield in the chosen biological system.
Solutions: Use a new batch of RNase. Start a new experiment and use 0.1 μg of modified trypsin per sample to avoid saturation of the sample trypsin signal. Scale up the starting material.
Acknowledgments
The authors want to acknowledge Dr. Anne Galinier for support and helpful discussions, and Maya Belguazi, Christophe Verthuy, and Régine Lebrun for the proteomics analysis in the original paper. Specific contributions of each author: Conceptualization, C.D.F.; Investigation, T.K. and C.D.F.; Writing—Original Draft, T.K.; Writing—Review & Editing, T.K. and C.D.F.; Funding acquisition, C.D.F.; Supervision, C.D.F. We thank IM2B starting support, CNRS, and AMU for funding. This protocol was originally described and validated in other organisms in Queiroz et al. [3] and Villanueva et al. [4]. It was adapted and validated in B. subtilis in Kaboré et al. [1].
Competing interests
The authors have no conflicts of interest or competing interests with respect to this work.
Ethical considerations
This work did not use human or animal subjects and has no ethical considerations.
References
- Kaboré, T., Belghazi, M., Verthuy, C., Galinier, A. and Delan-Forino, C. (2025). Remodeling of RNA-binding proteome and RNA-mediated regulation as a new layer of control of sporulation. mSystems. 10(9): e00496–25. https://doi.org/10.1128/msystems.00496-25
- Nicolas, P., Mäder, U., Dervyn, E., Rochat, T., Leduc, A., Pigeonneau, N., Bidnenko, E., Marchadier, E., Hoebeke, M., Aymerich, S., et al. (2012). Condition-dependent transcriptome reveals high-level regulatory architecture in Bacillus subtilis. Science. 335(6072): 1103–1106. https://doi.org/10.1126/science.1206848
- Queiroz, R. M. L., Smith, T., Villanueva, E., Marti-Solano, M., Monti, M., Pizzinga, M., Mirea, D.-M., Ramakrishna, M., Harvey, R. F., Dezi, V., et al. (2019). Comprehensive identification of RNA–protein interactions in any organism using orthogonal organic phase separation (OOPS). Nat Biotechnol. 37(2): 169–178. https://doi.org/10.1038/s41587-018-0001-2
- Villanueva, E., Smith, T., Queiroz, R. M. L., Monti, M., Pizzinga, M., Elzek, M., Dezi, V., Harvey, R. F., Ramakrishna, M., Willis, A. E., et al. (2020). Efficient recovery of the RNA-bound proteome and protein-bound transcriptome using phase separation (OOPS). Nat Protoc. 15(8): 2568–2588. https://doi.org/10.1038/s41596-020-0344-2
- Chu, L.-C., Arede, P., Li, W., Urdaneta, E. C., Ivanova, I., McKellar, S. W., Wills, J. C., Fröhlich, T., Von Kriegsheim, A., Beckmann, B. M., et al. (2022). The RNA-bound proteome of MRSA reveals post-transcriptional roles for helix-turn-helix DNA-binding and Rossmann-fold proteins. Nat Commun. 13(1): 2883. https://doi.org/10.1038/s41467-022-30553-8
- Tyanova, S., Temu, T. and Cox, J. (2016). The MaxQuant computational platform for mass spectrometry-based shotgun proteomics. Nat Protoc. 11(12): 2301–2319. https://doi.org/10.1038/nprot.2016.136
- Tyanova, S., Temu, T., Sinitcyn, P., Carlson, A., Hein, M. Y., Geiger, T., Mann, M. and Cox, J. (2016). The Perseus computational platform for comprehensive analysis of (prote)omics data. Nat Methods. 13(9): 731–740. https://doi.org/10.1038/nmeth.3901
Article Information
Publication history
Received: Dec 17, 2025
Accepted: Jan 27, 2026
Available online: Feb 9, 2026
Published: Mar 5, 2026
Copyright
© 2026 The Author(s); This is an open access article under the CC BY-NC license (https://creativecommons.org/licenses/by-nc/4.0/).
How to cite
Kaboré, T. and Delan-Forino, C. (2026). Dynamic Mapping of RNA-Binding Proteins During Bacillus subtilis Sporulation Using Orthogonal Organic Phase Separation. Bio-protocol 16(5): e5622. DOI: 10.21769/BioProtoc.5622.
Category
Microbiology > Microbial proteomics
Molecular Biology > Protein
Do you have any questions about this protocol?
Post your question to gather feedback from the community. We will also invite the authors of this article to respond.