- Protocols

- Articles and Issues
- For Authors
- About
- Become a Reviewer

Deaminase-Assisted Sequencing for the Identification of 5-glyceryl-methylcytosine
Published: Vol 16, Iss 4, Feb 20, 2026 DOI: 10.21769/BioProtoc.5601 Views: 395
Reviewed by: Anonymous reviewer(s)
Original research article
The authors used this protocol in:
Oct 2025
Advertisement


Protocol Collections
Comprehensive collections of detailed, peer-reviewed protocols focusing on specific topics


Abstract
DNA epigenetic modifications play crucial roles in regulating gene expression and cellular function across diverse organisms. Among them, 5-glyceryl-methylcytosine (5gmC), a unique DNA modification first discovered in Chlamydomonas reinhardtii, represents a novel link between redox metabolism and epigenetic regulation. Accurate genome-wide detection of 5gmC is essential for investigating its biological functions, yet no streamlined method has been available. Here, we present deaminase-assisted sequencing (DEA-seq), a simple and robust approach for base-resolution mapping of 5gmC. DEA-seq employs a single DNA deaminase that efficiently converts unmodified cytosines (C) and 5-methylcytosine (5mC) into uracils or thymines, while leaving 5gmC intact. This selective resistance generates a clear sequence signature that enables precise identification of 5gmC sites across the genome. The method operates under mild reaction conditions and is compatible with low-input DNA, minimizing sample loss and improving detection sensitivity. Overall, DEA-seq provides an accessible, efficient, and highly accurate protocol for profiling 5gmC, offering clear advantages in workflow simplicity, DNA integrity, and analytical performance.
Key features
• A commercial deaminase mix (DEA) efficiently converts unmodified cytosines and 5-methylcytosines into uracils or thymines.
• 5gmC specifically resists DEA-mediated deamination, enabling its identification at single-base resolution.
• DEA-seq requires only minimal DNA input and supports high-sensitivity detection from nanogram-level samples.
Keywords: 5-glyceryl-methylcytosine (5gmC)Graphical overview
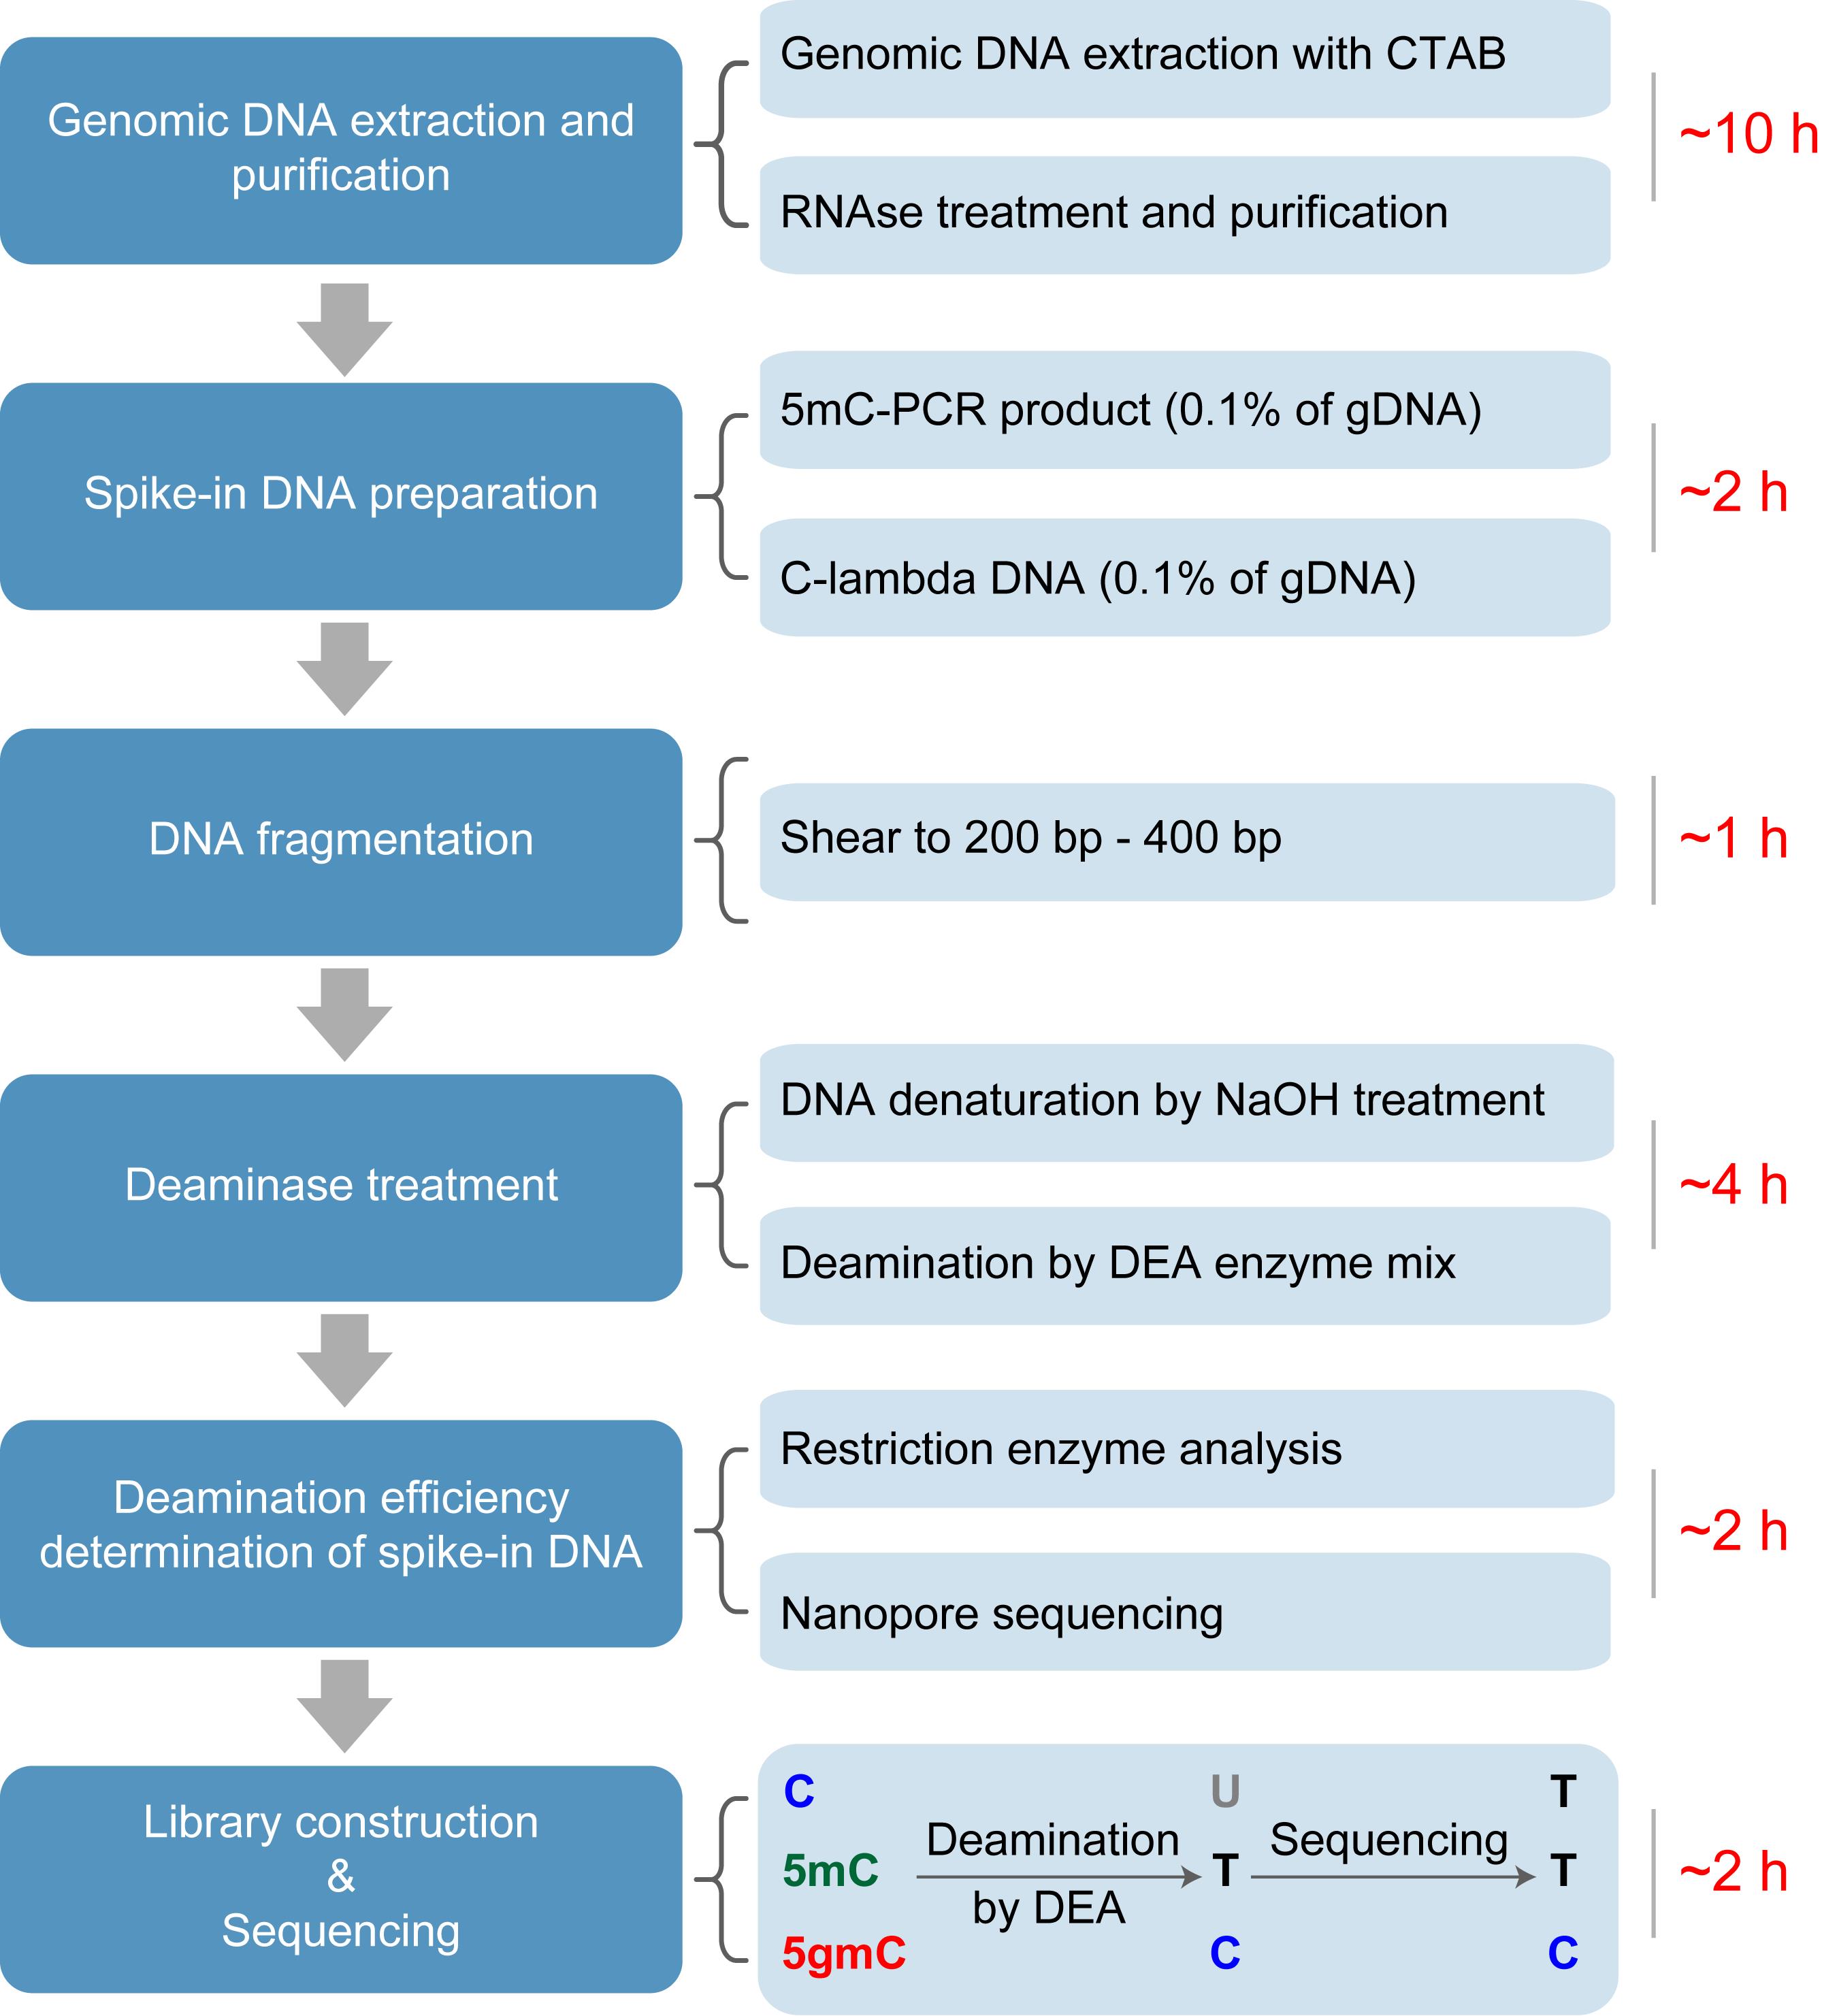
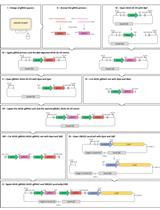
The workflow of deaminase-assisted sequencing (DEA-seq). Genomic DNA is extracted from Chlamydomonas reinhardtii following a standard protocol. After RNA removal using an RNase A/T1 mix, the DNA is further purified by ethanol precipitation. Unmodified lambda DNA and PCR-amplified 5mC-DNA are then added as spike-ins, followed by ultrasonic shearing of the mixture into ~300 bp fragments. The fragmented DNA is denatured into single-stranded DNA (ssDNA) using NaOH treatment. After deaminase treatment, unmodified cytosines and 5mC are converted into uracils and thymines, respectively, while 5gmC remains resistant to deamination. Following PCR amplification and sequencing, both U and T are read as T, whereas 5gmC is retained as C, enabling precise identification of 5gmC at single-base resolution.
Background
DNA methylation in eukaryotes primarily occurs at the fifth carbon of cytosines (C), forming 5-methylcytosine (5mC). In mammals, ten-eleven translocation (TET) enzymes catalyze the stepwise oxidation of 5mC to produce 5-hydroxymethylcytosine (5hmC), 5-formylcytosine (5fC), and 5-carboxylcytosine (5caC), which can contribute to both active and passive DNA demethylation [1]. In the unicellular green alga Chlamydomonas reinhardtii, a TET homologue named 5mC modifying enzyme 1 (CMD1) catalyzes a distinct reaction that converts 5mC into 5-glyceryl-methylcytosine (5gmC) using vitamin C, rather than α-ketoglutarate, as a co-substrate [2,3]. This unusual enzymatic activity not only expands the repertoire of cytosine modifications in eukaryotic genomes but also provides a direct mechanistic link between redox metabolism and epigenetic regulation. 5gmC may function as an intermediate in DNA demethylation and plays an essential role in the feedback regulation of photosynthesis in C. reinhardtii [2]. Importantly, mass spectrometry–based analyses have shown that 5mC and 5gmC are the only cytosine modifications detected in the C. reinhardtii genome, with no evidence for the presence of oxidized cytosine derivatives such as 5hmC, 5fC, or 5caC [2,4]. However, its genome-wide distribution and potential function as an independent epigenetic mark remain poorly understood. Accurate detection of 5gmC is crucial for functional studies but remains technically challenging because this modification does not alter Watson–Crick base pairing and therefore cannot be distinguished from unmodified cytosines or 5mC using conventional sequencing approaches.
Bisulfite sequencing (BS-seq) is widely considered the gold standard for base-resolution mapping of 5mC, but its harsh chemical treatment causes substantial DNA degradation and compromises sequencing quality [5]. More importantly, BS-seq cannot discriminate among different cytosine modifications, such as 5mC and 5hmC. Several BS-seq-derived methods have been developed to address this limitation. For example, TET-assisted bisulfite sequencing (TAB-seq) profiles 5hmC by protecting it with β-glucosyltransferase (β-GT) and selectively deaminating 5mC and unmodified C through TET oxidation followed by bisulfite treatment [6]. Other methods independent of BS-seq have also been established, including TET-assisted pyridine borane sequencing (TAPS) for detecting 5mC and 5hmC [7] and APOBEC-coupled epigenetic sequencing (ACE-seq), which enables reliable identification of 5hmC [8,9]. However, these techniques typically involve multiple enzymatic or chemical steps and may suffer from incomplete conversion or false-positive signals, particularly when detecting rare DNA modifications. Previously, a TET-coupled bisulfite sequencing (TET-BS-seq) approach was developed to distinguish 5gmC from 5mC, taking advantage of the resistance of 5gmC to both TET-mediated oxidation and bisulfite deamination [2]. Nevertheless, given the extremely low abundance of 5gmC in the genome (~10 ppm of total cytosines) [10], the accuracy and sensitivity of TET-BS-seq remain limited.
To address these challenges, we developed deaminase-assisted sequencing (DEA-seq), a simplified and efficient method for genome-wide identification of 5gmC [4]. This approach employs a commercial DNA deaminase enzyme mix (DEA), which is capable of converting unmodified C and 5mC into uracils or thymines, while leaving 5gmC unaffected. The selective resistance of 5gmC to DEA-mediated deamination mirrors the chemical protection observed for 5-glycosyloxymethylcytosine (5ghmC) in ACE-seq [8], enabling precise discrimination of 5gmC in a single-step reaction. DEA-seq thus provides a robust and streamlined protocol for detecting 5gmC at base resolution, facilitating further exploration of its biological functions and regulatory mechanisms in C. reinhardtii.
Materials and reagents
Biological materials
1. Chlamydomonas reinhardtii strains (CC-125, wild type mt+; and CC-5325, cw15 mt-)
Reagents
1. TaKaRa TaqTM Hot Start Version (Takara, catalog number: R007A)
2. RNase A/T1 mix (Thermo Fisher Scientific, catalog number: EN0551)
3. HpyCH4IV (TaiI) (NEB, catalog number: R0619S)
4. FastDigest SsiI (AciI) (Thermo Fisher Scientific, catalog number: FD1794)
5. 5-methyl-dCTP (2.5 mM) (NEB, catalog number: N0356S)
6. dATP (100 mM) (Takara, catalog number: 4026)
7. dTTP (100 mM) (Takara, catalog number: 4029)
8. dGTP (100 mM) (Takara, catalog number: 4027)
9. NaOH (Macklin, catalog number: S817971)
10. Agarose (BBI, catalog number: A620014)
11. 100 bp DNA ladder (TransGen Biotech, catalog number: BM301-01)
12. 1 kb DNA ladder (TransGen Biotech, catalog number: BM201-01)
13. 10× loading buffer (Takara, catalog number: 9157)
14. lambda DNA (dam-, dcm-) (Takara, catalog number: 3019)
15. DNA Clean & Concentrator-5 (Zymo Research, catalog number: D4013) (contains DNA binding buffer, DNA wash buffer, DNA elution buffer, Zymo-SpinTM columns, and collection tubes)
16. EpiArt DNA Enzymatic Methylation kit (Vazyme, catalog number: EM301) (contains oxidation reaction buffer, oxidation reaction S, oxidation reagent, oxidation enzyme 1, oxidation enzyme 2, active reagent, stop reagent, DEA reaction buffer, BSA, DEA enzyme mix, and dilution buffer)
17. EpiArt DNA Methylation Library kit for Illumina V3 (Vazyme, catalog number: NE103) (contains 3′ ligation buffer, 3′ ligation enzyme mix, 3′ adapter, extension primer, extension enzyme mix, 5′ ligation mix, 5′ adapter, and VAHTS HiFi Amplification Mix V3)
18. VAHTS multiplex oligos set 4/5 for Illumina (Vazyme, catalog number: N321/N322-01)
19. QubitTM ssDNA Assay kit (Thermo Fisher Scientific, catalog number: Q10212) (contains QubitTM ssDNA reagent, QubitTM ssDNA buffer, QubitTM ssDNA standard #1, and QubitTM ssDNA standard #2)
20. SanPrep Column DNA Gel Extraction kit (Sangon, catalog number: B518131) (contains buffer B2, wash solution, elution buffer, spin columns, and collection tubes)
21. Tris (Solarbio, catalog number: T8060)
22. Glacial acetic acid (Solarbio, catalog number: A801295)
23. EDTA (Solarbio, catalog number: E8040)
24. Phenol-chloroform (Meryer, catalog number: N09169-500ML)
25. Ethanol (Sinopharm, catalog number: 10009259)
26. Chloroform (Sinopharm, catalog number: 10006818)
27. Isopropanol (Sinopharm, catalog number: 80109218)
Note: All reagents should be stored according to the manufacturer’s instructions. The DEA enzyme mix is critical for this protocol because it exhibits specific deamination activity toward unmodified cytosine and 5mC, but not 5gmC. In contrast, other reagents may be substituted with suitable alternatives, provided that equivalent performance is validated.
Solutions
1. 50× TAE and 1× TAE (see Recipes)
Recipes
1. 50× TAE and 1× TAE
a. Dissolve 242 g of Tris base in deionized water and add 57.1 mL of glacial acetic acid and 100 mL of 0.5 M EDTA (pH 8.0). Adjust the final volume to 1 L with deionized water and mix thoroughly.
b. Dilute the 50× TAE stock solution with deionized water to prepare 1× TAE working solution.
Laboratory supplies
1. QubitTM assay tubes (Thermo Fisher Scientific, catalog number: Q32856)
2. 1.5 mL tubes (QINI, catalog number: CN.0100015S)
3. 0.2 mL PCR tubes (QINI, catalog number: CN.0100002S)
Equipment
1. Pipettes (2.5 μL, 20 μL, 200 μL and 1,000 μL) (Eppendorf)
2. M220 Focused ultrasonicator (Covaris, catalog number: M220)
3. NanoDrop One (Thermo Fisher Scientific, catalog number: 840-317400)
4. ProFlexTM 3 × 32-well PCR system (Thermo Fisher Scientific, catalog number: 4484073)
5. QubitTM 4 fluorometer (Thermo Fisher Scientific, catalog number: Q33238)
6. VAHTS DNA clean beads (Vazyme, catalog number: N411-01)
7. Centrifuge (Eppendorf, model: Centrifuge 5425/5425 R)
8. Mini centrifuge (Joanlab, model: MC-4K)
9. Vortex mixer (Joanlab, model: VM-400-VM-400Max)
10. Gel image analysis system (Tanon, catalog number: 21TMINI1000-11141)
11. Electrophoresis system (Tanon, catalog number: EPS600)
12. Scalpels (Leica, catalog number: DB80LX)
Software and datasets
1. Trimmomatic (v0.39, http://www.usadellab.org/cms/?page=trimmomatic)
2. Bismark (v0.24.2, https://felixkrueger.github.io/Bismark/)
Procedure
A. Genomic DNA extraction and purification
Note: Genomic DNA can be prepared from various sample types or species. In this protocol, DEA-seq was applied to profile 5gmC in the genome of C. reinhardtii.
1. Genomic DNA was extracted using the standard CTAB method as previously described [2]. Typically, approximately 20 μg of unpurified genomic DNA can be obtained from 50 mL of algal culture. Since less than 1 μg of purified genomic DNA is required for DEA-seq, 50 mL of algal culture is sufficient for this protocol.
2. Treat DNA with RNase A/T1 mix for at least 6 h to remove RNA. See Table 1 for the dosage of RNase A/T1 mix.
Table 1. Dosage of RNase A/T1 mix
| DNA amount before purification | Dosage of RNase A/T1 mix |
|---|---|
| 300–600 μg | 10 μL (20 μg of RNase A and 50 U RNase T1) |
3. Purify the DNA by phenol-chloroform extraction followed by ethanol precipitation.
4. Use a NanoDrop One spectrophotometer to quantify the concentration of genomic DNA.
5. Prepare a 1% agarose gel.
6. Take out 100 ng of genomic DNA and add 10× loading buffer.
7. Load samples and run the gel at 150 V for 30 min in 1× TAE buffer. The genomic DNA of C. reinhardtii is greater than 10 kb (Figure 1).
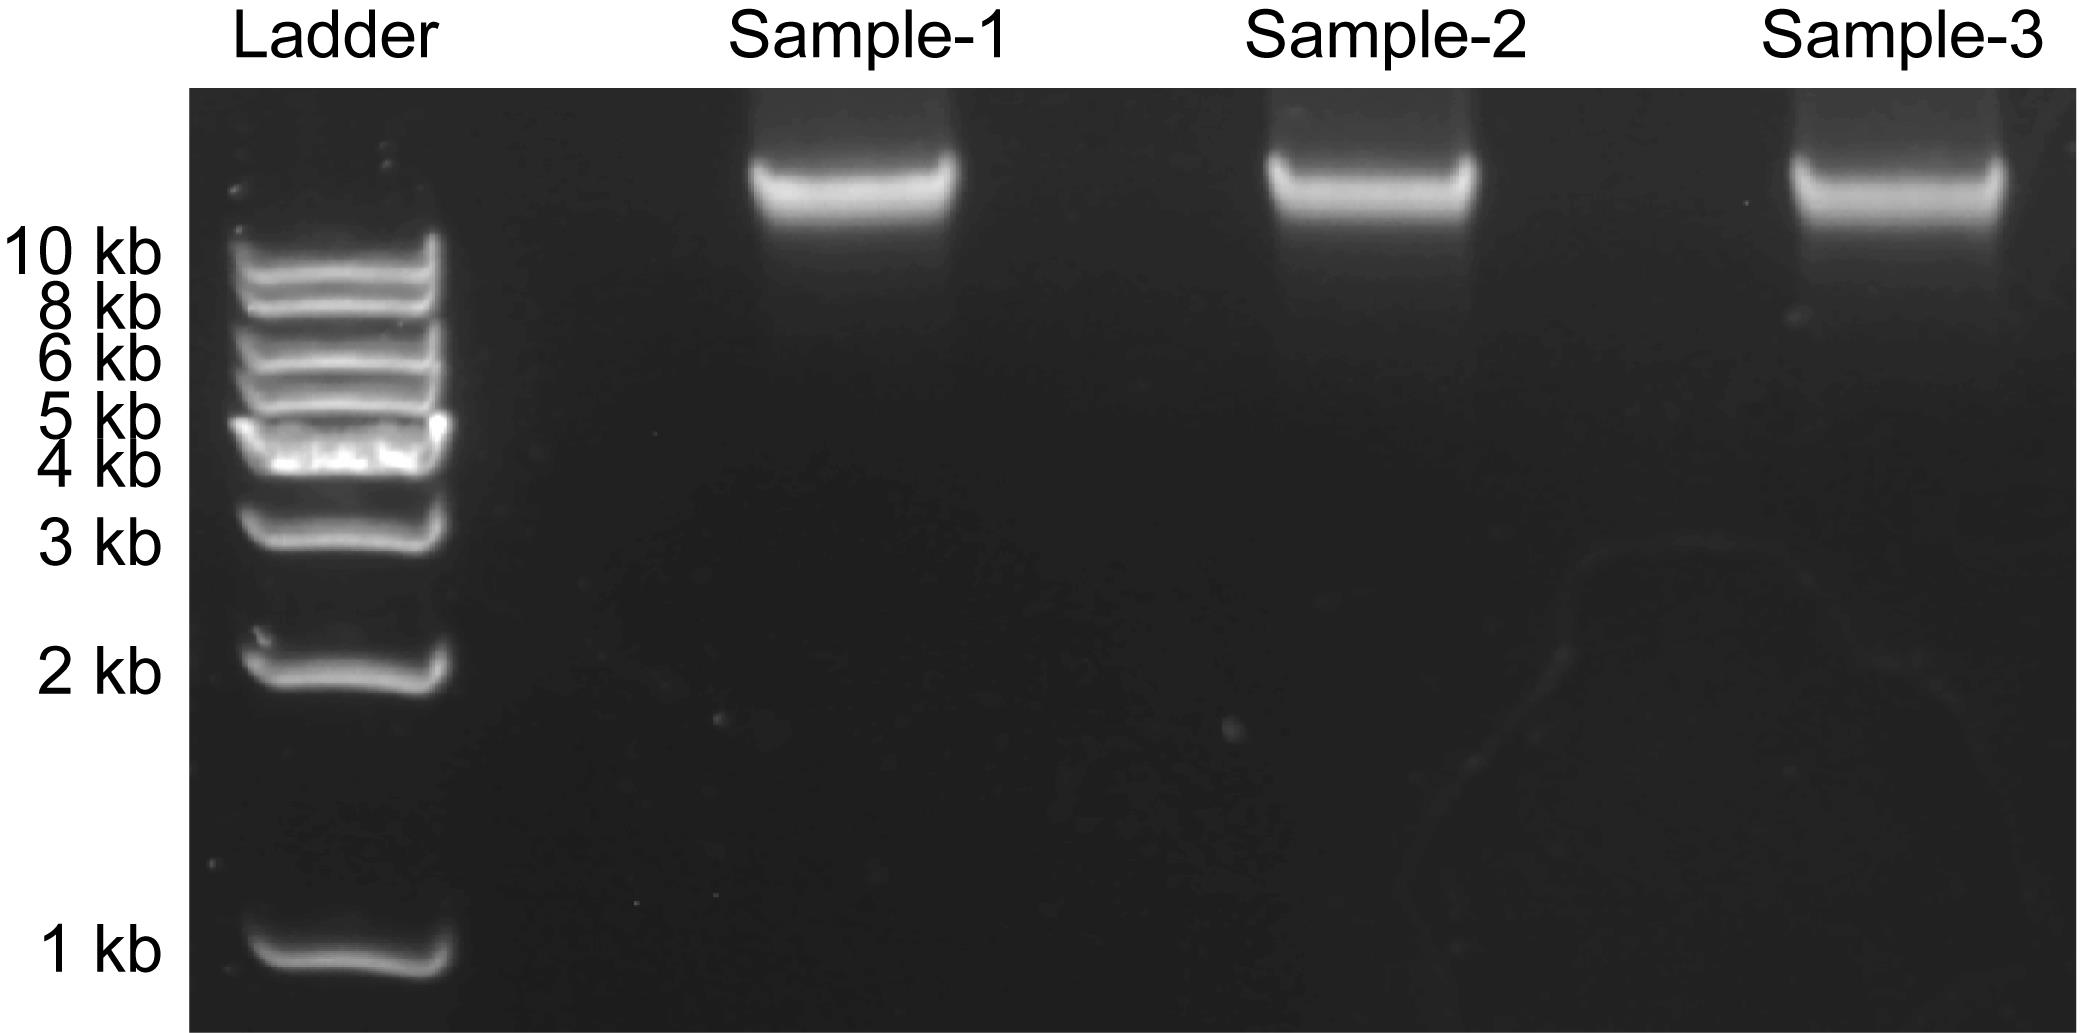
Figure 1. Agarose gel electrophoresis of genomic DNA samples
B. Spike-in DNA preparation
Note: In DEA-seq, the deamination efficiencies of unmodified C and 5mC are determined using defined spike-in controls. Commercial lambda DNA is used as the unmodified C-containing spike-in, whereas the fully methylated 5mC-containing spike-in DNA is generated by PCR amplification using 5-methyl-dCTP instead of dCTP.
1. Prepare a master mix using the following reagents and mix thoroughly (Table 2):
Table 2. PCR reaction mixture for the spike-in 5mC-DNA
| Reagent | Volume |
|---|---|
| TaKaRa TaqTM Hot Start Version (5 U/μL) | 0.5 μL |
| 10× PCR buffer (Mg2+ plus) | 5 μL |
| dNTP mix (dATP, dGTP, dTTP; 2 mM each) | 5 μL |
| 5-methyl-dCTP (2.5 mM) | 4 μL |
| Primer 1 (10 μM, Table S1 in Supplementary information) | 2 μL |
| Synthesized template (50 ng/μL) | 0.1 μL |
| H2O | 33.4 μL |
2. Perform PCR using the following cycling conditions (Table 3):
Table 3. PCR cycling conditions for spike-in 5mC-DNA amplification
| Step | Temperature | Time | Cycles |
| Denaturation | 95 °C | 3 min | 1 |
| Denaturation | 95 °C | 30 s | 30 |
| Annealing | 51 °C | 30 s | |
| Elongation | 72 °C | 40 s | |
| Elongation | 72 °C | 10 min | 1 |
| Hold | 4 °C | ∞ | - |
3. The PCR product is 480 bp, and its sequence is provided in Table S1 (Supplementary information). Perform agarose gel electrophoresis and purify the product using the SanPrep Column DNA Gel Extraction kit.
a. Prepare a 2% agarose gel.
b. Add 5.5 μL of 10× loading buffer to the reaction mixture.
c. Load samples and run the gel at 150 V for 30 min in 1× TAE buffer.
d. Excise the target DNA band and transfer it to a 1.5 mL microcentrifuge tube.
e. Add 3 volumes of buffer B2 (relative to the gel slice weight). Incubate at 50 °C for 5 min until the gel is completely dissolved.
f. Add isopropanol at a volume equal to 1/3 of the buffer B2 volume.
g. Transfer the dissolved gel solution to a spin column. Centrifuge at 8,000× g for 30 s. Discard the flowthrough.
h. Add 500 μL of wash solution to the spin column and centrifuge at 9,000× g for 30 s. Discard the flowthrough and repeat this step once.
i. Return the empty spin column to the centrifuge and spin at 9,000× g for 1 min to dry the membrane completely.
j. Transfer the spin column to a clean 1.5 mL microcentrifuge tube. Add 30 μL of sterile distilled water directly to the center of the membrane.
k. Incubate at room temperature for 1 min, then centrifuge for 1 min to elute the purified DNA.
Note: A single PCR reaction typically yields approximately 2.5 μg of 5mC-DNA. The purified 5mC-DNA can be stored at -20 °C for long-term use.
C. DNA fragmentation
Note: For DNA fragmentation, use a Covaris M220 device and operate it according to the manufacturer’s instructions.
1. Fill the water bath and ensure that the water level option is checked (√). Cool the water bath to 7 °C before use.
2. Set the fragmentation parameters as follows: 50 W peak incident power, 20% duty factor, 200 cycles per burst, and 45 s treatment time.
3. Prepare a mixture of genomic DNA and spike-in DNA as shown in Table 4.
Table 4. Mixture of genomic DNA with spike-in DNA
| Component | Final mass | Volume |
|---|---|---|
| Genomic DNA (200 ng/μL) | 1 μg | 5 μL |
| Lambda DNA (2 ng/μL) | 1 ng | 0.5 μL |
| 5mC-DNA fragment (2 ng/μL) | 1 ng | 0.5 μL |
| H2O | - | to 55 μL |
4. Mix gently by pipetting and transfer the mixture into a Covaris microtube. Insert the microtube into the holder and perform DNA fragmentation.
5. Transfer the fragmented DNA to a new 1.5 mL microcentrifuge tube. The product can be used directly for the subsequent enzymatic reaction.
Note: Samples can be stored at -20 °C.
6. Take 200 ng of the fragmented DNA and run agarose gel electrophoresis (2% agarose, 150 V, 30 min, 1× TAE). As shown in Figure 2, the fragmented DNA should appear as a dense smear centered between 200 and 300 bp.
Note: The recommended DNA fragment size range is 200–400 bp. Fragment sizes outside this range may result in reduced library quality and inefficient sequencing output.
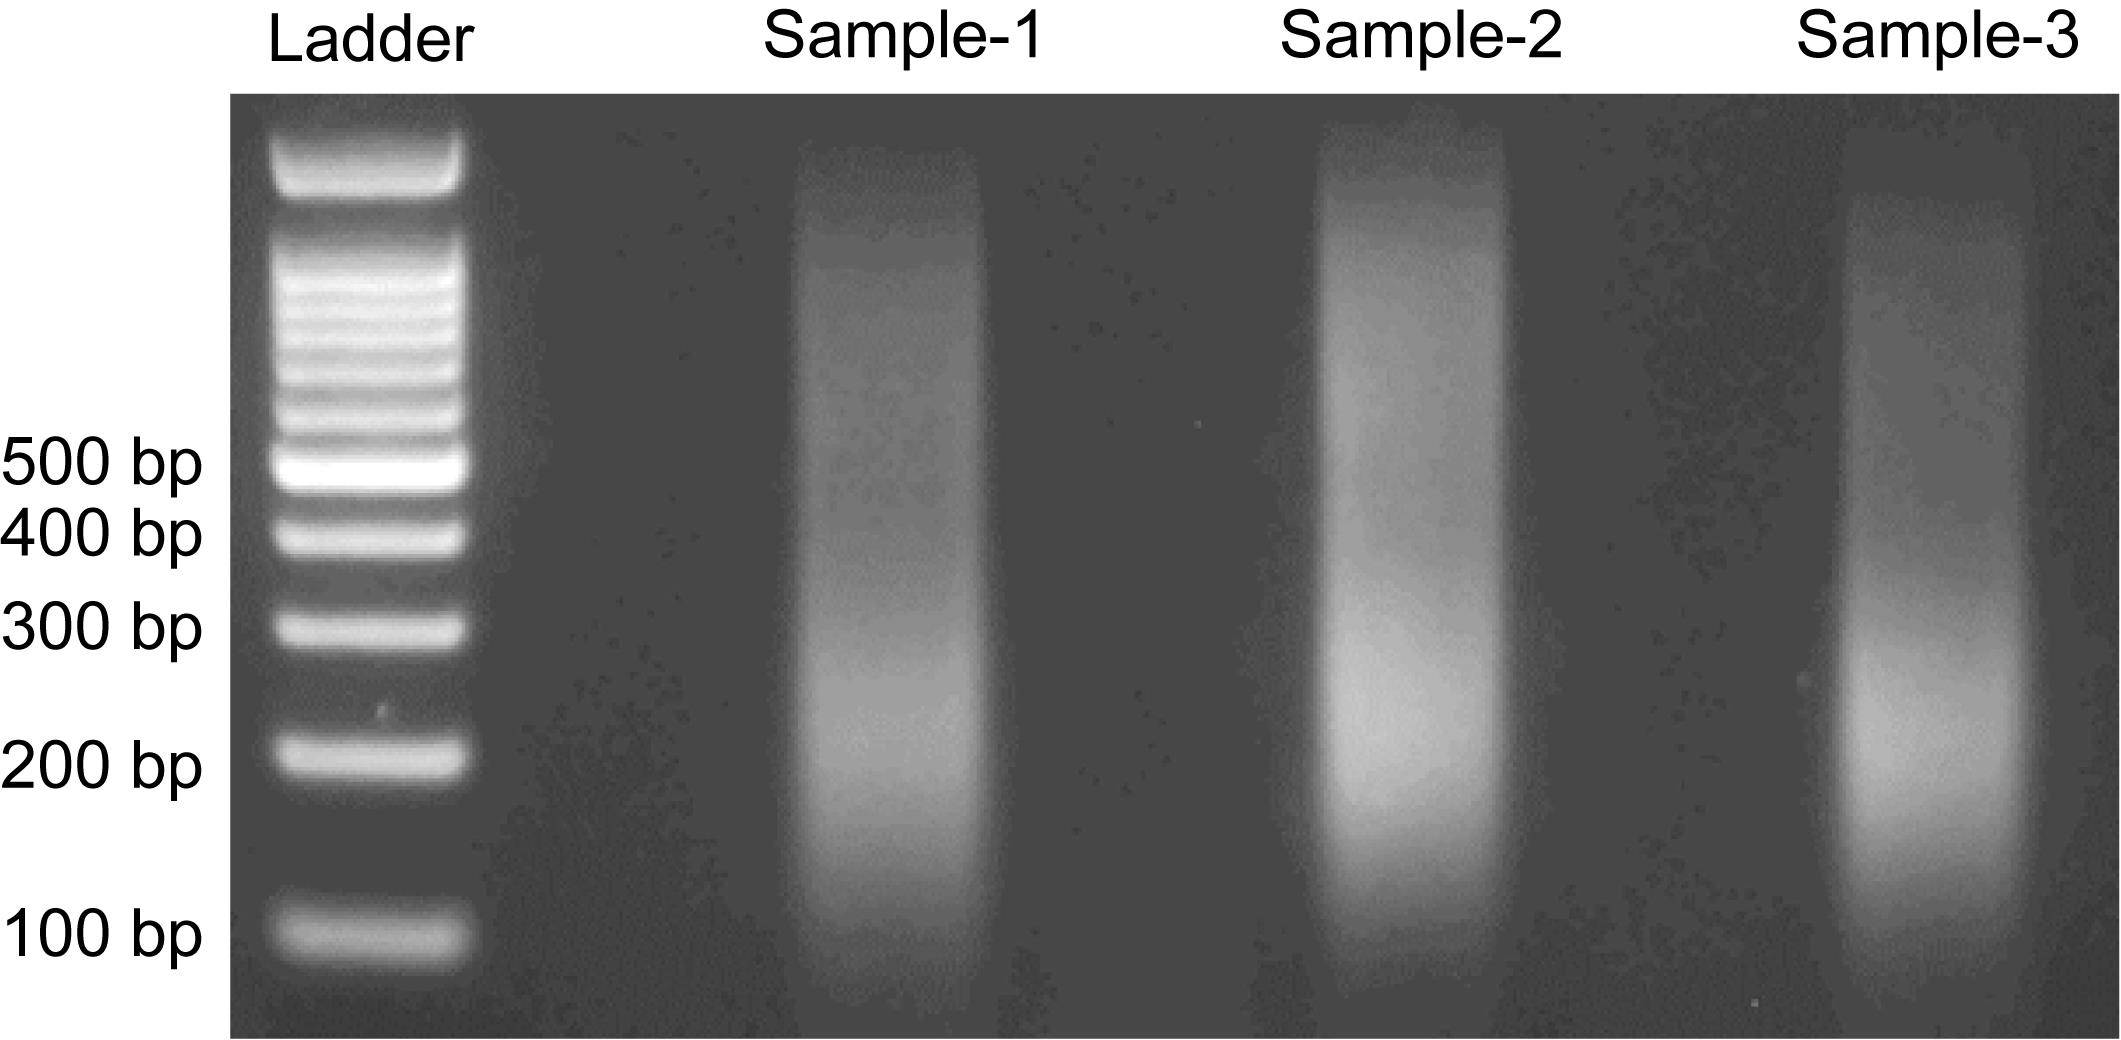
Figure 2. Agarose gel electrophoresis of sonicated DNA samples
D. Deaminase treatment
The deaminase treatment protocol comprises two major steps: DNA denaturation followed by deamination.
1. DNA denaturation
a. Prepare a 0.1 M NaOH working solution by making a 1:50 dilution of 5 M NaOH.
Note: The diluted 0.1 M NaOH solution should be freshly prepared for each experiment and must not be reused.
b. Take 16 μL of fragmented DNA to a new tube. Add 4 μL of 0.1 M NaOH to each sample. Mix thoroughly by pipetting and briefly centrifuge to collect the reaction at the bottom of the tube.
c. With the PCR lid heater activated, incubate the samples in a thermal cycler at 50 °C for 10 min.
d. After the 10-min incubation, immediately transfer the tubes to ice and incubate for 2 min.
Notes:
1. Transfer the samples to ice immediately without waiting for the program to cool. Rapid cooling prevents reannealing of single-stranded DNA, which may interfere with subsequent deamination steps.
2. The recommended input DNA amount is 50–200 ng. Input exceeding 200 ng may result in incomplete denaturation and reduced deamination efficiency, whereas input below 50 ng may compromise subsequent experimental steps.
3. Samples subjected to NaOH treatment can be directly used for the subsequent deamination reaction without a neutralization step. Standard microcentrifuge tubes are compatible with the NaOH treatment used in this protocol.
2. Deamination
a. Thaw the DEA reaction buffer and DEA enzyme mix from EpiArt DNA Enzymatic Methylation kit on ice. Mix thoroughly and briefly centrifuge to collect the solutions. Keep all components on ice.
b. Assemble the reaction system on ice as shown in Table 5.
Table 5. Assembly of the deaminase reaction mixture
| Component | Volume |
| Denatured product from step D1d | 20 μL |
| DEA reaction buffer | 10 μL |
| BSA | 1 μL |
| DEA enzyme mix | 1 μL |
| Nuclease-free ddH2O | to 100 μL |
c. Mix thoroughly by vortexing and briefly centrifuge the tube.
d. Incubate the reaction in a thermal cycler at 37 °C for 3 h, followed by a hold at 4 °C.
3. DNA recovery with DNA Clean & Concentrator-5 kit:
a. Transfer the reaction product to a 1.5 mL microcentrifuge tube. Add 7 volumes of DNA binding buffer. Mix briefly by vortexing.
b. Transfer the mixture to a Zymo-SpinTM column placed in a collection tube.
c. Centrifuge at 12,000× g for 30 s and discard the flowthrough.
d. Add 200 μL of DNA wash buffer to the column and centrifuge at 12,000× g for 30 s. Repeat this wash step once.
e. Add 11 μL of sterile distilled water directly to the column matrix. Incubate at room temperature for 1 min, then transfer the column to a clean 1.5 mL microcentrifuge tube and centrifuge at 12,000× g for 30 s to elute the DNA.
f. Assess the recovery efficiency of ssDNA using a QubitTM 4 fluorometer.
Note: The recovery rate of single-stranded DNA is typically 10%–20%.
E. Deamination efficiency determination of spike-in DNA
1. PCR amplification of deaminated spike-in DNA
a. Prepare a master mix from the following reagents (Table 6):
Table 6. PCR reaction mixture for the spike-in DNA after deamination
| Component | Volume per sample |
|---|---|
| TaKaRa TaqTM Hot Start Version (5 U/μL) | 0.5 μL |
| 10× PCR buffer (Mg2+ plus) | 5 μL |
| dNTP mix (2 mM each) | 5 μL |
| Primer 2 or primer 3 (10 μM, Table S1 in Supplementary information) | 2 μL |
| H2O | 37 μL |
b. Distribute 49.5 μL of the master mix into PCR tubes. Add 0.5 μL of purified deaminated DNA to each tube (final volume: 50 μL). Mix gently by pipetting and briefly centrifuge to collect the solution at the bottom.
c. Perform PCR using the following cycling conditions (Table 7):
Table 7. PCR cycling conditions for spike-in DNA amplification after deamination
| Step | Temperature | Time | Cycles |
| Denaturation | 95 °C | 3 min | 1 |
| Denaturation | 95 °C | 30 s | 30 |
| Annealing | 51 °C for primer2 or 43 °C for primer3 | 30 s | |
| Elongation | 72 °C | 40 s | |
| Elongation | 72 °C | 10 min | 1 |
| Hold | 4 °C | ∞ | - |
2. DNA gel electrophoresis and recovery
a. Prepare a 2% agarose gel.
b. Add 5.5 μL of 10× loading buffer to the reaction mix.
c. Load the samples and run the gel at 150 V for 30 min. Visualize and photograph the gel under UV light using a gel documentation system.
Note: The gel electrophoresis results of the PCR products are shown in Figure S1.
d. Excise the target DNA band and transfer it to a 1.5 mL microcentrifuge tube. Recover the DNA using the SanPrep Column DNA Gel Extraction kit.
e. Add three volumes of buffer B2 (relative to the gel slice weight). Incubate at 50 °C for 5 min to fully dissolve the gel.
f. Add isopropanol equivalent to one-third the volume of buffer B2 used.
g. Transfer the dissolved gel solution to a spin column. Centrifuge at 8,000× g for 30 s and discard the flowthrough.
h. Add 500 μL of wash solution to the spin column. Centrifuge at 9,000× g for 30 s and discard the flowthrough. Repeat this wash step once.
i. Place the empty column back into the centrifuge and spin at 9,000× g for 1 min to dry the membrane completely.
j. Transfer the column to a clean 1.5 mL microcentrifuge tube. Add 30 μL of sterile distilled water to the center of the membrane.
k. Incubate at room temperature for 1 min, then centrifuge at 10,000× g for 1 min to elute the DNA.
l. Assess DNA quantity and quality using a NanoDrop spectrophotometer.
3. Restriction enzyme analysis
a. Thaw all reagents for HpyCH4IV (TaiI) and FastDigest SsiI (AciI) on ice. Briefly centrifuge to collect contents at the bottom of the tubes.
b. Assemble the restriction enzyme digestion system as shown in Table 8.
Table 8. Assembly of the restriction enzyme digestion reaction
| Component | Final concentration/mass | Volume per reaction |
|---|---|---|
| 10× restriction buffer | 1× | 2.0 μL |
| Restriction enzyme (10 Units/μL) | 5 Units | 0.5 μL |
| DNA | 150 ng | × μL |
| Nuclease-free water | - | to 20 μL |
Note: Following deamination and PCR and DNA recovery, FastDigest SsiI (AciI) is used for lambda DNA-derived fragment digestion, while HpyCH4IV (TaiI) is used for 5mC-DNA-derived fragments analysis.
c. Mix thoroughly by gentle pipetting. Briefly centrifuge to collect the reaction at the bottom of the tube.
d. Incubate in a thermal cycler using the following program: 37 °C for 60 min, 65 °C for 10 min, and 4 °C hold.
e. Add 2.2 μL of 10× loading buffer to the reaction and perform agarose gel electrophoresis (2% agarose gel, 150 V, 30 min).
f. Visualize and photograph the gel under UV illumination.
Note: As shown in Figure 3, restriction enzyme cleavage is blocked when C or 5mC undergoes deamination, which disrupts the recognition sites. The presence of digested bands indicates incomplete deamination.
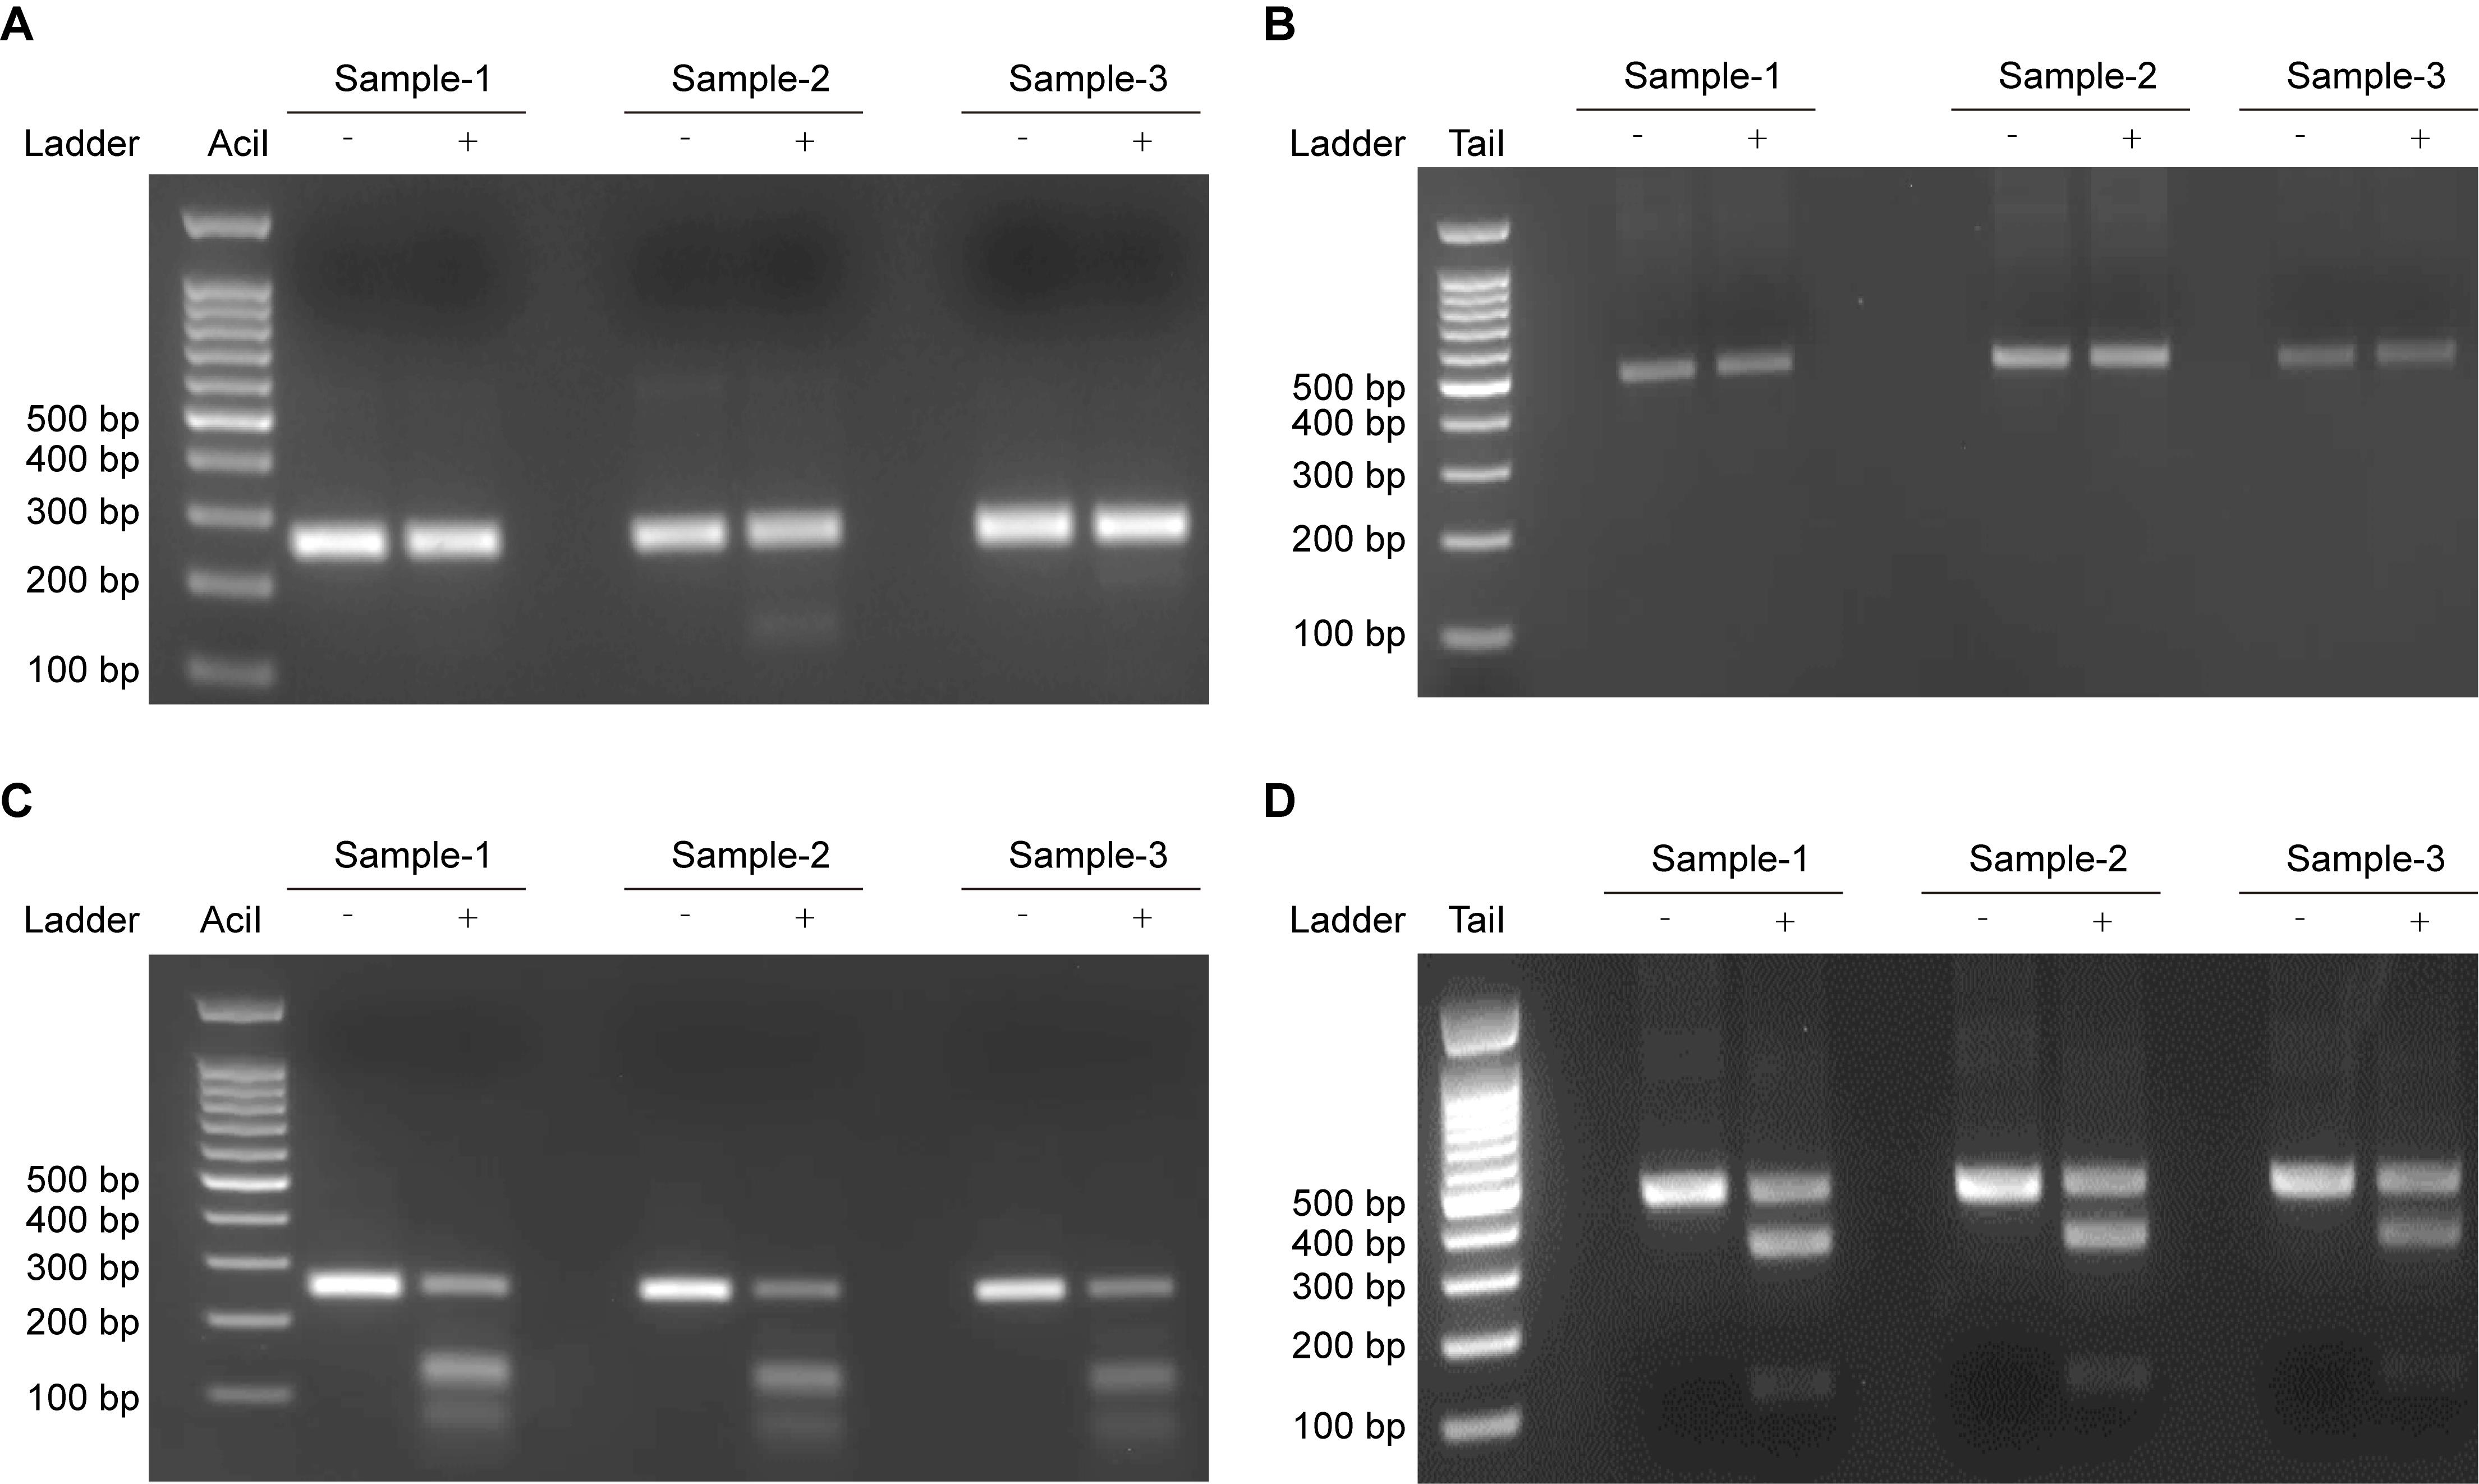
Figure 3. Restriction enzyme analysis of deaminated lambda DNA and 5mC-DNA. Complete inhibition of restriction enzyme digestion indicates near-complete deamination of lambda DNA (A) and 5mC-DNA (B). In contrast, the presence of digestion products reflects incomplete deamination of lambda DNA (C) and 5mC-DNA (D).
4. Nanopore sequencing of PCR products: Nanopore sequencing of the resulting PCR products can be performed to further evaluate the conversion efficiency of C and 5mC in the spike-in DNA. As shown in Figure 4, the C and 5mC spike-in DNA have been successfully deaminated.
Note: The recommended deamination efficiency for both C and 5mC spike-in DNA should be greater than 99.0%.
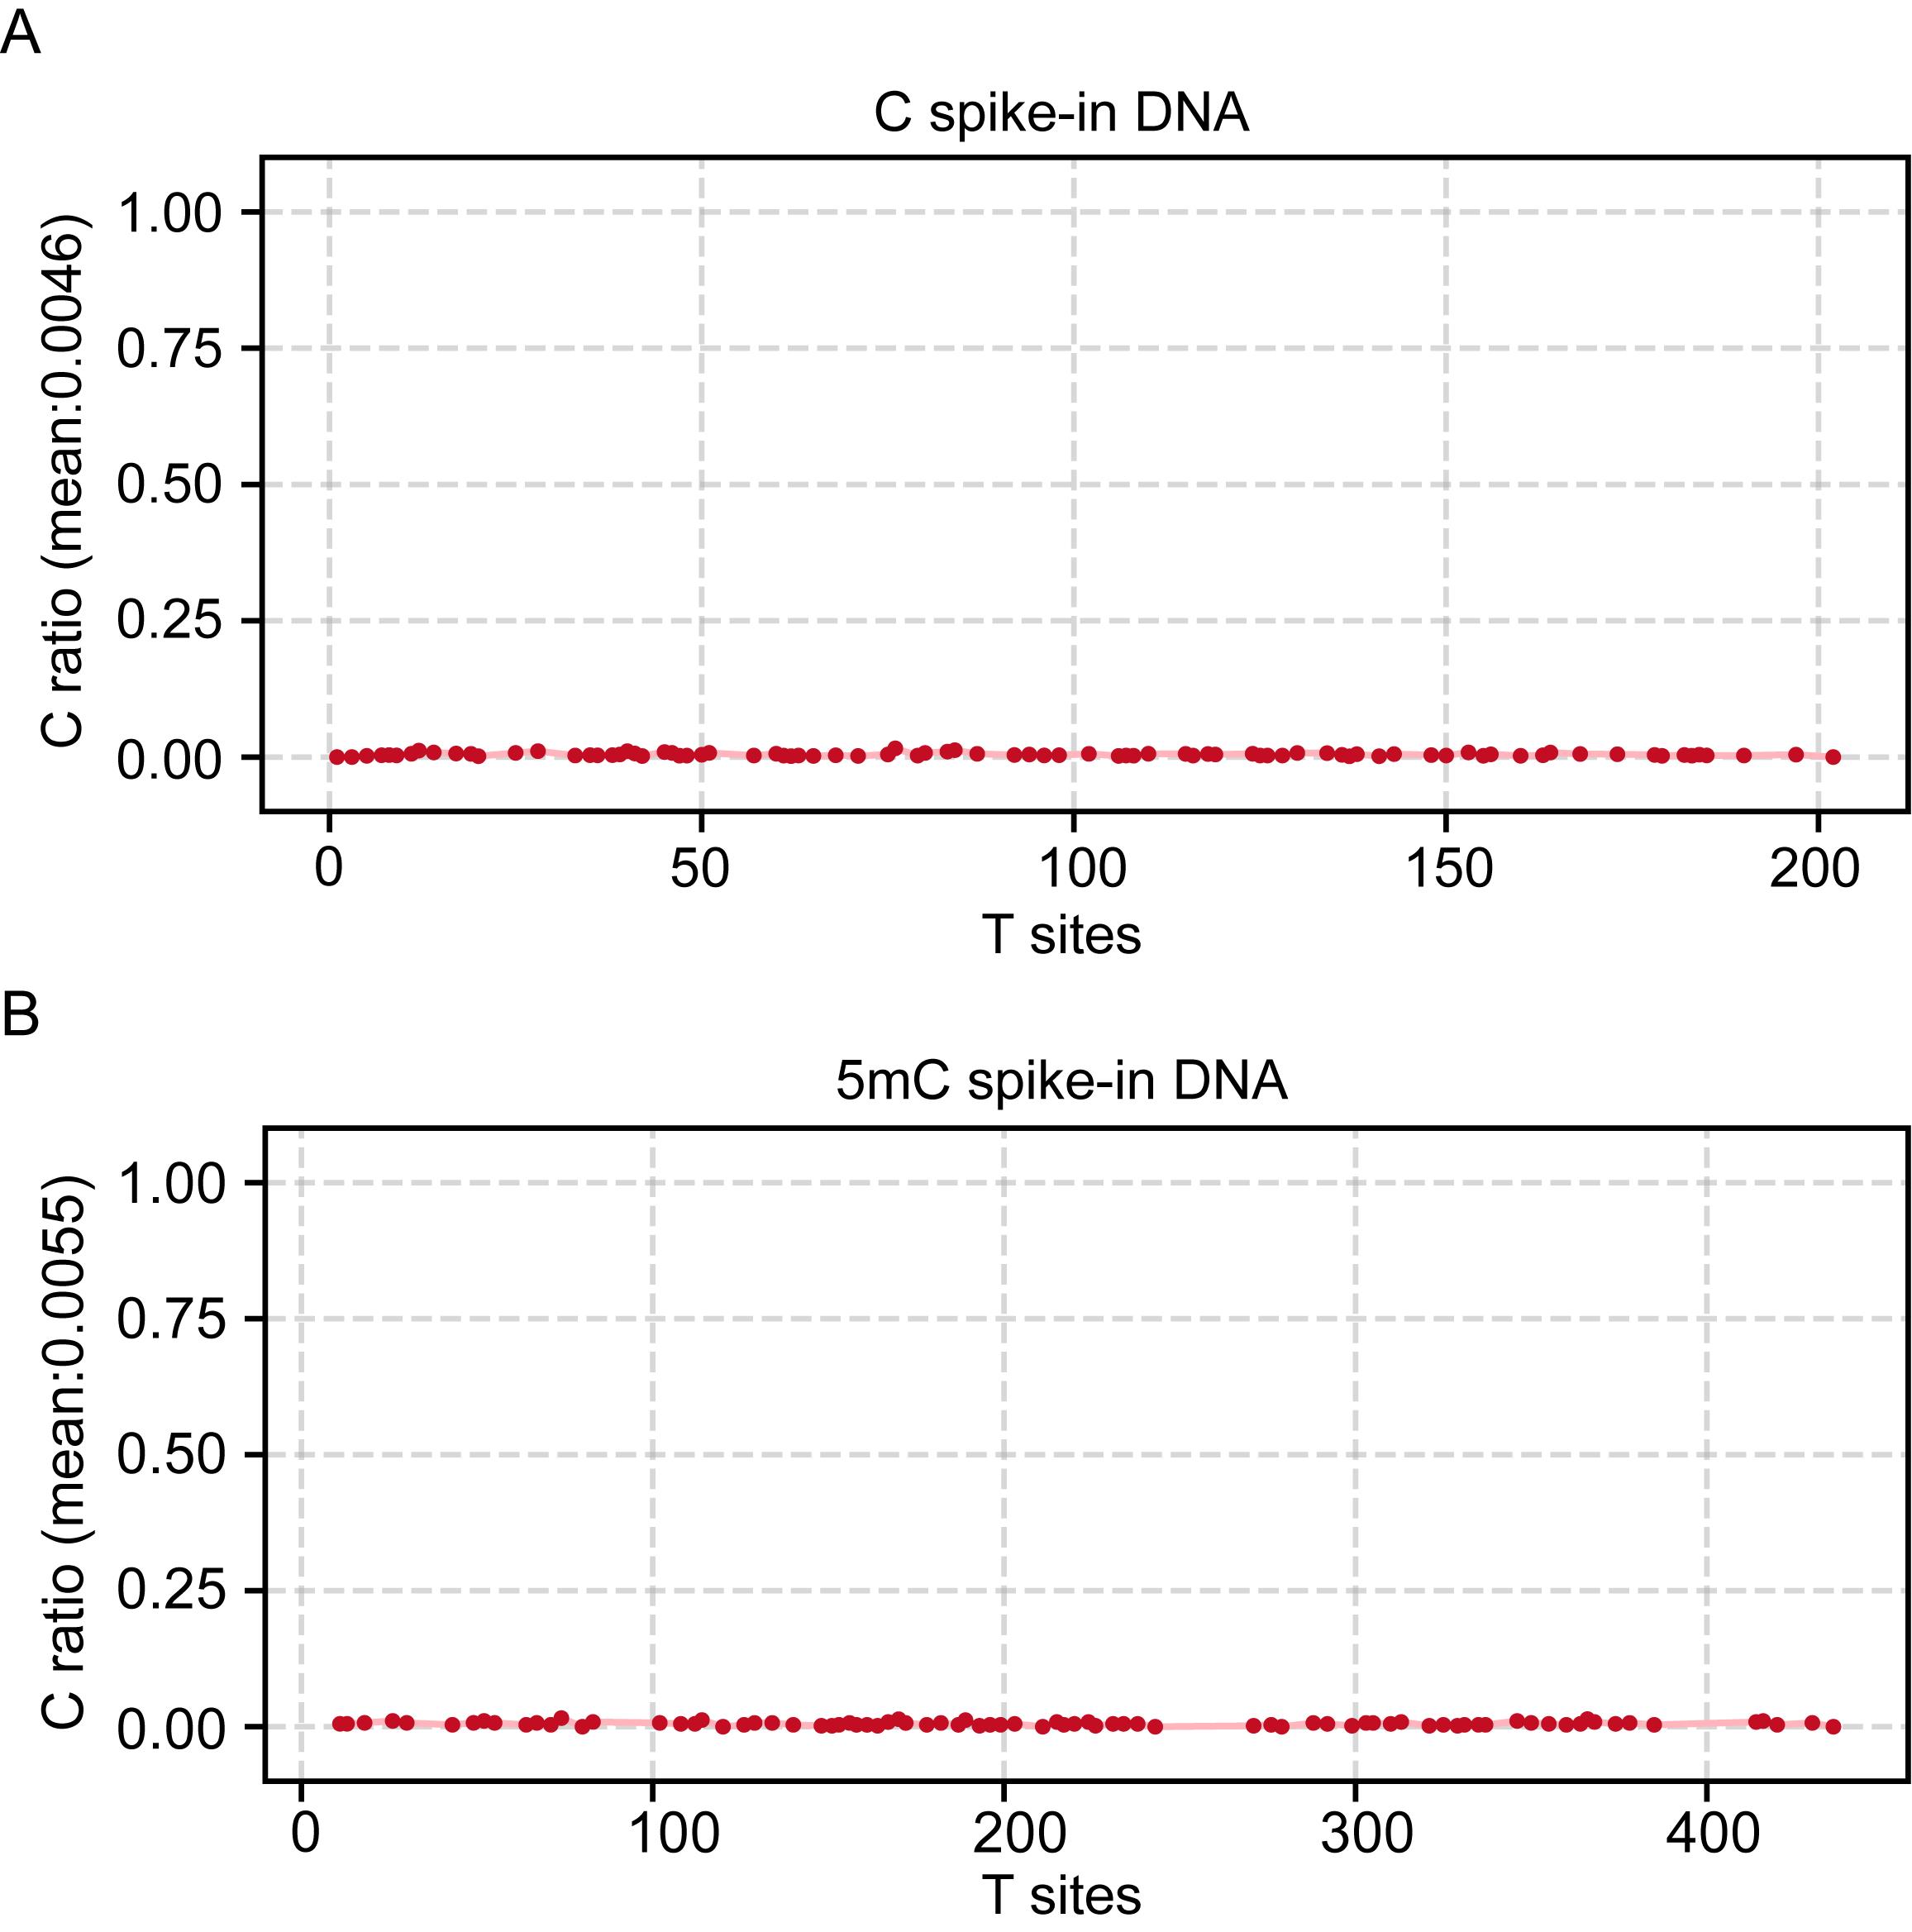
Figure 4. Nanopore sequencing of the PCR product of C (A) and 5mC (B) spike-in DNA. In detail, each point represents a single cytosine site, which can be deaminated to thymine during PCR amplification and sequencing. The vertical axis shows the observed C ratio, representing the frequency of unconverted cytosines at each site. In C spike-in DNA, the average remaining C ratio is 0.46%, indicating a deamination efficiency of 99.54%. In 5mC spike-in DNA, the average remaining C ratio is 0.55%, corresponding to a deamination efficiency of 99.45%.
F. Sequencing library construction
1. The library is prepared using the EpiArt DNA Methylation Library kit for Illumina V3 according to the manufacturer’s instructions.
2. Take 500 ng of the DNA library and run a 2% agarose gel electrophoresis (150 V, 30 min, 1× TAE). As shown in Figure 5, a dense smear centered around 400–500 bp should be observed.
3. The libraries were sequenced on an Illumina NovaSeq X Plus platform using 150 bp paired-end mode, with an average sequencing depth of 100×.
Note: A sequencing depth of 100× is recommended, as lower depths may generate more false-positive signals. For the C. reinhardtii genome (~123 Mb), 30–50 Gb of sequencing data is sufficient.
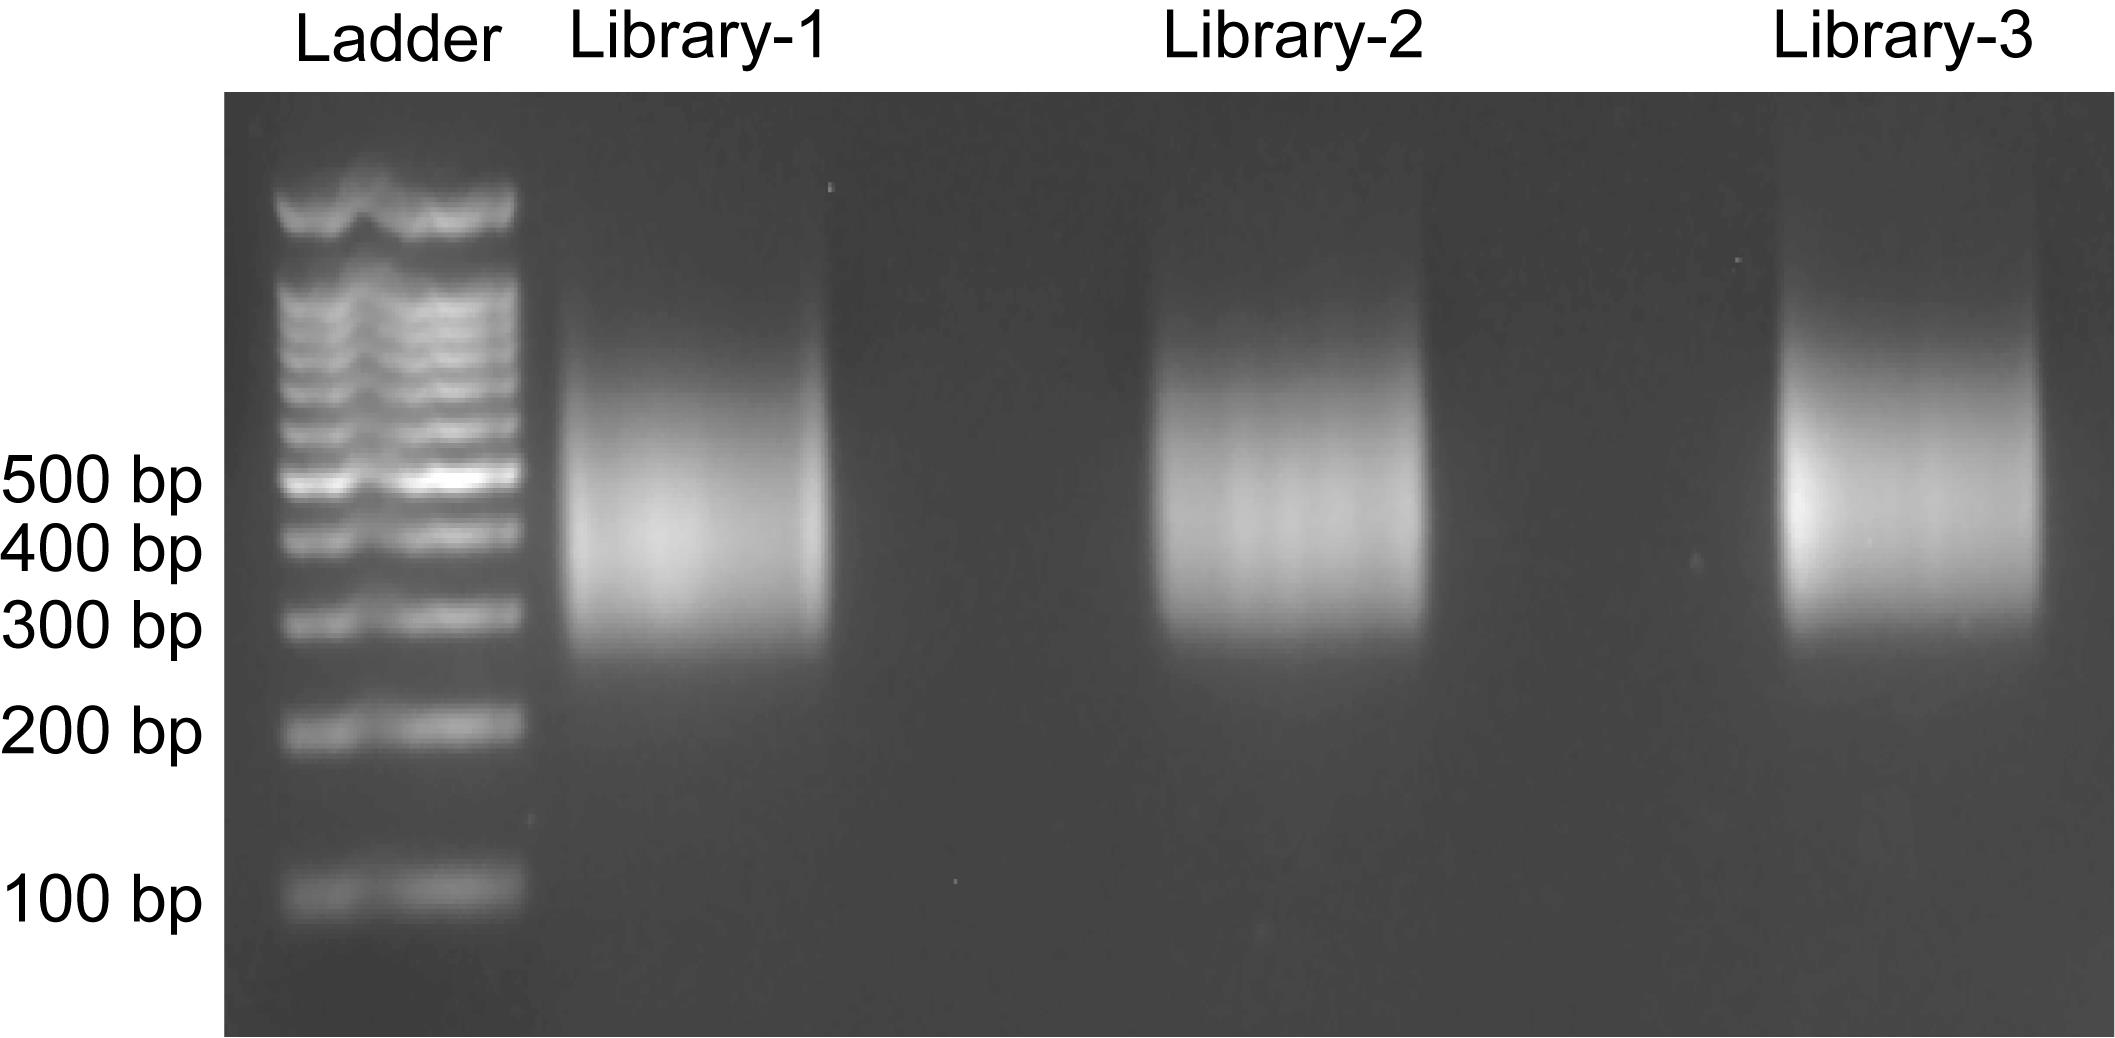
Figure 5. Agarose gel electrophoresis of DNA libraries
Data analysis
To determine the single-base resolution distribution of 5gmC in the samples, we employed the novel DEA-seq workflow described in this protocol. DEA efficiently deaminates both C and 5mC, converting them to U or T, while leaving 5gmC intact. Consequently, in sequencing data generated from DEA-treated DNA, only 5gmC is read as C, whereas all other cytosines appear as T.
Leveraging this property, DEA-seq data can be analyzed using an approach analogous to whole-genome bisulfite sequencing (WGBS) to identify 5gmC-modified sites at single-base resolution (Figure 6). The analysis workflow is outlined below.

Figure 6. Flowchart of data analysis
1. All fastq files generated via DEA-seq are trimmed and filtered by using Trimmomatic (v0.39, user guide: http://www.usadellab.org/cms/?page=trimmomatic).
Example command:
trimmomatic PE <input_fastq_R1> <input_fastq_R2>
ILLUMINACLIP: <fastaWithAdaptersEtc>
CROP: <length>
HEADCROP: <length>
LEADING: <length>
SLIDINGWINDOW: <windowSize>
MINLEN: <length>
After execution completes, the corresponding clean fastq files <output_fastq>
2. The cleaned FASTQ files are aligned to the reference genome using Bismark (v0.24.2). After alignment, PCR duplicates are removed, and DNA modifications (5gmC) are extracted following the Bismark user guide (https://felixkrueger.github.io/Bismark/).
a. Example command for alignment:
bismark --genome <reference genome> \ --non_directional \-1 <input_clean_fastq_R1> -2 <input_clean_fastq_R1> \ -o <output_dir> After execution completes, the corresponding bam files will be created at <output_dir>
b. Example command for removing duplicates:
deduplicate_bismark -bam -p <alignment_bam> --output_dir <output_dir> After execution completes, the corresponding deduplicated bam files will be created at <output_dir>. c. Example command for extracting methylation (or modification):
bismark_methylation_extractor \--paired-end \--comprehensive \--bedGraph \--counts \--report \--cytosine_report \--CX_context \--genome_folder <reference genome> <input_deduplicated_bam> -o <output_dir> After execution completes, the site-specific methylation (or modification) result files will be created at <output_dir>
Notes:
1. Since 5gmC represents only ~10 ppm of total cytosines in the C. reinhardtii genome (based on mass spectrometry), appropriate cutoffs should be applied to obtain consistent sequencing results. While no cutoff can completely eliminate false positives, setting thresholds for sequencing depth or the proportion of positive signals at each site can help to reduce them. During DEA-seq analysis, different cutoff combinations can be tested, and those that produce 5gmC abundance consistent with mass spectrometry data are defined as the final cutoffs.
2. The overall conversion rate of total cytosines across the genome is expected to exceed 99% due to the low abundance of 5gmC.
Validation of protocol
This protocol (or parts of it) has been used and validated in the following research article:
• Wang et al. [4]. Base-resolution profiling of 5-glyceryl-methylcytosine in Chlamydomonas reinhardtii via deaminase-assisted sequencing, Nucleic Acids Research, Volume 53, Issue 18, 14 October 2025, gkaf955, https://doi.org/10.1093/nar/gkaf955 (Figure 1 and Supplementary Figures S1–S3 are the data for validation of DEA-seq. The other figures represent the analysis data of whole-genome DEA-seq in C. reinhardtii).
General notes and troubleshooting
General notes
1. Since DEA-seq is designed for profiling 5gmC, it is important to note that other hypermodified bases may compromise its performance, as they could also hinder the deamination activity of DEA used in this study. Because 5mC and 5gmC have been identified as the only cytosine modifications in the C. reinhardtii genome, DEA-seq is suitable for 5gmC determination in this organism. However, whether DEA-seq can be applied to other species should be carefully assessed.
2. DEA does not achieve 100% deamination efficiency for C and 5mC, which may affect the detection of extremely low-abundance 5gmC sites. Therefore, appropriate cutoffs are essential to ensure the accuracy and reliability of 5gmC identification when using DEA-seq.
Troubleshooting
Problem: Low deamination efficiency of DEA.
Possible cause: Excessive DNA input or incomplete denaturation by NaOH.
Solution: Reduce the input DNA amount (<200 ng/reaction) and prepare a fresh NaOH solution to ensure complete denaturation.
Supplementary information
The following supporting information can be downloaded here:
1. Table S1. PCR primers and sequences for the spike-in DNA.
2. Figure S1. Agarose gel electrophoresis of PCR products following DEA treatment of C spike-in (A) and 5mC spike-in DNA (B).
Acknowledgments
Conceptualization, J.X.; Investigation, B.H. and F.W.; Writing—Original Draft, B.H. and F.W.; Writing—Review & Editing, J.X.; Funding acquisition, J.X.; Supervision, J.X. This protocol is based on our previous publication [4]. This work was supported by the Brain Science and Brain-like Intelligence Technology-National Science and Technology Major Project (2025ZD0217500 to J.X.), National Key R&D Program of China (2022YFA1103203 to J.X.), National Natural Science Foundation of China (32270639, 32570686 to J.X.), Natural Science Foundation of Shanghai (23ZR1468200 to J.X.), and the Non-profit Central Research Institute Fund of the Chinese Academy of Medical Sciences (2024-JKCS-19 to J.X.). This work is also supported by the Fundamental Research Funds for the Central Universities (22120250374 and 20002150165 to J.X.), Peak Disciplines (Type IV) of Institutions of Higher Learning in Shanghai, and by the State Key Laboratory of Epigenetic Regulation and Intervention.
Competing interests
The authors declare no competing interests.
Ethical considerations
This protocol does not involve human or animal subjects.
References
- Meng, W. Y., Wang, Z. X., Zhang, Y., Hou, Y. and Xue, J. H. (2024). Epigenetic marks or not? The discovery of novel DNA modifications in eukaryotes. J Biol Chem. 300(4): 106791. https://doi.org/10.1016/j.jbc.2024.106791
- Xue, J. H., Chen, G. D., Hao, F., Chen, H., Fang, Z., Chen, F. F., Pang, B., Yang, Q. L., Wei, X., Fan, Q. Q., et al. (2019). A vitamin-C-derived DNA modification catalysed by an algal TET homologue. Nature. 569(7757): 581–585. https://doi.org/10.1038/s41586-019-1160-0
- Li, W., Zhang, T., Sun, M., Shi, Y., Zhang, X. J., Xu, G. L. and Ding, J. (2021). Molecular mechanism for vitamin C-derived C5-glyceryl-methylcytosine DNA modification catalyzed by algal TET homologue CMD1. Nat Commun. 12(1): 744. https://doi.org/10.1038/s41467-021-21061-2
- Wang, F. C., He, B. D., Wang, Z. X., Deng, X., Chen, H., Meng, W. Y., Fu, Y. T., Zou, W. Y., Ge, T., Li, Y., et al. (2025). Base-resolution profiling of 5-glyceryl-methylcytosine in Chlamydomonas reinhardtii via deaminase-assisted sequencing. Nucleic Acids Res. 53(18): e1093/nar/gkaf955. https://doi.org/10.1093/nar/gkaf955
- Pastor, W. A., Aravind, L. and Rao, A. (2013). TETonic shift: biological roles of TET proteins in DNA demethylation and transcription. Nat Rev Mol Cell Biol. 14(6): 341–356. https://doi.org/10.1038/nrm3589
- Yu, M., Hon, G. C., Szulwach, K. E., Song, C. X., Zhang, L., Kim, A., Li, X., Dai, Q., Shen, Y., Park, B., et al. (2012). Base-Resolution Analysis of 5-Hydroxymethylcytosine in the Mammalian Genome. Cell. 149(6): 1368–1380. https://doi.org/10.1016/j.cell.2012.04.027
- Liu, Y., Siejka-Zielińska, P., Velikova, G., Bi, Y., Yuan, F., Tomkova, M., Bai, C., Chen, L., Schuster-Böckler, B., Song, C. X., et al. (2019). Bisulfite-free direct detection of 5-methylcytosine and 5-hydroxymethylcytosine at base resolution. Nat Biotechnol. 37(4): 424–429. https://doi.org/10.1038/s41587-019-0041-2
- Schutsky, E. K., DeNizio, J. E., Hu, P., Liu, M. Y., Nabel, C. S., Fabyanic, E. B., Hwang, Y., Bushman, F. D., Wu, H., Kohli, R. M., et al. (2018). Nondestructive, base-resolution sequencing of 5-hydroxymethylcytosine using a DNA deaminase. Nat Biotechnol. 36(11): 1083–1090. https://doi.org/10.1038/nbt.4204
- Wang, Z. X., Chen, F., He, B. D., Wang, F. C., Cha, J., Song, Y., Meng, W. Y., Zou, W. Y., Fu, Y. T., Sun, S. X., et al. (2025). Direct Sequencing of 5-Methylcytosine and 5-Hydroxymethylcytosine at Single-Base Resolution Unravels Their Distinct Roles in Alzheimer's Disease. Adv Sci (Weinh) 12(38): e07843. https://doi.org/10.1002/advs.202507843
- Wang, Z. L., Xu, J. X., Liu, G., He, Y. M., Nafie, J., Wu, C. S., Wei, J. C., Liu, L., Tang, H. R., Huang, K. Y., et al. (2024). Total synthesis of all stereoisomers of C5- glyceryl-methyl-2′-deoxycytidine 5gmC and their occurrence in Chlamydomonas reinhardtii. Cell Rep Phys Sci. 5(7): 102041. https://doi.org/10.1016/j.xcrp.2024.102041
Article Information
Publication history
Received: Nov 24, 2025
Accepted: Jan 13, 2026
Available online: Jan 20, 2026
Published: Feb 20, 2026
Copyright
© 2026 The Author(s); This is an open access article under the CC BY-NC license (https://creativecommons.org/licenses/by-nc/4.0/).
How to cite
He, B. D., Wang, F. C. and Xue, J. H. (2026). Deaminase-Assisted Sequencing for the Identification of 5-glyceryl-methylcytosine. Bio-protocol 16(4): e5601. DOI: 10.21769/BioProtoc.5601.
Category
Bioinformatics and Computational Biology
Molecular Biology > DNA > DNA modification
Molecular Biology > DNA > DNA sequencing
Do you have any questions about this protocol?
Post your question to gather feedback from the community. We will also invite the authors of this article to respond.