- Protocols

- Articles and Issues
- For Authors
- About
- Become a Reviewer

Quantification of Protochlorophyllide (Pchlide) Content in Arabidopsis Seedlings Using a High-Performance Liquid Chromatography (HPLC) System
(*contributed equally to this work) Published: Vol 16, Iss 1, Jan 5, 2026 DOI: 10.21769/BioProtoc.5553 Views: 578
Reviewed by: Anonymous reviewer(s)
Original research article
The authors used this protocol in:

Oct 2025

Protocol Collections
Comprehensive collections of detailed, peer-reviewed protocols focusing on specific topics


Related protocols
Abstract
The protochlorophyllide (Pchlide) level is a crucial indicator of plant fitness. Precise quantification of Pchlide content is necessary not only in studies of flu-related mutants that over-accumulate Pchlide in the dark but also for research on plants suffering from environmental stresses. Due to its low content and interference of chlorophylls, quantitative determination of Pchlide content is a challenge. Here, we describe an optimized protocol for Pchlide extraction from Arabidopsis thaliana seedlings and subsequent analysis using high-performance liquid chromatography (HPLC) coupled with fluorescence detection. Divinyl-Protochlorophyllide (DV-Pchlide, the major form of Pchlide in plants) quantification is achieved by interpolating fluorescence peak areas against an experimentally derived standard curve. This protocol provides a reliable workflow for Pchlide quantification, facilitating the deciphering of the underlying mechanism of plant environmental resilience.
Key features
• This method adopts acetone as a solvent for both Pchlide extraction and HPLC run.
• This protocol adopts a gradient HPLC system equipped with a fluorescence detector.
• This protocol applies an experimentally derived standard calibration curve using synthetic DV-Pchlide.
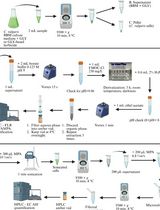
Keywords: DV-PchlideGraphical overview

Background
Chlorophylls (Chls) are the most abundant organic pigment molecules on Earth. As components of photosynthesis machinery, Chls absorb light energy that is mostly used in photosynthesis. However, free Chl and most of its biosynthetic intermediates are particularly destructive once they become excited after light absorption [1]. These excited porphyrin molecules can interact with the surrounding ground-state oxygen molecule, leading to the highly reactive singlet oxygen (1O2) [2], which causes photooxidative damage and eventually programmed cell death (PCD) [3]. Thereby, the plant exerts strict control over tetrapyrrole biosynthesis [4,5]. In plants, Chl biosynthesis halts at the step of protochlorophyllide (Pchlide) generation due to the inhibitory effect of the FLU protein and resumes upon light illumination when Pchlide is photo-reduced to Chlide [6]. The Arabidopsis flu mutant over-accumulates Pchlide in the chloroplast in darkness and generates 1O2 when transferred to light due to the photosensitizing activity of the Pchlide molecules [7]. In the flu mutant, the level of generated 1O2 after dark-to-light shift is positively correlated with the amount of accumulated Pchlide, i.e., the duration of dark treatment [8]. However, when flu mutants are grown under continuous light, only a very low level of 1O2 is produced since Pchlide is immediately used for Chl biosynthesis, and the flu mutant grows exactly like the wild-type plants. These properties of the flu mutant make it an ideal tool for controlled generation of 1O2, and the exploration of this mutant has led to the identification of at least two chloroplastic 1O2-induced retrograde signaling pathways: the 1O2-EX1 pathway and 1O2-SAFE1 pathway [9–13].
Since Pchlide is a critical indicator of 1O2 level, precise quantification of its content is necessary not only for studies of flu-related mutants but also of plants suffering from environmental stresses [14–16]. In the etiolated flu seedlings, Pchlide accumulation can be directly visualized by its characteristic red fluorescence under blue light. However, Pchlide accumulation can hardly be detected in dark-incubated green leaves due to the interference of pigments, especially Chls, and is generally quantified using a fluorescence spectrophotometer [13,17] or high-performance liquid chromatography (HPLC) [11,18]. Compared with the former, HPLC-based Pchlide quantification is more accurate and reliable. Here, we provide a simple procedure for Pchlide extraction from Arabidopsis thaliana seedlings and a detailed workflow for Pchlide separation and detection using a fluorescence detector-equipped HPLC system, based on our recent publication [11]. Pchlide (DV-Pchlide) quantification is achieved based on fluorescence peak area and an experimentally derived standard curve.
Materials and reagents
Biological materials
1. 4-day-old etiolated Arabidopsis thaliana seedlings grown in darkness
2. 7-day-old Arabidopsis thaliana seedlings grown under continuous light and pretreated in darkness for 8 h
Reagents
1. Murashige & Skoog basal medium with vitamins (PhytoTech Labs, catalog number: M519); store at 2–8 °C
2. Agar (Merck KGaA, CAS number: 9008-12-0)
3. Acetone (HPLC grade) (SINOPHARM, CAS number: 67-64-1)
4. Water (HPLC grade)
5. Methanol (HPLC grade) (Thermo Fisher Scientific, CAS number: 67-56-1)
6. Acetic acid (Beijing Chemical Plant Co., Ltd., CAS number: 64-19-7)
7. Ammonia water (MODERN ORIENTAL FINE CHEMISTRY, CAS number: 1336-21-6)
8. Divinyl-protochlorophyllide (in solution) (HPLC grade) (ZZSTANDARD, CAS number: 18433-30-2); store at ≤-70 °C
9. KOH (Shanghai Macklin Biochemical Co., Ltd., CAS number: 1310-58-3)
10. Sucrose (Sigma, CAS number: 57-50-1)
11. MES (Sigma, CAS number: 145224-94-8)
Solutions
1. Half-strength Murashige and Skoog (1/2 MS) plant growth medium (see Recipes)
2. Pchlide extraction buffer (see Recipes)
Recipes
1. 1/2 MS plant growth medium
| Reagent | Final concentration | Quantity or volume |
|---|---|---|
| Murashige & Skoog basal medium with vitamins | n/a | 2.215 g |
| Sucrose | 1% (m/v) | 10 g |
| MES | 0.05% (m/v) | 0.5 g |
| ddH2O | n/a | Top to 1 L |
| Agar | 1% (m/v) | 10 g |
Dissolve all ingredients, except agar, in ddH2O in a beaker and adjust pH to 5.7–5.8 with KOH before agar is added. Autoclave for 15 min at 121 °C and store at room temperature.
2. Pchlide extraction buffer
| Reagent | Final concentration | Quantity or volume |
|---|---|---|
| Acetone | 90% (v/v) | 90 mL |
| Ammonia water | 0.1% (v/v) | 30 μL |
| Total | n/a | Top up to 100 mL with ddH2O |
Note: Store in darkness.
Laboratory supplies
1. 1.5 mL microcentrifuge tubes [Corning Life Sciences (Wujiang) Co., Ltd., catalog number: AXYMCT150C)
2. PES syringe filters, pore 0.22 μm (Tianjin JINTENG Experiment Equipment Co., Ltd., catalog number: JTSF025011)
3. Sterile 1 mL syringe (Shanghai Kindly Enterprise Development Group Co., Ltd. catalog number: 60017031)
4. HPLC 2 mL brown glass vials/caps (Shanghai Titan Scientific Co., Ltd., catalog number: 0204124-FXJYP-0016/02041969-FXJYP-0034)
5. HPLC 200 μL inserts [ANPEL Laboratory Technologies (Shanghai) Inc., catalog number: VDAP-4025PBS-631-100)
Equipment
1. Plant growth chamber [Xunon Instrument (Beijing) Co., Ltd, model: PT-G600)
2. Analytical balance [Shanghai Yueping Scientific Instrument (Suzhou) Manufacturing Co., Ltd., model: FA2204B)
3. Ball mill (DHS Life Science & Technology Co., Ltd., model: TL2010S)
4. Stainless steel grinding beads (Karryda Laboratory Solutions, model: YMZ-S3)
5. Refrigerated centrifuge (Eppendorf, model: 4025R)
6. Laboratory vacuum degassing unit (Sciencetool International Group Co., Ltd., model: T242/DV-9252)
7. Gradient HPLC system (Agilent, model: 1290 Infinity) with a fluorescence detector (Agilent, model: 1260 FLD)
8. Reversed-phase chromatography column (SinoPak, model: BEH T-C18, 5 μm, ID 4.6 mm × 250 mm)
Software and datasets
1. Origin (OriginLab, Version: 2021)
Procedure
A. Serial dilution of Pchlide standard
1. To prepare a standard curve of Pchlide, dilute the Pchlide standard serially from 516 μg/mL (the concentration of DV-Pchlide stock solution) to 5.375 μg/mL using 90% (v/v) acetone. A detailed preparation scheme is summarized in Table 1.
Critical: Conduct all operations on ice under dim green light.
Table 1. Detailed scheme for the serial dilution of Pchlide standard
| Dilution level | Source solution | Volume of source (μL) | Volume of diluent (μL) | Final concentration (μg/mL) |
|---|---|---|---|---|
| Stock | -- | -- | -- | 516.00 |
| 1 | Stock | 200 | 100 | 344 |
| 2 | Level 1 | 100 | 100 | 172 |
| 3 | Level 2 | 100 | 100 | 86 |
| 4 | Level 3 | 100 | 100 | 43 |
| 5 | Level 4 | 100 | 100 | 21.5 |
| 6 | Level 5 | 100 | 100 | 10.75 |
| 7 | Level 6 | 100 | 100 | 5.375 |
| Blank | -- | 0 | 1,000 | 0.00 |
B. Pchlide extraction
1. Plant growth condition
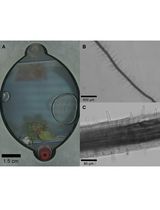
a. Let the 4 °C-vernalized Col-0 and flu seeds grow in 90 mm × 20 mm Petri dishes under continuous light (100 μmol of photons·m-2·s-1) at 22 °C for 7 days. Typically, 30–60 seeds of each sample are sown to yield sufficient tissue for each analysis. To allow accumulation of Pchlide, incubate 6-day-old Col-0 and flu seedlings in darkness for 8 h.
b. To obtain etiolated seedlings, germinate and grow vernalized seeds in darkness for 4 days (cover Petri dishes with aluminum foil to create dark conditions).
Critical: To ensure a high and uniform germination rate, use high-quality seeds.
2. Plant powder preparation
a. Collect 30 mg of dark-treated seedlings and transfer the seedlings into 1.5 mL microcentrifuge tubes preloaded with 3 steel beads.
b. Freeze the sample in liquid nitrogen (LN2) and grind the frozen sample into fine powder using a ball mill at 2,000 rpm for 30 s.
Critical:
1. Operate under dim green light.
2. Hypocotyls should be totally removed using fine tweezers; leave leaves only before freezing the tissue in liquid nitrogen.
Pause point: LN2-frozen sample or sample powder can be stored at -80 °C for up to two days in darkness.
3. Pchlide extraction
a. Resuspend sample powder with 300 μL of Pchlide extraction buffer, mix well by vortexing, and let stand on ice for 5 min.
b. Centrifuge tubes at 14,000× g for 20 min at 4 °C and transfer the supernatant into a new 1.5 mL microcentrifuge tube carefully.
Caution: Perform these steps in a fume hood under dim green light and wear a mask and gloves.
Critical: All samples should be kept at 4 °C or on ice in darkness.
Notes:
1. The material-to-solvent ratio can be optimized according to different experimental goals.
2. It is recommended to analyze extracted samples within 6 h of preparation. All extracts should be stored on ice in the dark before HPLC analysis to prevent Pchlide degradation.
C. Sample preprocessing for HPLC analysis
1. Remove undissolved matter: Pass the supernatant through 0.22 μm filters and transfer 100 μL of filtered supernatant from each sample to a 200 μL microinsert in a 2 mL brown glass vial.
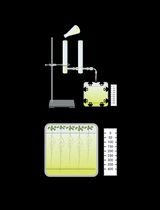
2. Remove dissolved gases: Apply a vacuum degassing unit to eliminate dissolved gases in each sample under 20 kPa for 10 min.
Critical: Carry out all sample filtration and degassing steps at 4 °C and in darkness or under dim green light.
Caution: It is important to preprocess the extract; otherwise, undesirable impurities can cause damage to the HPLC instrument, generate irreproducible and inaccurate data, and/or give rise to high noise and artifactual peaks.
D. Pchlide measurement using the HPLC instrument
1. Instrument setup
a. Connect the mobile phase to the pump inlet. Phase A is purified water, and phase B is acetone with 0.005% [v/v] acetic acid (stored in darkness).
b. Connect the reverse-phase chromatography column to the HPLC system with the correct flow direction.
c. Power on the Agilent 1290 (Figure 1) and the corresponding software. Here, we used the 1290LC mode to control the HPLC instrument.
Critical:
1. Prepare enough mobile phase A and B before testing. For one loop, roughly 15 mL of phase A and 40 mL of phase B are needed to prevent pumping gases into the system.
2. Check the flow direction marked on the surface of the column before connecting to the HPLC instrument, avoiding incorrect flow direction.
Note: Agilent 1290 Infinity II is equipped with two detectors: a fluorescence detector (FLD) and a diode array detector (DAD). In this protocol, we adopt the FLD as the only detector.

Figure 1. Typical HPLC system with a fluorescence detector (FLD) and a diode array detector (DAD) (Agilent 1290)
2. Column equilibration
a. Set bottle size and mobile phase volume in the control software.
b. Clean the solvent lines of HPLC sequentially with mobile phase A and then B. To do this, set the gradient program as follows with a flow rate of 5 mL/min: 4 min of 100% phase A and 4 min of 100% phase B. Run this program in bypass mode.
c. Equilibrate the column sequentially with isocratic elution with a mixture of 60% mobile phase A and 40% mobile phase B for about 15 min until the pressure stabilizes.
Critical: Pay attention to the pressure monitor. If abnormally high pressure is detected (>30 MPa), stop the system immediately and start troubleshooting (see Troubleshooting).
Note: Column equilibration is an absolute prerequisite for accurate quantification. It aims to activate the column, ensure consistent retention time, preserve column efficiency, and remove contaminants to prevent inaccurate data.
3. Parameter setup for FLD-based HPLC program
a. For mobile phase delivery, set a 30-min gradient program with a constant flow rate of 1 mL/min as in Table 2.
b. Set 25 °C as the temperature of the column thermostat. For the FLD panel, set the excitation wavelength to 430 nm and the emission to 630 nm.
c. Set correct information specific to each sample, including location in sampler, injection volume (20 μL), injection counts, applied method, and data storage location.
Note: The injection volume can be adjusted based on the experimental design.
Table 2. Gradient pump settings for a single loop
| Time (min) | % of mobile phase B (acetone) | % of mobile phase A (water) |
|---|---|---|
| 0 | 60 | 40 |
| 5 | 60 | 40 |
| 25 | 100 | 0 |
| 30 | 60 | 40 |
4. Run HPLC analysis
a. Place the sample vials correctly into the sampler.
b. Execute the pre-configured method to initiate the formal run.
Critical: Pay attention to the pressure monitor until it completes the first run. Stop the system and start troubleshooting if the pressure of the column surpasses 38 MPa (see Troubleshooting).
5. Analysis of emission peak area
a. According to previous studies [4] and our experimental results (Figure 2), the retention time of DV-Pchlide is 13–16 min. See Troubleshooting if the retention time of the target varies.
b. Use the system software to perform peak integration, yielding values of peak area.
Critical: Apply the same integration parameters to all peaks, thereby yielding comparable peak area values for quantitative calculation.

Figure 2. Representative peak areas of protochlorophyllide (Pchlide) fluorescence determined using an HPLC system with fluorescence detection. Pchlide is extracted from 4-day-old etiolated Arabidopsis seedlings grown in darkness (A) or from seedlings that were grown under continuous light (LL) for 7 d and incubated in darkness for 8 h (B). The extraction buffer serves as the blank control. The retention time of divinyl-protochlorophyllide (DV-Pchlide) is 13–16 min. Excitation wavelength (Ex) = 430 nm, emission wavelength (Em) = 630 nm. D, darkness; h, hours; d, days.
6. Wash column
a. After completing runs for all samples, pause the pumps (if not automatically paused) and replace phase B with 100% methanol.
b. Edit the bottle size and mobile phase volume for phase B in the control software accordingly. Prime the lines with 100% methanol (i.e., 100% phase B) at a flow rate of 5 mL/min for 4 min in bypass mode.
c. Execute column washing according to the program presented in Table 3.
Table 3. Gradient pump settings for column washing
| Time (min) | % of mobile phase B (methanol) | % of mobile phase A (water) |
|---|---|---|
| 0 | 90 | 10 |
| 15.0 | 90 | 10 |
| 15.1 | 70 | 30 |
| 30.0 | 70 | 30 |
| 30.1 | 50 | 50 |
| 45.0 | 50 | 50 |
| 45.1 | 20 | 80 |
| 75.0 | 20 | 80 |
| 75.1 | 10 | 90 |
| 90.0 | 10 | 90 |
| 90.1 | 15 | 85 |
| 100.0 | 15 | 85 |
7. Close system software, power off the instrument, and disconnect the column.
E. Result analysis
Convert peak areas to concentrations (see Data analysis)
Data analysis
A. Standard curve of Pchlide concentration and fluorescence peak area
Input Pchlide concentrations and the corresponding fluorescence peak area values (Table 4) in Origin software and generate scatterplots with best-fit trendline, equation, and R-square (Figure 3).
Table 4. Pchlide standard concentrations and the corresponding fluorescence peak area values
| Dilution level | Concentration (pg/μL) | Technical replicates | Peak areas (LU*S) |
| 7 | 5.375 | 1 | 0.16831 |
| 2 | 0.190052 | ||
| 3 | 0.156614 | ||
| 6 | 10.75 | 1 | 0.355629 |
| 2 | 0.276175 | ||
| 3 | 0.33615 | ||
| 5 | 21.5 | 1 | 0.772337 |
| 2 | 0.850357 | ||
| 3 | 0.684616 | ||
| 4 | 43 | 1 | 1.52287 |
| 2 | 1.55019 | ||
| 3 | 1.41781 | ||
| 3 | 86 | 1 | 3.13215 |
| 2 | 2.73551 | ||
| 3 | 2.8933 | ||
| 2 | 172 | 1 | 6.14058 |
| 2 | 6.14949 | ||
| 3 | 6.21416 | ||
| 1 | 344 | 1 | 12.58352 |
| 2 | 13.0317 | ||
| 3 | 12.91579 |

Figure 3. Standard curve representing the correlation between HPLC fluorescence peak area and protochlorophyllide (Pchlide) concentration
B. Pchlide concentration of sample extracts
Substitute peak area values of the sample (as shown in Figure 3) in the equation of the standard curve to determine Pchlide concentration in each extract.
C. Pchlide content in fresh samples
Calculate the Pchlide content in each fresh sample using the equation below:
In our analysis, Pchlide content in fresh cotyledons of 7-day-old Col-0 and flu seedlings incubated in darkness for 8 h was approximately 0.92 and 8.63 nmol/g, respectively. In 4-day-old etiolated Col-0 and flu seedlings, the Pchlide content was approximately 4.64 and 34.45 nmol/g, respectively.
Validation of protocol
This protocol has been used and validated in the following research article:
Zhao et al. [11]. The chloroplast translocon subunit TOC33 relays singlet oxygen-induced chloroplast-to-nucleus retrograde signaling in Arabidopsis. Molecular Plant (Figure 1E).
General notes and troubleshooting
General notes
1. Perform all extraction steps on ice and in a light-proof environment to prevent the photoconversion and degradation of Pchlide.
2. Prepare HPLC-grade samples and utilize the HPLC system strictly adhering to the standard requirements.
3. For a whole analysis, three biological replicates are needed.
4. For each biological replicate, it is necessary to set up three technical replicates, i.e., three injections.
5. Make sure to complete all HPLC runs within the validity period of the standard curve, e.g., within 2 weeks.
6. We do not recommend splitting a single powdered sample into three tubes to prepare three separate extracts, as this will neutralize variations between different biological samples.
Troubleshooting
Problem 1: Abnormally high pressure during column equilibration.
Possible causes: Column is connected to the HPLC system in the wrong direction, or the column is partially clogged.
Solution: Perform column cleaning according to the manufacturer’s instructions.
Problem 2: Abnormally high pressure during the HPLC run.
Possible cause: Impurity of mobile phase or samples.
Solution: Used freshly prepared and strictly HPLC-grade mobile phases to flush the column and replace with strictly degassed and filtered samples.
Problem 3: Retention time is inconsistent.
Possible causes: Undesirable mobile phase, column degradation, leaks in the tubing, pump failures, fluctuations in temperature.
Solutions: Replace with freshly prepared and strictly HPLC-grade mobile phases and ensure the addition of acetic acid; refer to the manufacturer’s instructions to troubleshoot.
Acknowledgments
Conceptualization, L.W.; Investigation, L.Z. and F.Z.; Writing—Original Draft, F.Z.; Writing—Review & Editing, L.W., F.Z., and L.Z.; Funding acquisition, L.W.; Supervision, L.W.
We would like to thank the core facility platform of the College of Plant Protection at China Agricultural University for providing access to Agilent 1290 and Dr. Linlu Qi for operation training and troubleshooting on the HPLC system. This work was supported by the National Key Research and Development Program of China (grant no. 2023YFF1000203-2) and the National Natural Science Foundation of China (NSFC) (grant no. 32170284) to L.W. This protocol was optimized from Gosling et al. [4] and validated by Zhao et al. [11].
Competing interests
These authors declare no competing interests.
References
- Li, M. and Kim, C. (2022). Chloroplast ROS and stress signaling. Plant Commun. 3(1): 100264. https://doi.org/10.1016/j.xplc.2021.100264
- Tanaka, A. and Tanaka, R. (2006). Chlorophyll metabolism. Curr Opin Plant Biol. 9(3): 248–255. https://doi.org/10.1016/j.pbi.2006.03.011
- Apel, K. and Hirt, H. (2004). Reactive oxygen species: Metabolism, oxidative stress, and signal transduction. Annu Rev Plant Biol. 55: 373–399. https://doi.org/10.1146/annurev.arplant.55.031903.141701
- Goslings, D., Meskauskiene, R., Kim, C. H., Lee, K. P., Nater, M. and Apel, K. (2004). Concurrent interactions of heme and FLU with Glu tRNA reductase (HEMA1), the target of metabolic feedback inhibition of tetrapyrrole biosynthesis, in dark- and light-grown Arabidopsis plants. Plant J. 40(6): 957–967. https://doi.org/10.1111/j.1365-313X.2004.02262.x
- Wang, P. and Grimm, B. (2021). Connecting Chlorophyll Metabolism with Accumulation of the Photosynthetic Apparatus. Trends Plant Sci. 26(5): 484–495. https://doi.org/10.1016/j.tplants.2020.12.005
- op den Camp, R. G. L., Przybyla, D., Ochsenbein, C., Laloi, C., Kim, C. H., Danon, A., Wagner, D., Hideg, E., Göbel, C., Feussner, I., et al. (2003). Rapid induction of distinct stress responses after the release of singlet oxygen in Arabidopsis. Plant Cell. 15(10): 2320–2332. https://doi.org/10.1105/Tpc.014662
- Meskauskiene, R., Nater, M., Goslings, D., Kessler, F., den Camp, R. O. and Apel, K. (2001). FLU: A negative regulator of chlorophyll biosynthesis in Arabidopsis thaliana. Proc Natl Acad Sci USA. 98(22): 12826–12831. https://doi.org/10.1073/pnas.221252798
- Wang, L. and Apel, K. (2019). Dose-dependent effects of 1O2 in chloroplasts are determined by its timing and localization of production. J Exp Bot. 70(1): 29–40. https://doi.org/10.1093/jxb/ery343
- Wang, L., Kim, C., Xu, X., Piskurewicz, U., Dogra, V., Singh, S., Mahler, H. and Apel, K. (2016). Singlet oxygen- and EXECUTER1-mediated signaling is initiated in grana margins and depends on the protease FtsH2. Proc Natl Acad Sci USA. 113(26): E3792–E3800. https://doi.org/10.1073/pnas.1603562113
- Wagner, D., Przybyla, D., Camp, R. O. D., Kim, C., Landgraf, F., Lee, K. P., Würsch, M., Laloi, C., Nater, M., Hideg, E., et al. (2004). The genetic basis of singlet oxygen-induced stress responses of Arabidopsis thaliana. Science. 306(5699): 1183–1185. https://doi.org/10.1126/science.1103178
- Zhao, H., Zhang, F., Wang, X., Liu, K., Zhang, L., Li, J., Kim, C. and Wang, L. (2025). The chloroplast translocon subunit TOC33 relays singlet oxygen-induced chloroplast-to-nucleus retrograde signaling in Arabidopsis. Mol Plant. 18(10): 1706–1723. https://doi.org/10.1016/j.molp.2025.08.013
- Dogra, V., Li, M., Singh, S., Li, M. and Kim, C. (2019). Oxidative post-translational modification of EXECUTER1 is required for singlet oxygen sensing in plastids. Nat Commun. 10(1): 2834. https://doi.org/10.1038/s41467-019-10760-6
- Wang, L., Leister, D., Guan, L., Zheng, Y., Schneider, K., Lehmann, M., Apel, K. and Kleine, T. (2020). The Arabidopsis SAFEGUARD1 suppresses singlet oxygen-induced stress responses by protecting grana margins. Proc Natl Acad Sci USA. 117(12): 6918–6927. https://doi.org/10.1073/pnas.1918640117
- Abbas, M., Sharma, G., Dambire, C., Marquez, J., Alonso-Blanco, C., Proano, K. and Holdsworth, M. J. (2022). An oxygen-sensing mechanism for angiosperm adaptation to altitude. Nature. 606(7914): 565–569. https://doi.org/10.1038/s41586-022-04740-y
- Telfer, A. (2014). Singlet oxygen production by PSII under light stress: mechanism, detection and the protective role of beta-carotene. Plant Cell Physiol. 55(7): 1216–1223. https://doi.org/10.1093/pcp/pcu040
- Fischer, B. B., Hideg, E. and Krieger-Liszkay, A. (2013). Production, detection, and signaling of singlet oxygen in photosynthetic organisms. Antioxid Redox Signaling. 18(16): 2145–2162. https://doi.org/10.1089/ars.2012.5124
- Wang, L. and Kleine, T. (2021). Singlet oxygen and protochlorophyllide detection in Arabidopsis thaliana. Methods Mol Biol. 2202: 63–69. https://doi.org/10.1007/978-1-0716-0896-8_5
- Pilný, J., Kopečná, J., Noda, J. and Sobotka, R. (2015). Detection and quantification of heme and chlorophyll precursors using a high performance liquid chromatography (HPLC) system equipped with two fluorescence detectors. Bio-Protoc. 5(3): e1390. https://doi.org/10.21769/BioProtoc.1390
Article Information
Publication history
Received: Oct 21, 2025
Accepted: Nov 20, 2025
Available online: Dec 3, 2025
Published: Jan 5, 2026
Copyright
© 2026 The Author(s); This is an open access article under the CC BY-NC license (https://creativecommons.org/licenses/by-nc/4.0/).
How to cite
Zhang, F., Zhang, L. and Wang, L. (2026). Quantification of Protochlorophyllide (Pchlide) Content in Arabidopsis Seedlings Using a High-Performance Liquid Chromatography (HPLC) System. Bio-protocol 16(1): e5553. DOI: 10.21769/BioProtoc.5553.
Category
Plant Science > Plant biochemistry > Other compound
Biochemistry > Other compound > Chlorophyll
Plant Science > Plant physiology > Abiotic stress
Do you have any questions about this protocol?
Post your question to gather feedback from the community. We will also invite the authors of this article to respond.