- Protocols

- Articles and Issues
- For Authors
- About
- Become a Reviewer

Vascularization of Human Pancreatic Islets With Adaptive Endothelial Cells for In Vitro Analysis and In Vivo Transplantation
Published: Vol 15, Iss 24, Dec 20, 2025 DOI: 10.21769/BioProtoc.5550 Views: 1104
Reviewed by: Joyce ChiuAnonymous reviewer(s)
Original research article
The authors used this protocol in:

Jan 2025

Protocol Collections
Comprehensive collections of detailed, peer-reviewed protocols focusing on specific topics


Related protocols
Abstract
The pancreatic islet, the only type of tissue that secretes insulin in response to elevated blood glucose, plays a vital role in diabetes development and treatment. While various islet vascularization strategies have been developed, they have been hindered by major limitations such as relying on pre-patterning and the inability to span long distances. Furthermore, few strategies have demonstrated robust enough vascularization in vivo to support therapeutic subcutaneous islet transplantation. Using adaptive endothelial cells (ECs) reprogrammed by transient expression of the ETS Variant Transcription Factor 2 (ETV-2) gene, we have physiologically vascularized human islets within a generic microchamber and have achieved functional engraftment of human islets in the subcutaneous space of mice. Such adaptive ECs, which we term reprogrammed vascular ECs (R-VECs), have been proven to be a suitable tool for both in vitro disease modeling and in vivo transplantation of not only islets but also other organoids.
Key features
• This protocol contains two parts: the in vitro and in vivo parts, both utilizing adaptable endothelial cells to functionally vascularize human islets.
• The in vitro portion of this protocol describes the method to culture human islets in a vascular bed within a large and commercially available microchamber.
• The in vivo portion of this protocol provides a step-by-step procedure to reverse hyperglycemia in streptozotocin-induced diabetic mice.
Keywords: Pancreatic isletGraphical overview
Background
According to the August 2021–August 2023 cycle of the National Health and Nutrition Examination Survey (NHANES) published by the Centers for Disease Control and Prevention, 15.8% of US adults are estimated to have diabetes. Type 1 diabetes (T1D) is caused by the autoimmune destruction of pancreatic islets, the cells that produce insulin in response to elevated glucose levels [1]. In contrast, type 2 diabetes (T2D) generally begins with reduced insulin sensitivity in insulin-responsive tissues, such as the liver, muscles, and adipose tissue. The body often compensates for such insulin resistance by islet proliferation. However, failure in compensatory islet proliferation and islet dysfunction leads to T2D onset [2]. Therefore, strategies that promote islet regeneration or function hold great potential in treating diabetes.
Among the medications used in diabetes treatment, only DPP4 and GLP-1 receptor agonists can potentially improve islet function [3]. No medications have been proven to promote islet regeneration, apart from possibly harmine [4], which is still under clinical trial. One obstacle in the development of islet-targeting drugs is the difficulty in culturing islets in vitro for the long term. Pancreatic islets are spherical clusters of cells with diameters ranging from 50 to 500 μm [5]. A human adult pancreas contains 1–2 million islets, composing approximately 2% of the pancreatic mass. Compared to the acinar and ductal tissues of the pancreas, islets are highly vascular and receive 20% of the blood supply to the pancreas [6]. The most commonly used protocol for isolating human islets uses the Ricordi automated method [7], which utilizes physical forces and enzymatic reactions to separate islets from exocrine tissues and purifies islets by gradient centrifugation. To then culture the isolated islets, the two most commonly used media are RPMI 1640 supplemented with 10% serum or serum-free Connaught’s Medical Research Lab (CMRL) medium, neither of which can support normal islet function for more than a week [8]. Commercial media with undisclosed recipes exist, such as the PIM(S)® from Prodo Lab, which may permit long-term islet culture for up to 21 days, as reported by the company’s documents. It therefore remains a challenge to sustain islet function long-term in vitro.
Part of the difficulty in long-term culturing of islets is due to the fact that islet isolation protocols disrupt the islets’ rich vascular connections. Most endothelial cells within the islet are believed to deteriorate soon after isolation, leaving cells within the center of the avascular islet with limited nutrients and oxygen [9]. Various strategies to vascularize in vitro cultured islets include prefabricated chips [10] or bioprinting [11]. These strategies require highly specialized techniques and do not achieve an intra-islet vascular density comparable to that of native islet capillaries. In this protocol, we convert generic endothelial cells (ECs) into adaptable ECs by overexpression of the endothelial pioneer transcription factor ETV-2. Adaptable ECs functionally vascularize islets in vitro and sustain islet function for more than 20 weeks. This approach provides an ideal platform for screening therapeutics to promote islet functional improvement or regeneration.
Beyond drugs to augment islet functional mass, islet β-cell replacement therapy is considered another promising treatment for diabetes, which provides finely tuned insulin secretion at physiological levels by transplanting insulin-secreting islet cells derived from either human deceased donors or from stem cells [12]. Clinically, islet transplantation is used to treat T1D patients with severe hypoglycemic complications. There are several obstacles preventing cellular therapy from expanding to a wider T1D population or even to T2D patients, including the use of immunosuppressants, scarcity of donor cells, and high costs. Furthermore, clinical transplantation protocols involve the infusion of either deceased donor-derived or stem cell–derived islets into the portal vein of the liver [13]. Portal infusion of transplanted cells carries with it the small but very serious risk of thrombosis, also limiting the infusion of anything larger than naked islets. Therefore, attempts to encapsulate islets for immune shielding have involved alternative transplantation sites such as the subcutaneous space [14] and the omentum [15]. Among the various alternative transplantation sites, the subcutaneous space is the most promising due to its large size, ease of access and monitoring, and ability to retrieve transplanted cells. Compared to most other sites, such as the kidney capsule, omentum, and anterior chamber of the eye, the subcutaneous space is enormous, making it ideal to construct sophisticated structures not only to protect grafts from immune attack but to establish a tissue-specific vascular niche to sustain islet functional mass. Transplanting islets in the subcutaneous space, however, has long been hampered by the difficulty in establishing a sufficient blood supply to the grafts [16,17]. In this protocol, we present a method of co-transplanting islets with ETV-2-expressing adaptable ECs to achieve functional engraftment of human islets within the subcutaneous space.
Materials and reagents
Biological materials
1. Human umbilical vein endothelial cells (HUVECs)
Note: HUVECs were generated in-house following a published protocol [18]. Briefly, endothelial cells were digested from freshly acquired umbilical cord veins through collagenase digestion, followed by culturing in human EC medium in gelatin-coated 10-cm tissue culture dishes. The 10-cm tissue culture dish was coated by incubating with 4 mL of 0.1% gelatin for at least 30 min at 37 °C.
2. Lentivirus carrying hPGK-driven ETV2 (Lenti-ETV2); constructed and ordered from VectorBuilder (the construction map of the lentivirus vector plasmid is shown in Figure 1)
3. Adeno-associated virus carrying hPGK-driven EGFP (AAV-EGFP); ordered from VectorBuilder
4. Human islets, obtained from the following three sources: the Integrated Islet Distribution Program (IIDP), Columbia Center for Translational Immunology (CCTI), or Prodo Laboratories Inc.
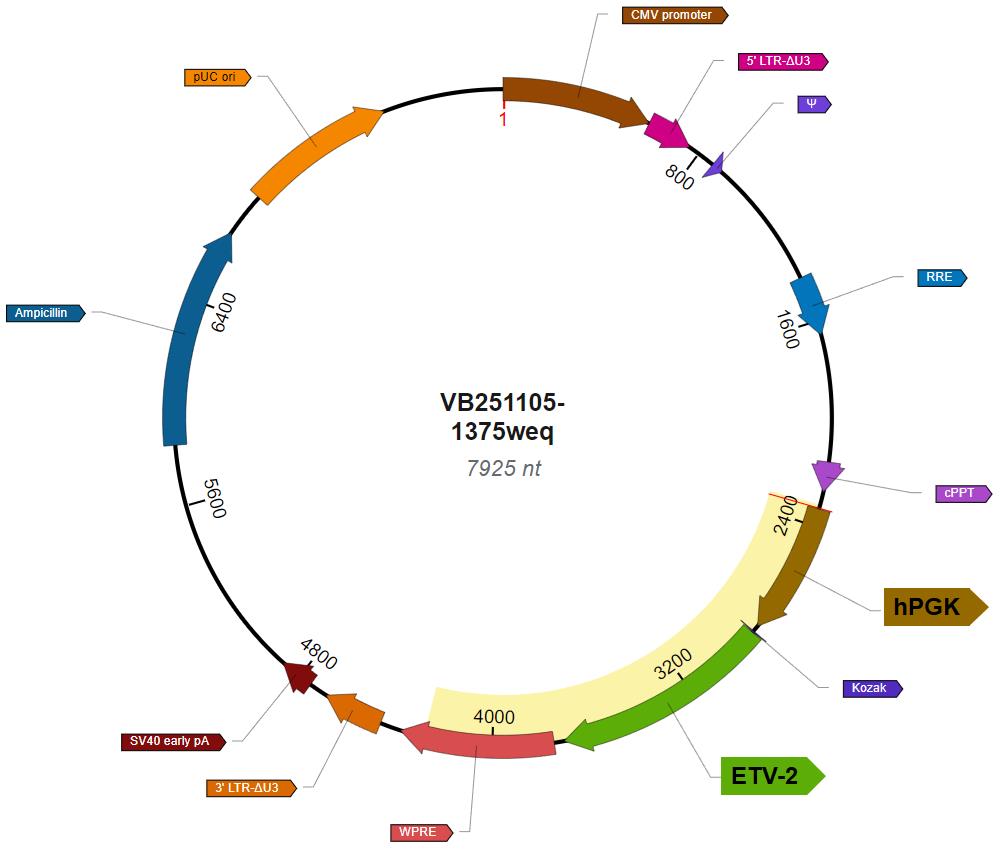
Figure 1. Vector map of Lenti-ETV2
Experimental animals
All mice used in this research were either purchased from Charles River Laboratories or bred at Weill Cornell Animal Facility. All animal work was approved by the Weill Cornell IACUC committee, with the protocol numbers 2009-0611 and 2023-0026.
Reagents
1. Medium 199, Earle's salts (Thermo Fisher Scientific, GibcoTM, catalog number: 11150067)
2. Penicillin-streptomycin-neomycin (PSN) antibiotic mixture (Thermo Fisher Scientific, GibcoTM, catalog number: 15640055)
3. GlutaMAXTM supplement (Thermo Fisher Scientific, GibcoTM, catalog number: 35050061)
4. Chemically defined lipid concentrate (Thermo Fisher Scientific, GibcoTM, catalog number: 11905031)
5. HEPES (1 M) (Thermo Fisher Scientific, GibcoTM, catalog number: 15630080)
6. Heparin sodium salt from porcine intestinal mucosa (Millipore Sigma, catalog number: H3149-10KU)
7. N-Acetyl-cysteine (Millipore Sigma, catalog number: A9165-5G)
8. Human FGF-basic recombinant protein (Thermo Fisher Scientific, PeproTech®, catalog number: 100-18B)
9. Human IGF-I recombinant protein (Thermo Fisher Scientific, PeproTech®, catalog number: 100-11)
10. Human EGF recombinant protein (Thermo Fisher Scientific, PeproTech®, catalog number: AF-11-15)
11. TheraPEAK® X-VIVO® 10 (Lonza, catalog number: BEBP04-743Q)
12. Fibrinogen from bovine plasma (Millipore Sigma, catalog number: 341573)
13. Thrombin from bovine plasma (Millipore Sigma, catalog number: T4648)
14. StemSpanTM SFEM (STEMCELL Technology, catalog number: 09650)
15. KnockOutTM serum replacement (Thermo Fisher Scientific, GibcoTM, catalog number: 10828028)
16. RPMI 1640 medium (Thermo Fisher Scientific, GibcoTM, catalog number: 11875093)
17. AlbuMAXTM II lipid-rich BSA (Thermo Fisher Scientific, GibcoTM, catalog number: 11021029)
18. Transferrin human (Millipore Sigma, catalog number: T8158)
19. Human recombinant prolactin (STEMCELL Technology, catalog number: 78098.1)
20. Ethanolamine (Millipore Sigma, catalog number: 15014)
21. 1,2-Dioleoyl-sn-glycero-3-phosphoethanolamine (Millipore Sigma, catalog number: 42490)
22. Sodium selenite (Millipore Sigma, catalog number: 71950)
23. HEPES, suitable for cell culture (Millipore Sigma, catalog number: H4034)
24. Bovine serum albumin (BSA), suitable for cell culture (Millipore Sigma, catalog number: A1470)
25. Fluo-4 DirectTM Calcium Assay kit (Thermo Fisher, InvitrogenTM, catalog number: F10471)
26. Streptozotocin (STZ) (Millipore Sigma, catalog number: S0130)
27. Accutase® (Thermo Fisher Scientific, catalog number: 00-4555-56)
28. Isoflurane (Covetrus, catalog number: 11695-6777-1)
29. Matrigel® growth factor reduced (GFR) basement membrane matrix (Corning, catalog number: 356231)
30. 10× DMEM (low glucose) (Millipore Sigma, catalog number: D2429)
31. Bovine type 1 collagen (Advanced Biomatrix, catalog number: 5225)
32. Insulin Chemiluminescence ELISA Jumbo Pack (Alpco, catalog number: 80-INSHU-CH10)
33. Gelatin (Carolina, catalog number: 864660)
34. Matrigel (Corning, catalog number: 356237)
Solutions
1. Human EC medium (see Recipes)
2. Tube medium (see Recipes)
3. Serum-free islet (SFI) medium (see Recipes)
4. Krebs-Ringer bicarbonate solution, HEPES-buffered (KRBH buffer) (see Recipes)
5. Cryopreservation solution (see Recipes)
Recipes
1. Human EC medium
| Component | Volume or final concentration |
|---|---|
| Medium 199, Earle's salts | 500 mL |
| Penicillin-streptomycin-neomycin antibiotic mixture | 6.25 mL |
| GlutaMAXTM supplement | 6.25 mL |
| HEPES (1 M) | 9.375 mL |
| Chemically defined lipid concentrate | 6.25 mg/mL |
| Heparin sodium salt from porcine intestinal mucosa | 0.1 mg/mL |
| Fetal bovine serum | 125 mL |
| N-Acetyl-L-cysteine | 1 mM |
| Human FGF-basic recombinant protein | 10 ng/mL |
| Human IGF-I recombinant protein | 10 ng/mL |
| Human EGF recombinant protein | 10 ng/mL |
| Total | ~650 mL |
2. Tube medium
| Components | Proportion | Volume |
|---|---|---|
| StemSpanTM SFEM | 90% | 45 mL |
| KnockOutTM serum replacement | 10% | 5 mL |
| Total | 100% | 50 mL |
3. Serum-free islet (SFI) medium
| Components | Volume or final concentration |
|---|---|
| RPMI 1640 medium | 500 mL |
| AlbuMAXTM II lipid-rich BSA | 0.20% |
| Transferrin human | 10 μg/mL |
| Human prolactin recombinant protein | 20 ng/mL |
| Human IGF-I recombinant protein | 10 ng/mL |
| Human FGF-basic recombinant protein | 10 ng/mL |
| Ethanolamine | 50 μM |
| 1,2-Dioleoyl-sn-glycero-3-phosphoethanolamine | 50 μM |
| Sodium selenite | 6.7 μg/mL |
| Heparin sodium salt from porcine intestinal mucosa | 100 ng/mL |
| Total | ~500 mL |
4. Krebs-Ringer bicarbonate solution, HEPES-buffered (KRBH buffer)
| Component | Final concentration |
|---|---|
| NaCl | 128.8 mM |
| KCl | 4.8 mM |
| KH2PO4 | 1.2 mM |
| MgSO4·7H2O | 1.2 mM |
| CaCl2 | 2.5 mM |
| NaHCO3 | 5 mM |
| HEPES | 10 mM |
| D-glucose | 2 mM |
| Bovine serum albumin | 0.1% |
5. Cryopreservation solution
| Components | Proportion | Volume |
|---|---|---|
| Human EC medium | 40% | 20 mL |
| Fetal bovine serum | 50% | 25 mL |
| DMSO | 10% | 5 mL |
| Total | 100% | 50 mL |
Laboratory supplies
1. 1 mL syringe (BD, catalog number: 309659)
2. 5 mL syringe (BD, catalog number: 309647)
3. μ-slide VI 0.4 (Ibidi, catalog number: 80606)
Equipment
1. Cell incubator (e.g., Panasonic, model: MCO-19M-PA or any cell incubator that is capable of maintaining the temperature at 37 °C and the CO2 level at 5%)
2. Biosafety cabinet (e.g., Baker, model: SterilGARD SG6C3A-HE or any certified class 2 biosafety cabinet designed for cell culture)
3. Heated veterinary operating table (e.g., PECO Services, model: V500DVStat or any heated pad that can sustain a temperature of 37 °C)
4. Fluorescence microscope (e.g., Confocol.nl NL5+ or any confocal or fluorescence microscope with the capability of taking time-lapse images at one acquisition per second and with an environmental chamber to maintain sample temperature at 37 °C)
Procedure
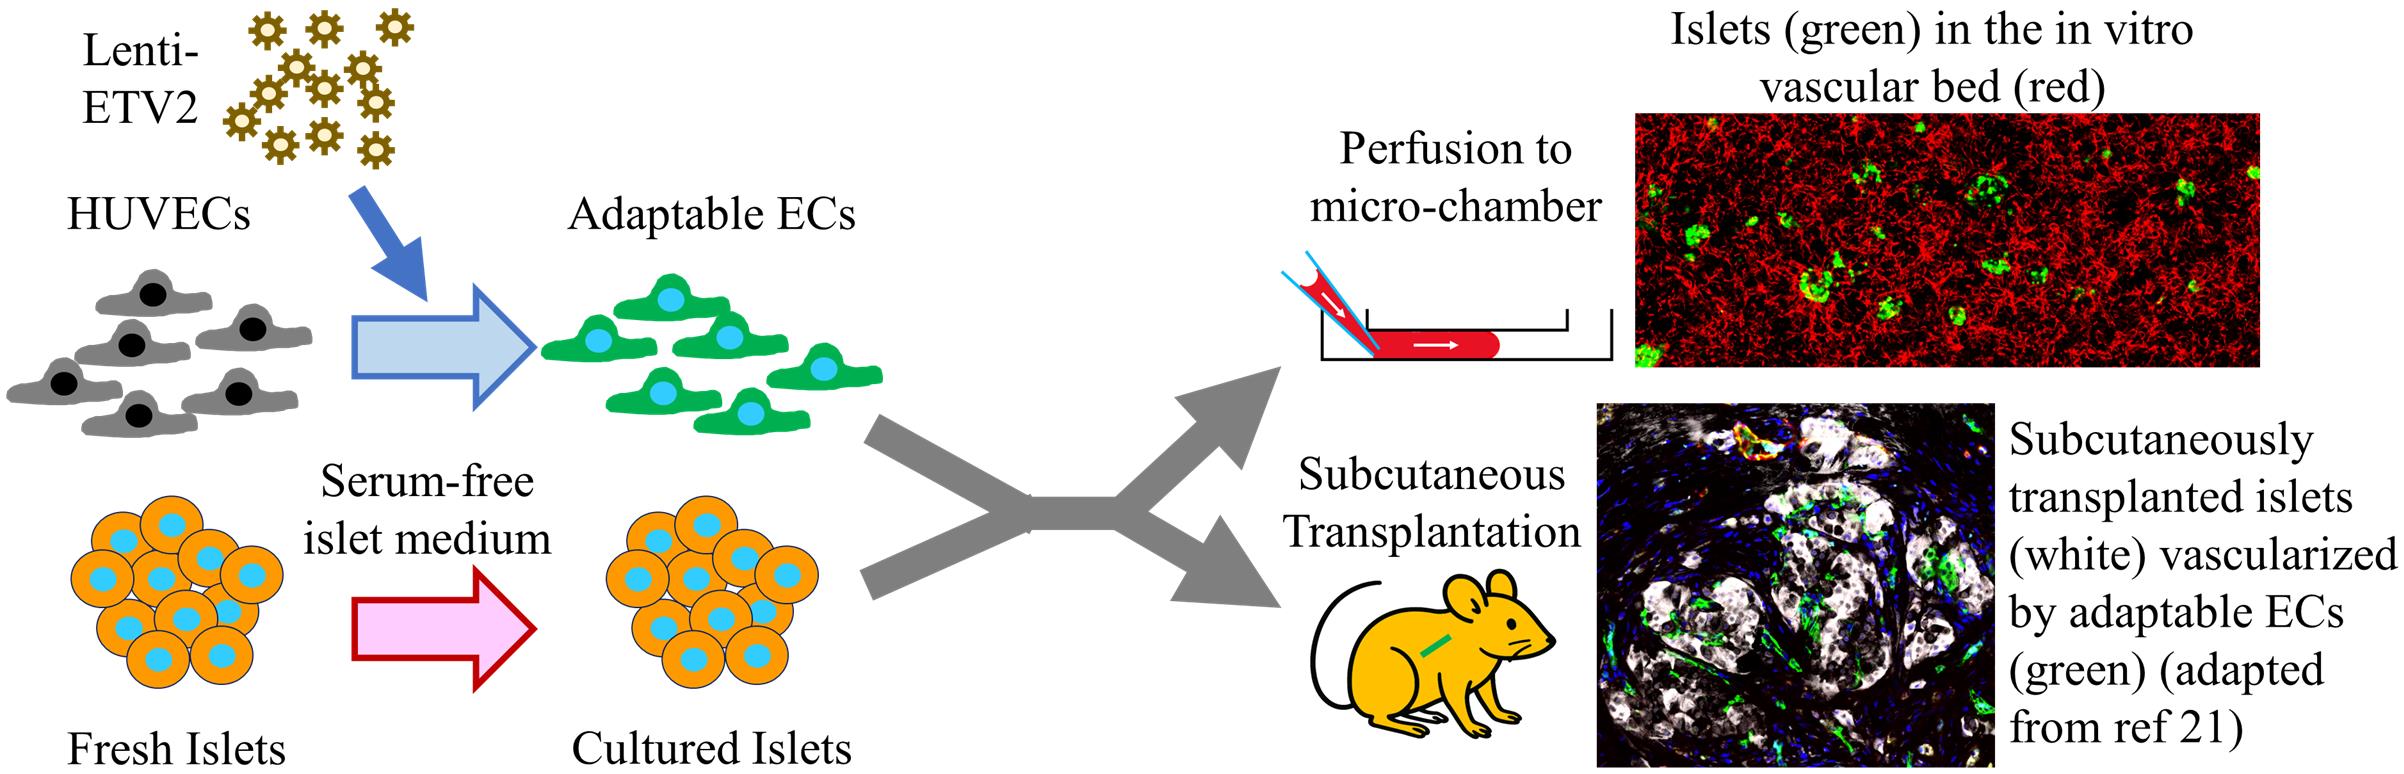
A. To generate adaptive ECs by overexpressing ETV-2
Generic ECs isolated and expanded from terminally differentiated tissues lack the capability of forming perfusable vessels [19]. To imbue ECs with tube-forming capacity, we overexpress ETV-2, a pioneer transcription factor that is critical for EC development [20], in generic ECs to convert them to adaptable ECs. These ECs have a high capability of forming perfusable blood vessels in vitro and in vivo. Here are the steps to generate adaptable ECs from human umbilical vein endothelial cells (HUVECs) (Figure 2A).

Figure 2. Generation of adaptable endothelial cells (ECs) by expressing ETV-2. (A) Schematic of generating adaptable ECs. (B) Representative image of cultured adaptable ECs at nearly 100% confluence. Scale bar, 100 μm. (C) Western blot showing gradually reduced expression of ETV2 in adaptable ECs. Panel C is adapted from [19].
1. Culture freshly isolated HUVECs in human EC medium for 3–5 passages at 37 °C and 5% oxygen before cryo-preserving them with cryopreservation solution in liquid nitrogen at a concentration of 1–2 million per mL, 1 mL per vial.
Note: Alternatively, in cases when human umbilical veins are not accessible, HUVECs can also be purchased from commercial sources, such as Lonza (C2519A) and STEMCELL Technologies (200-0630). The authors of this protocol have not validated any of the commercially available HUVECs.
2. To convert HUVECs to adaptive ECs, quickly and fully thaw one vial (containing 1 million) of HUVECs in a 37 °C water bath.
3. Transfer the content to a 15 mL conical tube and spin down the cells at 500× g for 5 min.
4. After decanting the DMSO-containing supernatant, resuspend cells in 10 mL of EC medium and plate on a 10 cm dish pre-coated with 4 mL of 0.1% gelatin A for at least 30 min at 37 °C.
5. Once cells reach >90% confluence (usually after 1–3 days), digest them by incubating with 1 mL of Accutase at room temperature for 3–6 min.
6. Then, gently detach cells with 2 mL of EC medium and spin down at 500× g for 5 min to remove Accutase.
7. Resuspend the cell pellet with 8 mL of EC medium.
8. Distribute 1 mL of the cell suspension to each well of a 6-well plate; add the remaining 2 mL of cell suspension back to the original 10 cm dish. In most cases, HUVECs in the 6-well plate are about 80% confluent on the next day and are ready for lentivirus transfection. HUVECs kept cultured in the original 10 cm dish can be cryo-preserved again for future use once they reach >90% confluence.
9. On the second day of plating HUVECs in the 6-well plate, add Lenti-ETV2 to HUVECs, in a gradient of MOI of 5, 10, and 15. Use the highest MOI without apparent cell death for the following experiments. Massive cell death is indicated by a substantially increased number of floating cells. Store lentivirus ordered from a commercial source that constructed the vector and produced the virus at -80 °C upon reception. Aliquot one large vial (~300 μL) into 10 small vials days before transfection and freeze all small vials at -80 °C to ensure that the virus does not undergo multiple freeze-thaw cycles prior to each use. On the day of lentivirus transfection, calculate the MOI based on the virus titration provided by the vendor. Based on the MOI calculation, thaw the required number of small lentivirus vials on ice and add the required volume of virus to HUVECs. Discard any unused thawed virus to avoid further freezing-thawing cycles. In such a way, all lentiviruses experience two cycles of freezing and thawing to ensure reproducibility between batches.
10. HUVECs overexpressing ETV-2 are now called adaptive ECs or reprogrammed vascular endothelial cells (R-VECs). The typical morphology of adaptable ECs is shown in Figure 2B. There are two ways to expand adaptive ECs:
a. Gradual expansion: Transfer adaptive ECs from 1 well of a 6-well plate to a 10 cm dish. When cells reach >90% confluence, expand cells as a 1:3 split. Repeat this 1:3 split 2–3 more times to result in 30–60 10 cm dishes. Freeze adaptive ECs from each 10 cm dish in a cryovial.
b. Passing all adaptive ECs from one 6-well into ten 10-cm dishes. Cell colonies will grow in the following days, and the dishes will reach near 100% confluence in about 2 weeks, with medium change every 3–5 days. Freeze adaptive ECs in one cryovial per 10-cm dish after 6–8 passages.
Here, we present the protocol for generating adaptable ECs using HUVECs, but we have tested and proved that this protocol works with adipose tissue-derived ECs as well [19]. Also, it is quite likely that this protocol works with ECs derived from other tissues. As we previously reported [19], the expression of ETV-2 gradually decreases after the initial transfection (Figure 2C), even though the adaptive conversion effect remains.
Adaptive ECs maintain their capability to form vasculature in vitro and in vivo for multiple passages after being thawed. Nonetheless, the most reliable and convenient way to acquire adaptive ECs for in vitro or in vivo vascularization is to recover a vial in a 10-cm dish and use the cells within the next 1 or 2 days without further passaging, which have similar vascularization capability as freshly transfected adaptive ECs. For heavy use of adaptive ECs, using cryopreserved cells dramatically reduces the workload of generating new adaptive ECs each time.
B. Setting up an in vitro vascular bed with embedded islets
We have reported using adaptable ECs to form perfusable vascular beds in in-house casted microfluidic devices [19] and in commercially available microchambers [21]. The protocol described below uses a commercially available microchamber called the μ-Slide VI 0.4 (ibidi). It has six channels per slide. Each channel has two ports, which can be connected to generic syringes ranging from 1 to 5 mL. The dimension of a channel is 0.4 mm × 17 mm × 3.8 mm as height × length × width, with a volume of 30 μL (Figure 3A). Here are the procedures to set up islets in the in vitro vascular bed (Figure 3B).

Figure 3. In vitro vascularization of islets within the adaptable endothelial cell (EC)-derived vascular bed. (A) Diagram of the dimensions of the ibidi μ-Slide VI 0.4 (adopted from [21]). (B) Illustration of the setup of the vascular bed within the microchamber. (C) Microchamber set up with 1-mL syringes attached to both ports, from different angles. (D) Islets in a vascular bed. Islets are shown as red, which express mCherry through AAV transfection. Adaptable ECs are shown as green, which express EGFP through lentivirus transfection. Scale bar, 100 μm.
1. Thaw adaptable ECs 2–3 days before use. When they reach 80%–95% confluence in culture, digest adaptive ECs and mix them with human islets.
Note: The recommended number of adaptable ECs ranges from 60,000 to 300,000 cells per channel, which should be optimized for each batch of adaptable ECs. For each new batch of adaptive ECs, we set up three channels with varying cell concentrations of 10,000, 15,000, or 20,000 cells per channel. No perfusable vessels will form if the cell concentration is too low, and the matrix gel will be digested and will not last long if the cell concentration is too high. Thus, the concentration that forms perfusable vessels and lasts the longest will be used for all future experiments using this batch. If no vessel is formed, a higher concentration is tested. If the matrix degrades too quickly, a lower concentration is tested.
2. Hand-pick 100 human islets per channel. This number has been optimized for imaging and insulin secretion examination and can be further modified according to specific applications.
3. Mix and centrifuge adaptable ECs and islets at 500× g for 5 min at 4 °C. Gently resuspend the pellet in 3 μL of serum-free hematopoietic stem cell medium TheraPEAK® X-VIVO® 10. Add 24 μL of bovine fibrinogen to the mixture at a final concentration of 2.5 mg/mL. Place the mixture on ice until it is ready to be loaded into the channel.
4. Immediately prior to loading, add bovine thrombin to the mixture at a final concentration of 1 U/mL. It takes approximately 1 min for the mixture to solidify; as such, the cell mixture must be loaded into the channel before this. Load the mixture into the channel from one end by tilting the pipette tip while loading, as indicated in Figure 3B.
5. After loading all channels in a slide, incubate the slide at 37 °C for 30 min to allow full gelation. Then, pipette 50 μL of tube medium into both ports. It is critical to add this small volume to each port before connecting the syringes, because inserting the syringe in an air-filled port will generate a gas bubble that blocks the fluid flow. Then, connect a syringe (1–5 mL) to each port, and add 1–3 mL of tube medium to the syringes on one side, generating a gravity-driven force to push medium from one side (inlet) to the other (outlet) (Figure 3C). It is important to ensure that no air bubbles are seen in the inlet port, as this can impede the flow of fluid. Microfluidic devices are recommended to be maintained at 37 °C at 20% O2 tension.
Troubleshooting: If bubbles are seen in the ports, a 10 μL pipette tip can be used to dislodge them so they can be removed from the fluid surface via suction.
6. Over the following 1–2 days, the adaptive ECs will form a perfusable vascular bed between the two ports, and the medium in the inlet syringe will flow to the outlet syringe and eventually reach equilibrium on both sides. To keep the fluid flowing from the inlet to the outlet, transfer all the medium in the outlet syringe to the inlet twice a day. Alternatively, put the slides on a nutating shaker to generate reciprocating fluid flow within the vascular bed.
7. With proper flow, the vascular bed will last for up to one week, with the vasculature calipers gradually increasing. Figure 3D shows a representative image of islets in the vascular bed on the third day after setup.
With minor modifications, using adaptable ECs, the protocol described above can be adopted to any other type of microchamber with an inlet port, an outlet port, and a secured channel between.
C. Functional assays with in vitro vascularized islets
Here, we present two functional assays that are compatible with in vitro–vascularized islets: glucose-stimulated insulin secretion (GSIS) (the primary approach to evaluate islet function [22]) and Ca2+ influx in response to glucose elevation (compatible with the tube medium).
C1. Dynamic GSIS
With our protocol, islets vascularized by adaptable ECs are well suited for both static and dynamic GSIS with a modification of the medium that stimulates vasculature formation. The tube medium that is used for vasculature formation contains a high level of insulin, and any residual insulin in the matrix will have a significant influence on the secreted insulin levels. To address this issue, we developed a low insulin serum-free medium called serum-free islet (SFI) medium, based on a previously published serum-free islet medium [23]. Taken together, the system for dynamic GSIS is set up in the same way as in section B, except for using the SFI medium. The following steps describe how dynamic GSIS is carried out after 2–3 days of microchamber setup with SFI medium (Figure 4A).

Figure 4. Dynamic glucose-stimulated insulin secretion (GSIS) using islets vascularized by adaptable endothelial cells (ECs). (A) Steps for dynamic GSIS. (B) Representative results of dynamic GSIS showing biphasic insulin secretion from six individual samples (derived from data published in [21]).
1. Wash the tested channel by pipetting KRBH containing 2 mM glucose into the inlet syringe and placing the chamber in a 37 °C incubator for 2 h.
2. After 1 h of incubation at low glucose to bring insulin secretion to the basal level (starvation), take the slide out of the incubator and place it on top of a 37 °C heating pad. This ensures the islets are maintained at 37 °C since insulin secretion is impaired at low temperatures.
3. After placing the slide on the heating pad, remove the outlet syringe and all fluid in the outlet port. Maintain the inlet syringe attached and replace the fluid within the syringe with fresh 2 mM glucose KRBH. Collect the flowthrough in the outlet every 3 min for up to 15 min to determine the basal insulin secretion at a low glucose level.
4. At the end of the basal level insulin secretion, pipette out the solution in the outlet syringe and add 3 mL of 16.7 mM glucose KRBH into the same syringe. Collect the flowthrough fluid in the outlet every 3 min for up to 30 min to determine the stimulated insulin secretion at a high glucose level.
5. Insulin levels in all collected samples are determined by insulin chemiluminescence ELISA following the manufacturer’s protocol. Briefly, add 25 μL of flowthrough to a well along with 75 μL of conjugation buffer. Use insulin standards with the concentrations of 30,000, 10,000, 1,000, 100, 20, and 5 pg/mL to generate the standard curve. After loading, incubate the plate for 1 h at 700–900 rpm. After incubation, manually wash the plate 6 times with a multiple-channel pipette using 350 μL of washing buffer. Wait for 1 min between every two washing steps to allow thorough washing. After each washing, decant the washing buffer and invert the plate on a multi-layered paper towel to remove as much remaining fluid as possible. Next, pipette 100 μL of SA-HRP solution into each well and incubate the plate with shaking for 30 min at 700–900 rpm. Repeat the 6-times washing as above. Pipette 100 μL of chemiluminescent substance solution into each well. Place the plate in a dark area for 5 min. Read the plate by a plate reader by setting read mode as Luminescence, read type as Endpoint, wavelength as All, plate type as 96-well standard opaque, and PMT & Optics as integration time 100 ms. Analyze the data in MyAssays.com using the fitting method as Five Parameter Logistic Fit (1/y2 weighting).
Figure 4B shows representative results of dynamic GSIS with biphasic insulin secretion. As described earlier, to enable insulin examination in the flowthrough, we switch the tube medium to SFI medium. A drawback of this medium change is that the nearly 100% rate of forming perfusable vascular bed with tube medium can be reduced to about 50% with SFI medium. However, using tube medium at the beginning and switching to SFI medium later has proven very difficult to wash away all the medium-containing insulin without damaging the vasculature.
C2. Ca2+ influx
The Ca2+ influx assay is carried out as detailed below (Figure 5A).

Figure 5. Ca2+ influx examination of islets vascularized with adaptable endothelial cells (ECs) in the microchamber. (A) Illustration of Ca2+ influx examination steps. (B) Representative sequence of images showing increased Ca2+ influx during the high glucose period. Slice numbers indicate the seconds after high glucose is added. The Ca2+ concentration, reflected by fluorescence intensity, is presented in the form of pseudocolor. (C) The Ca2+ influx is analyzed at the single-cell level in islet cells and ECs (derived from data published in [21]).
1. Prepare the Ca2+ dye Fluo-4 DirectTM loading solution as described by the manufacturer’s manual and mix the Fluo-4 loading solution with 2 mM glucose KRBH at a ratio of 1:1. To load the Fluo-4 loading solution, pipette out the tube medium in both inlet and outlet syringes and add Fluo-4 loading solution to the inlet syringe. The volume of Fluo-4 loading solution varies based on the type of syringe: 1 mL solution for a 1 mL syringe and 3 mL solution for a 5 mL syringe. Incubate the slide with Fluo-4 for 30 min in a 37 °C incubator to allow the solution to flow through the vascularized islets.
2. Remove the Fluo-4-containing solution from both the inlet and outlet. Add 1 mL of KRBH containing 2 mM glucose to the inlet syringe and move the slide to an inverted fluorescence microscope with an environmental chamber that controls the specimen temperature to 37 °C. If using a confocal microscope, set the excitation wavelength to 494 nm and the emission wavelength for signal collection to 516 nm. If using a widefield fluorescence microscope, use the setting for green fluorescence, such as FITC. Using a 10× objective lens is generally a good choice for imaging, providing a big picture with multiple whole islets and a resolution at the single-cell level.
3. If it takes less than 30 min to set up the microscope, wait until the 30-min mark to start imaging. After adding Fluo-4 to the imaging setup, cells require at least 30 min to process the dye. To start imaging, pipette out Fluo-4 loading solution from the inlet and outlet syringes and add 1 mL of KRBH with 2 mM glucose to the inlet syringe. Place the slide on the microscope stage and secure a viewing field with at least one islet.
4. Start image acquisition by setting one shot per second for a total of 20 min. Images taken during the first 3–5 min (before adding high glucose KRBH) show islet fluorescence at the baseline under 2 mM glucose. Add 1 mL of KRBH with 40 mM glucose to the inlet syringe around acquisition image #240 (nearly 4 min). This results in approximately 20 mM glucose concentration in the chip. Record the number of acquisition images at the time of adding 40 mM glucose KRBH as the start of high glucose stimulation, and be careful not to touch the chip when adding high glucose KRBH. Slight adjustment of the focus and position may be needed. The image acquisition does not stop and continues for a total of 20 min or 1,200 acquisitions. Both inlet and outlet syringes remain on the chip during the whole imaging procedure, and there is no need to aspirate solution from the outlet syringe during the imaging. If there is limited space within the microscope imaging chamber, the syringe may be cut shorter.
5. Analyze the image with ImageJ or other imaging analysis tools to quantify the glucose-stimulated Ca2+ influx.
A representative sequence of images during the high glucose period (Figure 5B) shows increased Ca2+ concentration, reflected by fluorescence intensity, in both islet cells and ECs soon after glucose level elevation. Further analysis at the single-cell level (Figure 5C) shows that some islet cells, but no ECs, demonstrate rhythmic Ca2+ influx. Different islet cells have different start points of rhythmic fluctuation and various fluctuation frequencies. This suggests that Ca2+ influx provides sophisticated results that can be analyzed in multiple dimensions to evaluate islet function.
D. Long-term static islet culture
In our testing of islets with ECs in SFI medium, we found that SFI can sustain islet function for months, substantially longer than what has previously been reported. Here is the protocol for setting up a static 3D islet culture (Figure 6A).

Figure 6. Long-term culture of human islets with serum-free islet (SFI) medium. (A) Setup of the long-term islet culture. (B) Islets cultured in SFI medium for 8 weeks. (C) Levels of stimulated insulin at 16.7 mM glucose and the insulin fold changes from 2 mM glucose to 16.7 mM in a representative batch of long-term cultured islets from week 1 to 22. N = 5.
1. Suspend human islets, with or without ECs, in Matrigel® at a concentration of 50 islets per 50 μL. Pipette the suspension onto the bottom of a well in a 6-well plate, which will solidify into a dome within 15 min.
2. Incubate the plate at 37 °C for 30 min to allow for full gelation of Matrigel®. Add 2 mL of SFI to each well. Conduct medium changes weekly.
3. Determine islet function by static GSIS every 1–2 weeks as follows:
a. Starve islets in 2 mL of KRBH containing 2 mM glucose for 1 h at 37 °C.
b. At the end of the starvation period, discard all KRBH and replace it with another 2 mL of fresh KRBH with 2 mM glucose. After another 30 min of incubation at 37 °C, gently shake the well and collect 150 μL of supernatant for basal insulin examination.
c. Add 150 μL of KRBH with 198 mM glucose to reach a final glucose concentration of 16.7 mM. Incubate at 37 °C for another 30 min. Gently shake the well and collect 150 μL of supernatant for stimulated insulin examination.
d. Insulin levels in the collected supernatant are determined by insulin chemiluminescence ELISA.
A representative image of islets cultured in SFI medium for 10 weeks is shown in Figure 6B. In this approach, compared to islets cultured in regular medium with 10% serum, there are fewer fibroblasts growing out of islets.
Figure 6C shows the islet functional changes, reflected by stimulated insulin secretion at 16.7 mM glucose and insulin secretion change from 2 to 16.7 mM glucose, from week 1 to 22 in long-term cultured human islets. In this batch, the stimulated insulin level dropped after week 11 and then remained stable until week 20. The insulin secretion fold changes, however, slightly increased after week 10. This suggests that only the most robust islets survive long-term in the SFI medium. Based on the results of six batches of culture using islets from six donors, we found that islets maintain function in SFI medium from 8 to >24 weeks. No other tested media, such as classic islet medium with 10% FBS or tube medium, can preserve islet function for more than 4 weeks.
E. Diabetes induction in mice with streptozotocin
Using streptozotocin (STZ) is the most widely used approach to induce diabetes in rodents. There are two major strategies: one high dosage (usually a single dose of ~200 mg of STZ per kg body weight) or multiple low dosages (usually 50 mg of STZ per kg body weight for 5 consecutive days) [24]. In this protocol, we present a multiple high-dosage method, which has the following benefits: 1) ~70% of mice develop hyperglycemia and survive for more than a month after developing hyperglycemia, and 2) a nearly 0% rate of spontaneous recovery from diabetes. The method is conducted as shown in Figure 7A.
1. At week 0, administer STZ to all mice at a dosage of 180 mg per kg of body weight through I.P. injection. Weigh the required amount of STZ in a weighing boat and place the boat carrying the STZ on ice after weighing. Dissolve STZ on ice in PBS at 20 mg/mL. Pipette up and down to fully dissolve the compound. Administer STZ dissolved in PBS intraperitoneally to the mouse using an insulin syringe or a 1 mL syringe with a 30 or 26 G needle. Calculate the volume of STZ as 180 μL per 20 g of body weight, which results in 180 mg per kg body weight using 20 mg/mL STZ. Always keep STZ dissolved in PBS on ice to prevent fast degradation. All injections should be done within 30 min after dissolving STZ due to potential STZ degradation.
2. At week 1, measure non-fasting blood glucose between 10 am and 12 pm, which is the period during which the mouse is least active [25]. Determine the blood glucose level by applying a drop of blood to the glucose strip on a OneTouch Ultra2 glucose meter. Obtain the drop of blood by cutting the tip of the tail and gently squeezing the tail.
Note: Although the blood glucose levels seem to be the most stable during this period according to our experience, other time windows during the day should also work. Nonetheless, examining non-fasting blood glucose during the same time window each day will result in a stable outcome.
3. Administer STZ at week 2 following the same method as week 1, based on the mouse’s blood glucose. Mice with blood glucose < 200 mg/dL receive another full dose of 180 mg/kg, and mice with blood glucose between 200 and 350 mg/dL receive a half dose of 90 mg/kg. Mice with blood glucose levels >350 mg/dL are considered hyperglycemic and will not receive any further STZ.
Note: Our early tests showed that mice that do not develop diabetes after 3 rounds of STZ administration generally do not develop diabetes later with additional dosages. Hence, the protocol involves only 3 rounds of STZ administration at weeks 0, 1, and 2.
As shown in Figure 6B, of 162 mice treated with this protocol, 70% developed hyperglycemia at week 3, and no spontaneous recovery from hyperglycemia was found. We also found that 17% of mice died due to STZ administration by the end of week 3, but few mice died after week 3 due to hyperglycemia. Among mice that remained euglycemic at the end of week 3, further weekly STZ injection rarely induced hyperglycemia. Taken together, mice that develop hyperglycemia and survive at the end of week 3 are most likely to survive with diabetes for another 1 or 2 months, and mice that do not develop hyperglycemia at the end of week 3 are unlikely to become hyperglycemic even with continuous STZ administration.
As shown in Figure 7B, there is some variation between SCID-beige and NSG, or between female and male, but the variations are not significant (Chi2 2 × 2 test) at week 3.

Figure 7. Induction of hyperglycemia in mice with multiple high doses of streptozotocin (STZ). (A) Schematic illustrating the procedure of multiple high doses of STZ injection. (B) Percentage of mice that developed hyperglycemia at week 1, 2, and 3, stratified by strain and gender.
F. Subcutaneous transplantation of diabetic mice with adaptive ECs and islets
One of the most promising applications of adaptable ECs is to enable the functional engraftment of co-transplanted islets within the subcutaneous space. The following steps show how to use adaptable ECs for subcutaneous transplantation of islets or other cells.
1. Culture human islets at 37 °C with 5% O2 in 10 cm tissue culture dishes with SFI medium for 12–48 h upon being received from vendors.
2. Thaw the required number of vials of cryo-preserved adaptable ECs a day before the arrival of human islets and plate them in 10 cm tissue culture dishes with human EC medium. They are ready to be used for transplantation when confluence reaches around 90%, which takes 12–36 h.
3. Confirm the diabetic status of recipient mice on the day before transplantation. Only use mice that have shown >2 weeks of blood glucose >350 mg/dL as recipients to avoid spontaneous recovery from hyperglycemia.
4. On the day of transplantation, digest adaptable ECs from the culture dishes and count the cell number. Collect human islets from the culture dish without digestion. Quantify islet quantity as islet equivalency (IEQ) according to the vendor’s description. One IEQ is defined as the volume equaling a sphere islet with a diameter of 150 μm. Mix and centrifuge 3,000 IEQ of human islets and 1 million adaptable ECs together at 500× g for 5 min at 4 °C. Gently resuspend the resultant pellet in 107.6 μL of SFI medium and keep it on ice.
5. To generate the 3D matrix, add 9.2 μL of 10× DMEM and 80 μL of bovine type 1 collagen (6 mg/mL) to each sample of cell mixture, followed by thoroughly pipetting up and down to mix. These steps should be done on ice to maintain the collagen in a liquid form.
6. To trigger gelation, add 3.2 μL of 1 M NaOH to the mixture of cells and collagen type I. Quickly mix the final mixture and distribute it in a well of a 6-well plate as four roughly equal-sized droplets. Optionally, place a piece of sterilized parafilm in the well and release cell mixture droplets on the parafilm, which makes it easier to pick the droplets up later.
7. Place the plate at 37 °C for full gelation, which takes approximately 30 min. After that, add 2 mL of SFI medium to each well and further incubate the cell mixture within the collagen 3D matrix for 30–60 min before transplantation. Figure 8A shows a typical pre-transplantation cells/matrix mixture in four droplets on a piece of parafilm within a well of a 6-well plate filled with 2 mL of SFI. The enlarged image shows that some of the large islets are visible to the naked eye.

Figure 8. Subcutaneous transplantation of islets with or without adaptable endothelial cells (ECs) to reverse hyperglycemia in streptozotocin (STZ)-induced diabetic mice. (A) Well containing four droplets of cells/matrix mixture for transplantation. One of the droplets is enlarged, where some large islets are visible to the naked eye. (B) The setup of a mouse for subcutaneous transplantation is shown. The green lines indicate the locations for incision. (C) A subcutaneous graft with adaptable ECs and islets is shown 4 weeks after transplantation. (D) Euglycemia is achieved only in mice transplanted with islets and adaptable ECs. Data are presented as mean ± S.E.M. (E) Significant positive association is found between pre-transplantation body weight and blood glucose at post-transplantation week 10.
8. Anesthetize the recipient mouse by inhalation with 2% isoflurane with O2. During the procedure, attach the mouse’s head to a mouse holder with an isoflurane inhaler and secure the hind legs onto a 37 °C heating pad with the dorsal side up (Figure 8B). Next, cut an incision ranging from 3 to 5 mm through the skin on the left or right side of the body, parallel to the spine (indicated by green lines in Figure 8B). Use a pair of curved Crile forceps to create a subcutaneous tunnel toward the ventral side as a space for transplantation. Detach the matrix-cell droplets from the well by light touch. Scoop up the detached and suspended droplets by holding a pair of curved thumb forceps in a way similar to using a spoon. Pick up all four droplets this way and place them into the subcutaneous tunnel that was generated previously. Finally, close the skin with 3–4 sutures (4-0, black silk).
Within 4 weeks, the transplanted droplets engraft and establish vascular connections to the host’s circulatory system. In most cases, we found the grafts attaching to the panniculus carnosus muscle layer of the skin, rather than on the surface of the peritoneum, showing a light brown color due to blood perfusion within (Figure 8C).
As previously reported [21], we transplanted islets with adaptable ECs to 21 diabetic mice, and islets without adaptable ECs (co-transplanted with HUVECs or no ECs) to 10 diabetic mice. Hyperglycemia was reversed in 14 out of 21 recipients who received islets and adaptable ECs, and in none of the recipients who did not receive adaptable ECs (Figure 8D). We also tried to understand what might be the factors that hinder the achievement of euglycemia in some mice and found a significantly positive association between the pre-transplantation body weight and the post-transplantation blood glucose (Figure 8E). It remains to be further elucidated if a higher IEQ of transplanted islets would increase the successful rate of reversing hyperglycemia. Using the current formula, the final concentration of adaptable ECs is 5 million per mL.
The current adaptable EC concentration was chosen because a concentration higher than 5 million/mL causes dramatic contraction of the cell/collagen 3D mixture, forming condensed droplets that can impede the sprouting of adaptable ECs. For future studies, using alternative matrices allowing higher EC concentration may increase the efficiency of subcutaneous transplantation of islets with adaptable ECs.
Data analysis
Quantification of insulin levels measured by ELISA: Analyze the insulin ELISA data with MyAssays.com, using Five Parameter Logistic Fit (1/y2 weighting) for the curving fitting.
Quantification of fluorescence of Fluo-4 labeled islets: Quantify the fluorescence intensity by Fiji with the following steps:
1. Quantify Fluo-4 intensity in images acquired in the green (494 nm/516 nm) channel with a single optical plane per time point. This setting ensures high time resolution along with glucose stimulation.
2. Convert time-lapse images into a stack following the time order.
3. Manually draw the region of islets or cells of interest, which has a high fluorescence intensity due to glucose stimulation. Dragging the slider back and forth can reveal single cells to show oscillatory Ca2+ influx.
4. Stack alignment is not needed in all measurements in this study, since all islets and cells are fixed within the fibrin gel. But it may be needed if there is a change in the location of the islet or cell.
5. Once the area of interest is selected, measure the fluorescence intensity of the selected area throughout the whole stack in an automated manner using the open-source script below:
// Measure Stack//// This macro measure all the slices in a stack. macro "Measure Stack" { saveSettings; setOption("Stack position", true); for (n=1; n<=nSlices; n++) { setSlice(n); run("Measure"); } restoreSettings; }Validation of protocol
All procedures presented here were validated either in previous publications [19,21] or by results demonstrated in Figures 1–7.
Acknowledgments
The work presented here is supported by Breakthrough T1D with grants 2-SRA-2022-1105-S-B and 3-SRA-2023-1446-S-B. This protocol was used in the following publications: Li et al. (2025) [21] and Palikuqi et al. (2020) [19].
Conceptualization, G.L., R.C.S., S.R.; Investigation, G.L., A.U.; Writing—Original Draft, G.L.; Writing—Review & Editing, G.L., R.C.S., A.U., S.R..; Funding acquisition, G.L., S.R.; Supervision, S.R.
Competing interests
The authors declare no conflicts of interest.
References
- Roep, B. O., Thomaidou, S., van Tienhoven, R. and Zaldumbide, A. (2021). Type 1 diabetes mellitus as a disease of the β-cell (do not blame the immune system?). Nat Rev Endocrinol. 17(3): 150–161. https://doi.org/10.1038/s41574-020-00443-4
- Kahn, S. E., Hull, R. L. and Utzschneider, K. M. (2006). Mechanisms linking obesity to insulin resistance and type 2 diabetes. Nature. 444(7121): 840–846. https://doi.org/10.1038/nature05482
- Jessen, L. and D'Alessio, D. (2009). The Incretins and β-Cell Health: Contrasting Glucose-Dependent Insulinotropic Polypeptide and Glucagon-Like Peptide-1 as a Path to Understand Islet Function in Diabetes. Gastroenterology. 137(6): 1891–1894. https://doi.org/10.1053/j.gastro.2009.10.013
- Wang, P., Alvarez-Perez, J. C., Felsenfeld, D. P., Liu, H., Sivendran, S., Bender, A., Kumar, A., Sanchez, R., Scott, D. K., Garcia-Ocaña, A., et al. (2015). A high-throughput chemical screen reveals that harmine-mediated inhibition of DYRK1A increases human pancreatic beta cell replication. Nat Med. 21(4): 383–388. https://doi.org/10.1038/nm.3820
- Komatsu, H., Cook, C., Wang, C. H., Medrano, L., Lin, H., Kandeel, F., Tai, Y. C. and Mullen, Y. (2017). Oxygen environment and islet size are the primary limiting factors of isolated pancreatic islet survival. PLoS One. 12(8): e0183780. https://doi.org/10.1371/journal.pone.0183780
- Burganova, G., Bridges, C., Thorn, P. and Landsman, L. (2021). The Role of Vascular Cells in Pancreatic Beta-Cell Function. Front Endocrinol (Lausanne). 12: e667170. https://doi.org/10.3389/fendo.2021.667170
- Piemonti, L. and Pileggi, A. (2013). 25 Years of the Ricordi Automated Method for Islet Isolation. CellR4 Repair Replace Regen Reprogram. 1(1): e128. https://pubmed.ncbi.nlm.nih.gov/30505878/
- Shindo, Y., Kalivarathan, J., Saravanan, P. B., Levy, M. F. and Kanak, M. A. (2022). Assessment of Culture/Preservation Conditions of Human Islets for Transplantation. Cell Transplant. 31: e1177/09636897221086966. https://doi.org/10.1177/09636897221086966
- Chen, Q. D., Liu, L., Zhao, X. H., Liang, J. B. and Li, S. W. (2023). Challenges and opportunities in the islet transplantation microenvironment: a comprehensive summary of inflammatory cytokine, immune cells, and vascular endothelial cells. Front Immunol. 14: e1293762. https://doi.org/10.3389/fimmu.2023.1293762
- Regeenes, R. and Rocheleau, J. V. (2024). Twenty years of islet-on-a-chip: microfluidic tools for dissecting islet metabolism and function. Lab Chip. 24(5): 1327–1350. https://doi.org/10.1039/d3lc00696d
- Kim, M., Cho, S., Hwang, D. G., Shim, I. K., Kim, S. C., Jang, J. and Jang, J. (2025). Bioprinting of bespoke islet-specific niches to promote maturation of stem cell-derived islets. Nat Commun. 16(1): 1430. https://doi.org/10.1038/s41467-025-56665-5
- Hering, B. J., Rickels, M. R., Bellin, M. D., Millman, J. R., Tomei, A. A., García, A. J., Shirwan, H., Stabler, C. L., Ma, M., Yi, P., et al. (2025). Advances in Cell Replacement Therapies for Diabetes. Diabetes. 74(7): 1068–1077. https://doi.org/10.2337/db25-0037
- Shapiro, A. J., Lakey, J. R., Ryan, E. A., Korbutt, G. S., Toth, E., Warnock, G. L., Kneteman, N. M. and Rajotte, R. V. (2000). Islet Transplantation in Seven Patients with Type 1 Diabetes Mellitus Using a Glucocorticoid-Free Immunosuppressive Regimen. N Engl J Med. 343(4): 230–238. https://doi.org/10.1056/nejm200007273430401
- Song, W., Chiu, A., Wang, L. H., Schwartz, R. E., Li, B., Bouklas, N., Bowers, D. T., An, D., Cheong, S. H., Flanders, J. A., et al. (2019). Engineering transferrable microvascular meshes for subcutaneous islet transplantation. Nat Commun. 10(1): 4602. https://doi.org/10.1038/s41467-019-12373-5
- Lei, J., Coronel, M. M., Yolcu, E. S., Deng, H., Grimany-Nuno, O., Hunckler, M. D., Ulker, V., Yang, Z., Lee, K. M., Zhang, A., et al. (2022). FasL microgels induce immune acceptance of islet allografts in nonhuman primates. Sci Adv. 8(19): eabm9881. https://doi.org/10.1126/sciadv.abm9881
- Aghazadeh, Y., Poon, F., Sarangi, F., Wong, F. T., Khan, S. T., Sun, X., Hatkar, R., Cox, B. J., Nunes, S. S., Nostro, M. C., et al. (2021). Microvessels support engraftment and functionality of human islets and hESC-derived pancreatic progenitors in diabetes models. Cell Stem Cell. 28(11): 1936–1949.e8. https://doi.org/10.1016/j.stem.2021.08.001
- Yu, M., Agarwal, D., Korutla, L., May, C. L., Wang, W., Griffith, N. N., Hering, B. J., Kaestner, K. H., Velazquez, O. C., Markmann, J. F., et al. (2020). Islet transplantation in the subcutaneous space achieves long-term euglycaemia in preclinical models of type 1 diabetes. Nat Metab. 2(10): 1013–1020. https://doi.org/10.1038/s42255-020-0269-7
- Baudin, B., Bruneel, A., Bosselut, N. and Vaubourdolle, M. (2007). A protocol for isolation and culture of human umbilical vein endothelial cells. Nat Protoc. 2(3): 481–485. https://doi.org/10.1038/nprot.2007.54
- Palikuqi, B., Nguyen, D. H., Li, G., Schreiner, R., Pellegata, A. F., Liu, Y., Redmond, D., Geng, F., Lin, Y., Gómez-Salinero, J. M., et al. (2020). Adaptable haemodynamic endothelial cells for organogenesis and tumorigenesis. Nature. 585(7825): 426–432. https://doi.org/10.1038/s41586-020-2712-z
- Gong, W., Das, S., Sierra-Pagan, J. E., Skie, E., Dsouza, N., Larson, T. A., Garry, M. G., Luzete-Monteiro, E., Zaret, K. S., Garry, D. J., et al. (2022). ETV2 functions as a pioneer factor to regulate and reprogram the endothelial lineage. Nat Cell Biol. 24(5): 672–684. https://doi.org/10.1038/s41556-022-00901-3
- Li, G., Craig-Schapiro, R., Redmond, D., Chen, K., Lin, Y., Geng, F., Gao, M., Rabbany, S. Y., Suresh, G., Pearson, B., et al. (2025). Vascularization of human islets by adaptable endothelium for durable and functional subcutaneous engraftment. Sci Adv. 11(5): eadq5302. https://doi.org/10.1126/sciadv.adq5302
- Alcazar, O. and Buchwald, P. (2019). Concentration-Dependency and Time Profile of Insulin Secretion: Dynamic Perifusion Studies With Human and Murine Islets. Front Endocrinol (Lausanne). 10: e00680. https://doi.org/10.3389/fendo.2019.00680
- Clark, S. A. and Chick, W. L. (1990). Islet Cell Culture in Defined Serum-Free Medium*. Endocrinology. 126(4): 1895–1903. https://doi.org/10.1210/endo-126-4-1895
- Ghasemi, A. and Jeddi, S. (2023). Streptozotocin as a tool for induction of rat models of diabetes: a practical guide. EXCLI J. 22: 274–294. https://pubmed.ncbi.nlm.nih.gov/36998708/
- Li, G., Kohorst, J. J., Zhang, W., Laritsky, E., Kunde-Ramamoorthy, G., Baker, M. S., Fiorotto, M. L. and Waterland, R. A. (2013). Early Postnatal Nutrition Determines Adult Physical Activity and Energy Expenditure in Female Mice. Diabetes. 62(8): 2773–2783. https://doi.org/10.2337/db12-1306
Article Information
Publication history
Received: Sep 12, 2025
Accepted: Nov 13, 2025
Available online: Dec 2, 2025
Published: Dec 20, 2025
Copyright
© 2025 The Author(s); This is an open access article under the CC BY-NC license (https://creativecommons.org/licenses/by-nc/4.0/).
How to cite
Readers should cite both the Bio-protocol article and the original research article where this protocol was used:
- Li, G., Craig-Schapiro, R., Uddin, A. and Rafii, S. (2025). Vascularization of Human Pancreatic Islets With Adaptive Endothelial Cells for In Vitro Analysis and In Vivo Transplantation. Bio-protocol 15(24): e5550. DOI: 10.21769/BioProtoc.5550.
- Li, G., Craig-Schapiro, R., Redmond, D., Chen, K., Lin, Y., Geng, F., Gao, M., Rabbany, S. Y., Suresh, G., Pearson, B., et al. (2025). Vascularization of human islets by adaptable endothelium for durable and functional subcutaneous engraftment. Sci Adv. 11(5): eadq5302. https://doi.org/10.1126/sciadv.adq5302
Category
Cell Biology > Cell engineering > Tissue engineering
Cell Biology > Cell Transplantation > Xenograft
Medicine
Do you have any questions about this protocol?
Post your question to gather feedback from the community. We will also invite the authors of this article to respond.