- Protocols

- Articles and Issues
- For Authors
- About
- Become a Reviewer

In Situ Crosslinking of Bioorthogonal Nanoparticles to Restore Clot Stability in Coagulopathic Blood
(§Technical contact: celestine.hong@ubc.ca) Published: Vol 15, Iss 24, Dec 20, 2025 DOI: 10.21769/BioProtoc.5548 Views: 809
Reviewed by: Joyce ChiuShubham GargAnonymous reviewer(s)
Original research article
The authors used this protocol in:
Apr 2023
Advertisement


Protocol Collections
Comprehensive collections of detailed, peer-reviewed protocols focusing on specific topics


Abstract
Intravenous hemostats have shown significant promise in prolonging survival for severe noncompressible and internal injuries in preclinical animal models. Existing approaches include the use of liposomes with or without procoagulant enzymes, as well as polymer nanoparticles or soluble biopolymers. While these methods predominantly target or mimic tissue components that are present during coagulation, such as activated platelets and collagen, they may not account for the loss of fibrinogen, which is not only key to clot formation but also the first protein to fall below critical levels in dilutional coagulopathy. This protocol describes the synthesis and in vitro or ex vivo characterization of a crosslinkable nanoparticle system that seeks to address dilutional coagulopathy by leveraging the critical gelation concentration and bioorthogonal click chemistry. The system was shown to only gel at high nanoparticle and crosslinker concentrations, increase the rate of platelet recruitment, and decrease the rate of clot degradation in a low-fibrinogen environment, providing a platform for treating severe hemorrhage in a coagulopathic environment. Ultimately, the contents of this protocol may assist researchers in the in vitro characterization and screening of other crosslinkable nanoparticle systems or hemostats, with potential expansions to other categories of coagulation dysfunction, such as embolism treatment.
Key features
• A protocol for the synthesis of nanoparticles with activated-platelet-binding moieties to mimic fibrin.
• In vitro and ex vivo assays assessing complement activation, accumulated platelet recruitment, platelet recruitment under hemodilution, coagulation potential, and clot lysis.
• The inclusion of hemodiluted and plasminolytic conditions creates a more physiologically relevant environment for screening of hemostatic agents.
• The use of a two-component system helps reduce complement activation in intravenous therapies.
Keywords: HemostasisGraphical overview
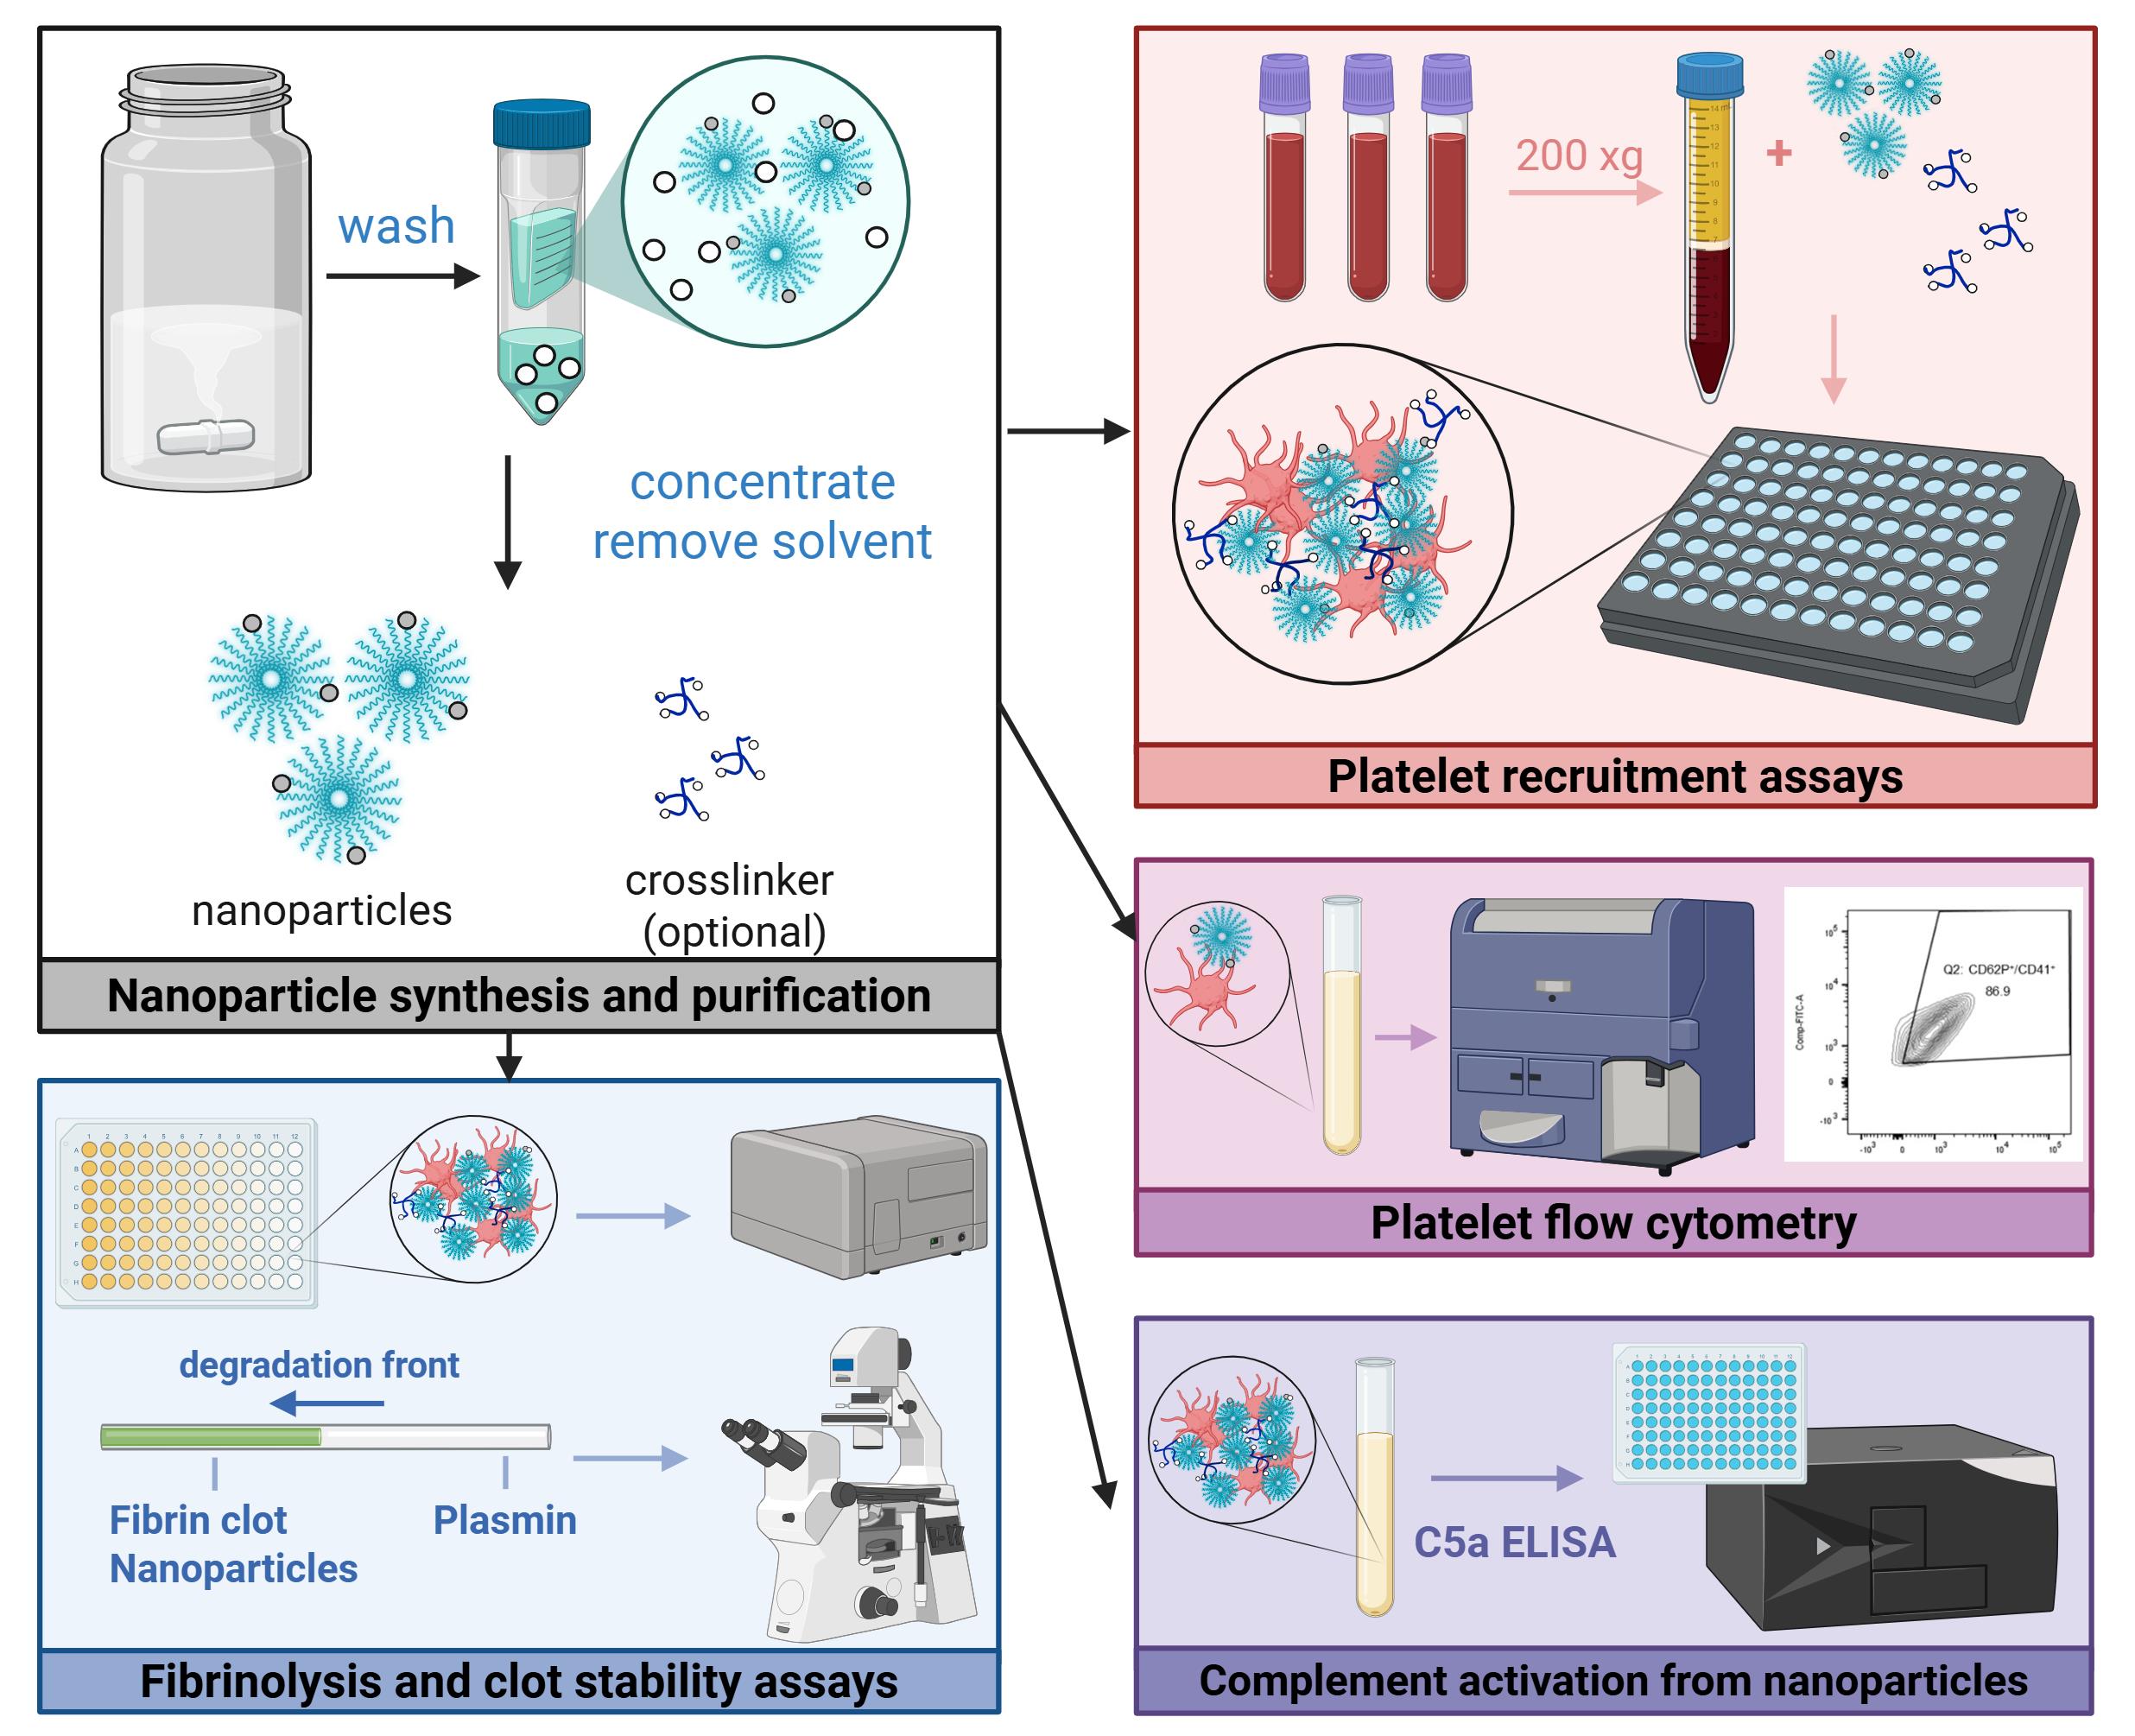
Graphical abstract of experimental protocols
Background
Achieving hemostasis for unknown or inaccessible locations presents a challenge for both embolic and hemorrhagic circumstances, often necessitating surgery or the systemic delivery of therapeutics to stabilize the patient [1–3]. In particular, hemostasis for severe hemorrhage poses additional hurdles to treatment, such as dilutional coagulopathy and potential off-target effects of procoagulant therapeutics. Researchers in the field have sought to address the latter issue by functionalizing liposomes [4,5], nanoparticles, or soluble polymers with targeting moieties that interact with activated components of the coagulation system. However, these solutions do not directly address fibrinogen loss, which is critical to achieving hemostasis, is associated with significantly lower survival rates, and can be further exacerbated by fluid resuscitation measures [6,7]. Moreover, the assays used to screen these materials have been largely limited to flow-based assays, platelet aggregation assays, or rotational thromboelastometry (ROTEM), which may not allow for high-throughput screening of various therapeutics or assess important metrics such as fibrinolytic activity or complement activation.
To this end, we developed a two-component system of dibenzocyclooctyne-functionalized multiarm polymers and nanoparticles with azide and activated-platelet-binding moieties, which leverages the increased accumulation of nanoparticles at the injury [8] to achieve crosslinking above a critical concentration, thereby mimicking the presence of fibrin at the wound site. This platform was demonstrated to result in significantly greater platelet recruitment in both normal and hemodiluted systems, increased resistance to fibrinolysis, and prolonged survival in a mouse liver resection model when compared to targeted nanoparticle-only controls.
The following sections describe in detail the in vitro and ex vivo assays used to characterize hemostats in three key areas: platelet recruitment (hemodiluted and non-hemodiluted conditions), complement activation, and clot strength. While previously described in literature, the nanoparticle synthesis and purification procedure is also included to ensure reproducibility. Ultimately, this protocol may be useful for the characterization of other crosslinkable nanoparticle systems, as well as the assessment of platelet or clot interactions in other modes of coagulation dysfunction.
Materials and reagents
Biological materials
1. Fresh whole blood, room temperature, NaCitrate anticoagulant (Research Blood Components)
2. Platelet-rich plasma (PRP), isolated from the above by centrifuging at 200× g for 20 min with no brake; use within 24 h
Reagents
The reagents below have been organized by experiment. As such, you may see duplicate entries of commonly used items, such as buffers, salts, and platelet agonists. You should have all the items under general/buffers readily available before the experiment.
General/buffers
1. Deionized water
2. Sodium chloride (VWR, catalog number: BDH9286-500G)
3. Calcium chloride (Millipore Sigma, catalog number: 1023780500)
4. HEPES buffer (Millipore Sigma, catalog number: H3375)
5. α-D-Glucose (Millipore Sigma, catalog number: 158968-25G)
Nanoparticle synthesis and purification
1. GRGDS, azide, DBCO, Cy7, or methoxy-functionalized poly(ethylene glycol)-b-poly(D,L-lactide-co-glycolide) (PEG-PLGA), 25–35 kDa, lactide:glycolide ratio 60:40–55:45 (Custom, synthesized as previously described [8,9], frozen at -20 °C)
2. Resomer 503H PLGA (Millipore Sigma, catalog number: 719870-5G, stored at 4 °C)
3. N, N-Dimethylformamide (DMF), anhydrous, 99.8% (Millipore Sigma, catalog number: 227056-100ML)
4. Tetrahydrofuran, 250 ppm BHT inhibitor (THF) anhydrous, ≥99.9% (Millipore Sigma, catalog number: 186562-100ML)
5. 4-arm-PEG-azide, MW 20k (CreativePEGworks, catalog number: PSB-4905-1g, frozen at -20 °C)
6. 4-arm-PEG, MW 20k (Millipore Sigma, JKP2005R-1G, frozen at -20 °C)
7. Deionized water
Platelet recruitment assays (hemodiluted and normal conditions)
1. Pierce RIPA buffer (Thermo Fisher, catalog number: 89901, stored at 4 °C)
2. Invitrogen CyQuant LDH assay (Thermo Fisher, catalog number: C20301, stored at 4 °C)
3. Adenosine 5’-diphosphate sodium salt (Millipore Sigma, catalog number: A2754-1G, frozen at -20 °C)
4. Sodium chloride (VWR, catalog number: BDH9286-500G)
5. Deionized water
Fibrin crosslinking in hemodiluted conditions
1. Calcium chloride (Millipore Sigma, catalog number: 1023780500)
2. Sodium chloride (VWR, catalog number: BDH9286-500G)
3. Deionized water
Platelet flow cytometry
1. Bovine serum albumin (BSA) (Millipore Sigma, catalog number: A3608)
2. Thrombin from human plasma (Millipore Sigma, catalog number: T6884-250UN)
3. H-Gly-Pro-Arg-Pro-NH2 (GPRP) acetate salt (Bachem, catalog number: 4025347.0025)
4. Calcium chloride (Millipore Sigma, catalog number: 1023780500)
5. Sodium chloride (VWR, catalog number: BDH9286-500G)
6. AF488 anti-human CD41 antibody (BioLegend, catalog number: 303724)
7. Brilliant Violet 421TM anti-human CD62P (P-Selectin) antibody (BioLegend, catalog number: 304925)
8. Pierce 16% formaldehyde (w/v), methanol-free (Thermo Fisher, catalog number: 28906)
Evaluating complement activation from nanoparticles
1. Invitrogen Complement C5a Human ELISA kit (Thermo Fisher, catalog number: BMS2088)
2. Zymosan A from Saccharomyces cerevisiae (Millipore Sigma, catalog number: Z4250-250MG)
3. Sodium chloride (VWR, catalog number: BDH9286-500G)
4. Deionized water
Fibrin clot lysis capillary assay
1. Fibrinogen, plasminogen-depleted, human plasma (Millipore Sigma, catalog number: 341578)
2. AF488 NHS ester (Lumiprobe, catalog number: 21820)
3. Plasmin (Millipore Sigma, catalog number: P1867-500UG)
4. Thrombin from human plasma (Millipore Sigma, catalog number: T6884-250UN)
5. Sodium chloride (VWR, catalog number: BDH9286-500G)
6. Deionized water
Solutions
1. Isotonic saline (see Recipes)
2. Isotonic glucose (see Recipes)
3. Adenosine diphosphate (ADP) stock solution (see Recipes)
4. Plasmin stock (see Recipes)
5. Calcium chloride (see Recipes)
6. Thrombin stock (see Recipes)
7. GPRP (see Recipes)
8. FACS buffer (see Recipes)
9. Diluted activated PRP (see Recipes)
Recipes
Note: All aliquoted solutions should be thawed, used, and discarded. No solutions should undergo repeated freeze-thaw cycles.
1. Isotonic saline
Prepare isotonic saline by diluting sodium chloride in deionized water to 0.9% w/v.
2. Isotonic glucose
Prepare isotonic glucose by diluting glucose in deionized water to 5% w/v. You may also prepare a 10× solution by preparing a solution of 50% w/v glucose (which may need to be dissolved in a warm water bath at 40 °C and filter-sterilized).
3. Adenosine diphosphate (ADP) stock solution
Prepare the ADP solution at a concentration of 0.1 mM in isotonic saline. Divide the solution into 100 μL aliquots and store at -20 °C.
4. Plasmin stock
Prepare the plasmin solution at a concentration of 10 μg/mL in isotonic saline. Divide the solution into 1 mL aliquots and store at -20 °C.
5. Calcium chloride stock
Prepare the calcium chloride solution at a concentration of 100 mM in isotonic saline.
6. Thrombin stock
Prepare the thrombin stock at a concentration of 100 U/mL in isotonic saline. Divide the solution into 100 μL aliquots and store at -20 °C.
7. GPRP stock
Prepare the GPRP solution at a concentration of 15 mM in isotonic saline. Divide the solution into 150 μL aliquots and store at -20 °C.
8. FACS buffer
| Reagent | Final concentration | Quantity or volume |
|---|---|---|
| Sodium chloride | 0.9% (w/v) | 450 mg |
| BSA | 5% (w/v) | 5 g |
| Deionized water | Begin with 90 mL and fill | |
| Total | n/a | 100 mL |
9. Diluted activated PRP
| Reagent | Final concentration | Quantity or volume |
|---|---|---|
| Calcium chloride (100 mM) | 3 mM | 15 μL |
| Thrombin (100 U/mL) | 20 U/mL | 100 μL |
| GPRP (15 mM) | 4.5 mM | 150 μL |
| PRP | n/a | 150 μL |
| FACS buffer | n/a | 85 μL |
| Total | n/a | 500 μL |
Laboratory supplies
1. 20 mL scintillation vials (VWR, catalog number: 66022-106)
2. 7 mL scintillation vials (VWR, catalog number: 66022-300)
3. Amicon Ultra centrifugal filters, 3kDa MWCO (Millipore Sigma, catalog number: UFC900308, 15 mL)
4. Eppendorf tubes (Millipore Sigma, catalog number: EP022364111-1EA)
5. FalconTM 50 mL high clarity conical centrifuge tubes (Fisher Scientific, catalog number: 14-959-49A)
6. Greiner CELLSTAR black cell culture microplate, F-bottom, 96 well (Fisher Scientific, catalog number: 07000135)
7. Corning black microplate, clear-bottom, 384 well (Millipore Sigma, catalog number: CLS3764-20EA)
8. Costar non-treated clear polystyrene plates, 96 well (Corning, catalog number: 3370)
9. FalconTM round-bottom polystyrene test tubes with cell strainer snap cap, 5 mL (Fisher Scientific, catalog number: 08-771-23)
10. Square glass tubing (VitroTubesTM) (VitroCom, catalog number: 8100)
11. VWR® shell vial (Avantor, catalog number: 66015-702A)
12. HydroLogixTM ART pipette tips, gel loading (Thermo Scientific, Avantor, catalog number: 53225-648)
13. Dow CorningTM high vacuum grease (Fisher Scientific, catalog number: AA44224KT)
Equipment
1. Plate reader (Tecan, model: Infinite M200)
2. Plate reader (Tecan, model: M Nano)
3. Fluorescent microscope (Olympus, model: IX83; camera model: DP30BW)
4. Bath sonicator (Branson, model: 2510EDTH)
5. Flow cytometer (BD Biosciences, model: LSR II)
Software and datasets
1. Prism (GraphPad, Version 5, lifetime license)
2. FlowJo (Version 10)
3. BioRender (https://www.biorender.com/)
Procedure
A. Nanoparticle synthesis and purification
Day 1
1. This sub-protocol is used to synthesize 40–45 mg of polymer nanoparticles. Larger or smaller batches should be scaled accordingly, keeping the dissolution concentration in Day 1, step 3, and the volumes in Day 2, steps 6–8, constant.
2. Weigh out 40 mg of PEG-b-PLGA polymer (ratio of peptide and azide functionalities may vary at this step) and 5 mg of Resomer 503H pure PLGA into a 7 mL glass scintillation vial.
3. Add 3 mL of a 50:50 (v/v) mixture of DMF and THF (15 mg polymer/mL solvent).
4. Add a stir bar and stir overnight while covered.
Day 2
5. Sonicate the solution (capped) until clear (generally ~15 min; may be longer or shorter due to polymer batch-to-batch variability).
Critical: Do not proceed to the next step if the solution is still cloudy and/or there is undissolved polymer.
6. Fill a 20 mL glass scintillation vial with 5 mL of deionized water and place it on a stir plate while stirring at 720 rpm.
Caution: This should be done in a chemical fume hood.
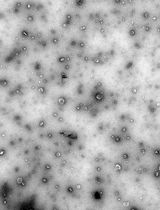
7. Using a 200 μL pipette and tip, add 1 mL of polymer solution dropwise to the stirring water. You should see the liquid turn somewhat milky/white, but not fully opaque. No visible aggregation should be observed (Figure 1A).
8. Repeat steps 6–7 until all the polymer solution is gone. You will have three to four 20 mL scintillation vials of nanoparticle solution.
9. Leave stirring, uncovered, for at least 3 h in the fume hood.
10. Prepare 3–4 Amicon Ultra centrifugal filters by adding 5 mL of deionized water and spinning them down at 3,000× g for 10 min to rinse the filters.
11. Fill the same tubes with 10 mL of deionized water each, before adding 5 mL of the nanoparticles on top.
Caution: This should be done in a chemical fume hood.
12. Spin the tubes down at 3,000× g for 30 min. You should expect 1–2 mL of liquid to remain in the filter.
13. Resuspend the nanoparticles by using a 200 μL pipette to pipette up and down. Discard the flowthrough into chemical waste and refill each tube to 15 mL with deionized water.
14. Repeat steps A12–13 to wash the nanoparticles at least three times, up to 5 times.
15. After your final wash, do not refill the tube. Resuspend the nanoparticles to your desired stock concentration, accounting for a 10% loss. If the stock is highly concentrated, you may combine the contents of the tubes and concentrate further; however, there is an increasing risk of aggregation.
16. Aggregation and particle quality can be determined through dynamic light scattering (DLS). For the particle synthesis protocol described here, the z-average diameter of the particles, measured at 0.25 mg/mL in deionized water, should be between 100 and 150 nm, with a PDI of <0.250. Therefore, the measurement is run at a range of 0–10,000 nm, and any sample with multimodal peak measurements or >5% of peaks above the 1,000 nm cutoff should be either discarded or filtered through a 0.45 μm filter.
17. Critical: Do not combine with the four-arm polymer crosslinker until it is used in an experiment. The crosslinker should be in stoichiometric equivalence with the nanoparticle, with the desired final concentration in solution calculated by:
Nanoparticle-type DBCO crosslinkers should likewise be formulated to have the same stoichiometric equivalence as azide moieties. This depends on the concentration originally formulated in step A2.
18. If you are using a crosslinkable nanoparticle system, it is recommended to confirm the crosslinking capabilities of your system through the inversion test (Figure 1B).
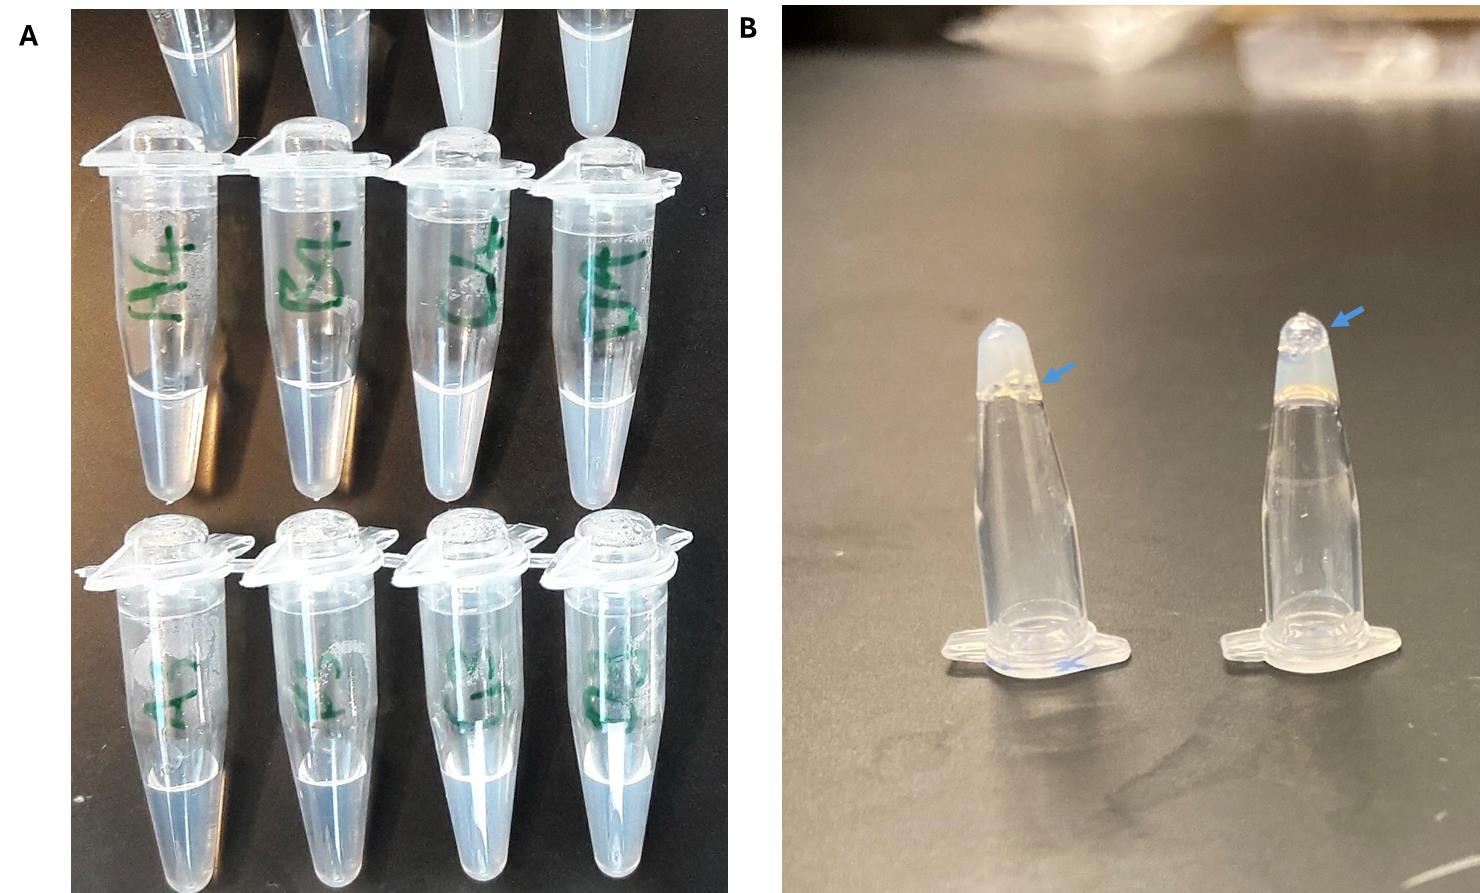
Figure 1. Representative images of nanoparticles and crosslinked nanoparticles. (A) Nanoparticle solutions at various concentrations and sizes (<200 nm). Note that for in vivo applications, larger nanoparticles are associated with greater complement activations; solutions that are completely opaque (like milk) may have large aggregates. Analyze a sample via dynamic light scattering to confirm. (B) The inversion test evaluates if the material has formed a gel. Another sign is the bubbles (blue arrows): gelled solutions tend to have bubbles trapped at the surface, whereas for liquids, the bubbles will eventually travel to the bottom of the inverted tube.
B. Platelet recruitment assays
B1. Blood components preparation
1. Gently pour or use a serological pipette to transfer whole blood into 50 mL conical tubes.
Caution: All steps involving blood components should be done in a biological safety cabinet rated for bloodborne pathogens.
2. Centrifuge at 200× g with no brake at room temperature (RT) for 20 min.
Critical: Braking will cause the platelet-rich plasma (PRP) to mix with the hematocrit.
3. Carefully transfer the tubes back to the biosafety cabinet (following normal disinfection procedures).
4. There should be three layers in the tube: the PRP (cloudy, yellowish upper layer), buffy coat (thin white layer), and hematocrit (red). Using a 1 mL pipette, transfer the PRP to a fresh tube, taking care not to disturb the buffy coat. Pipetting should be done gently and slowly, as platelets can undergo shear-induced activation.
5. Discard the buffy coat and hematocrit unless it will be used for other assays.
B2. Determination of optimal peptide to azide ratio
1. This protocol should be used when optimizing the ratio of the targeting component to the crosslinking component on a nanoparticle. The targeting component enables binding of the nanoparticle to the injury site and is especially important for systemic delivery to minimize off-target effects. The crosslinking component is necessary to recruit additional nanoparticles to the wound site and may affect gelation kinetics (more rapid gelation with larger crosslinker ratios).
2. Following the procedure listed in section A, synthesize a range of nanoparticles with different peptide:azide ratios by weighing out different ratios of GRGDS-PEG-PLGA and N3-PEG-PLGA polymer. Include a non-functionalized nanoparticle control. Formulate them at a stock concentration of 11 mg/mL.
3. From each type of nanoparticles, add 6 μL of nanoparticle solution to Greiner CELLSTAR black cell culture microplates (96-well) in 12 wells (1 row). Leave one row free for nanoparticle-free positive and negative controls and add 6 μL of saline instead.
4. Add 54 μL of PRP to all wells.
5. Divide the rows into left and right sides down the center (6 columns each). To one side, add 6 μL of ADP stock solution as a platelet activation agonist. Add the same volume of saline to the other (non-activated control). Note that you may need to thaw multiple aliquots of ADP stock solution, depending on the number of wells.
6. Add 6 μL of four-arm-PEG DBCO and DBCO-PEG-PLGA nanoparticles at stoichiometric equivalence (step A17). A sample plate layout has been provided in Figure 2.
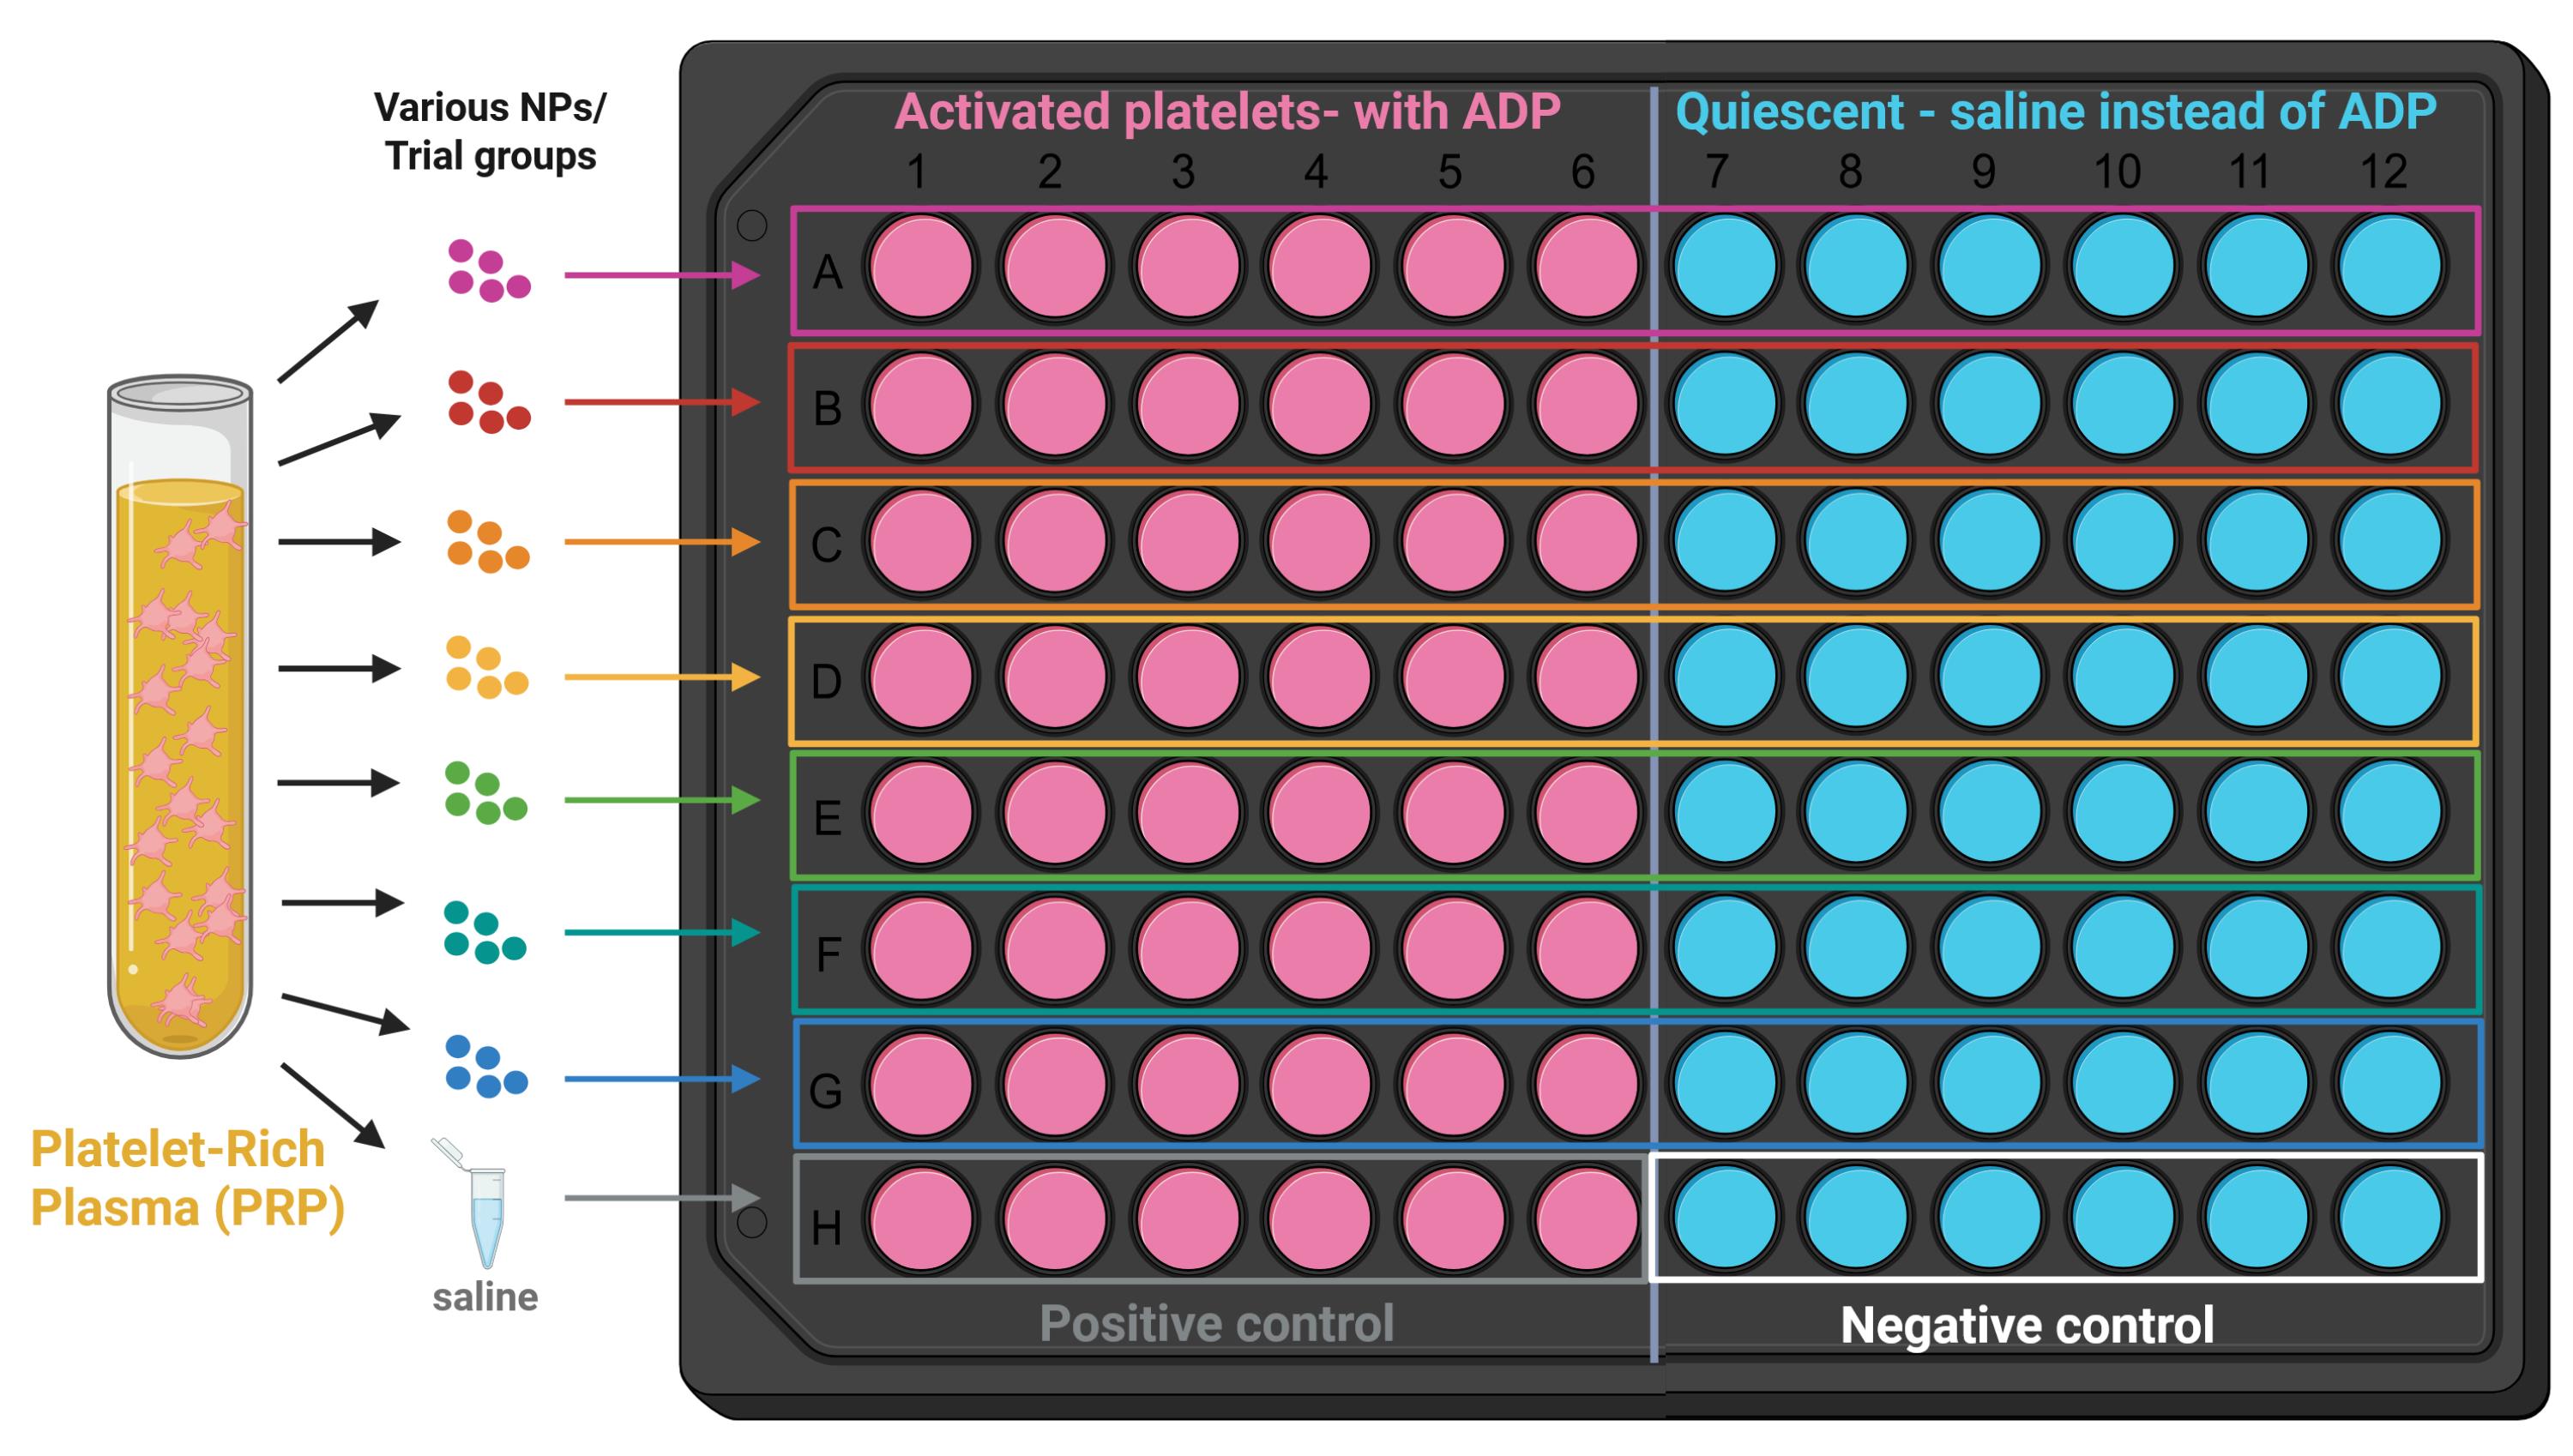
Figure 2. Sample layout for platelet recruitment assays. All 96 wells of the plate receive platelet-rich plasma (PRP), and each row receives a different type of nanoparticle. The left side of the plate receives ADP, a platelet agonist (activated platelets), while the right side receives saline (quiescent platelets). Specific binding is determined by subtracting nonspecific binding to quiescent platelets. This layout can be adapted for the following platelet recruitment assays, for example, by testing different nanoparticle concentrations in each row [10].
7. Incubate for 1 h under gentle agitation (200 μL) at 37 °C.
8. After incubation, gently pipette PRP from the wells, discard, and add 100 μL of saline into the wells. Remove the saline.
9. Repeat step B2.8 (saline addition and removal) another two times, for a total of three washes.
10. Repeat steps B2.3–9 to complete another incubation with PRP. The final desired number of incubations is dependent on the nonspecific binding of the material; the original procedure tested both four and six incubations in total.
11. After the final incubation (post-saline washes), add 60 μL of RIPA buffer to each well and allow adhered platelets to lyse for 15 min.
12. Retrieve a Corning clear-bottomed 384-well black microplate and the CyQuant LDH assay. This has been used as a proxy for quantification of platelet adhesion [11].
Critical: The instructions and volumes for the CyQuant LDH assay are for 96-well plates. Due to the large number of samples, this was divided by four and scaled down to a 384-well plate.
13. Transfer 4.2 μL of lysed sample from each well of the 96-plate into its location on the 384-well plate. Repeat for all wells.
14. Add 8.3 μL of RIPA buffer to all wells (threefold dilution of lysed samples, total of 12.5 μL). Use the undiluted positive control (no nanoparticle solution, ADP-added) to construct a calibration curve with twofold serial dilutions. Alternatively, you may use a threefold dilution of the PRP in step B2.4 into RIPA lysis buffer to construct the calibration curve (see Troubleshooting). Prepare at least 30 μL per concentration of the calibration curve, enough for two replicates (12.5 μL per well).
15. Prepare the reaction mixture as indicated in the CyQuant LDH manual. Add 12.5 μL to each well (sample and calibration concentrations, including blank/lysis buffer-only controls).
16. Incubate for 30 min at RT in the dark (covered with foil).
17. Add 12.5 μL of stop solution to each well.
18. Measure the absorbance at 490 nm, using 680 nm as a reference. The subtracted value should correspond to the amount of platelets lysed/recruited.
19. Analyze the data using the calibration curve, plotting concentrations against raw absorbance readings (or normalized to PRP concentration). Specific binding is given by subtracting the readings from quiescent platelets (nonspecific binding) from those of activated platelets. A sample calibration is shown in Figure 3.
Note: A fresh calibration curve MUST be prepared for each plate or experiment.
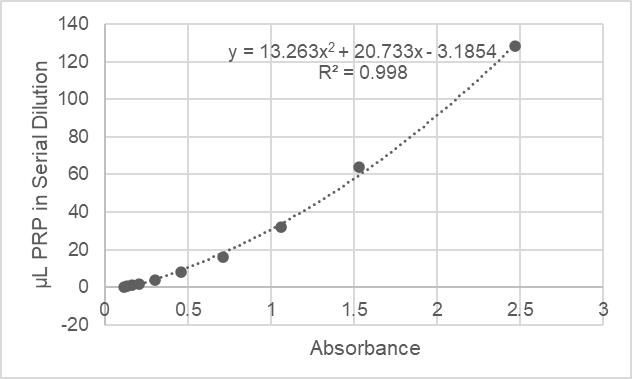
Figure 3. Sample calibration curve for platelet recruitment. The absorbance readings are plotted against platelet-rich plasma (PRP) dilutions; this may fit to a second-order polynomial or a linear fit, depending on the range of absorbances acquired. The absorbances for each well are then back-calculated to equivalent amounts of PRP, which are then normalized to the maximum concentration of the standard curve with a value of 100. The normalized amount of quiescent platelets binding to the wells for each trial group are averaged to give the nonspecific binding (the nanoparticles should only target activated platelets). This average value is then subtracted from the amount of activated platelets recruited to represent platelet recruitment due to specific interactions with nanoparticles.
B3. Platelet recruitment at lower nanoparticle doses
1. This protocol should be used when conducting a dose-response-type study to assess the effect of nanoparticle dosing on platelet recruitment. Concurrent testing for complement activation (section E) is recommended prior to in vivo studies, as higher doses of nanoparticles may lead to increased complement activation.
2. A variation of the above experiment was conducted using different nanoparticle doses. Following the procedure listed in section A, synthesize nanoparticles at the desired peptide functionality (the validated protocol used a 3:1 peptide-to-azide ratio).
3. Formulate the nanoparticle stocks at 11 mg/mL, 5.5 mg/mL, and 2.75 mg/mL. According to the previous section, this would correspond to final concentrations of 1 mg/mL, 0.5 mg/mL, and 0.25 mg/mL in PRP.
4. Repeat steps B2.3–19 to conduct the assay and analyze the data.
B4. Platelet recruitment in hemodiluted concentrations
1. This protocol should be used to assess platelet recruitment when the desired in vivo application may lead to dilutional coagulopathy (hemorrhage followed by fluid resuscitation).
2. A variation of the above two experiments was conducted using various dilutions of plasma. First, dilute plasma to 60% by combining 30 mL of PRP with 20 mL of isotonic saline (-40%). Dilute plasma to 80% of its original concentration by combining 40 mL of PRP with 10 mL of isotonic saline (-20%).
3. Following the procedure listed in section A, synthesize nanoparticles at the desired peptide functionality (the validated protocol used a 3:1 peptide-to-azide ratio) at a stock of 5.5 mg/mL
4. For each PRP dilution, including undiluted, add 6 μL of nanoparticle solution to Greiner CELLSTAR black cell culture microplates (96 well) in all 12 wells (1 row). Leave the same number of rows free for nanoparticle-free positive and negative controls and add 6 μL saline instead, e.g., two PRP dilutions + undiluted = six rows, one for each dilution, one for undiluted, and twice that for nanoparticle-free controls.
5. For each row, add the desired PRP dilution (e.g., Row A: -40%, Row B: -20%, Row C: Undiluted, etc.) and 54 μL of PRP.
6. Follow steps B2.5–9. This concludes one incubation.
7. Repeat steps B4.4–6 until the desired number of incubations has been reached (2 and 4 reported in the validated protocol).
8. Continue with steps B2.11–19 to complete the assay and data analysis.
C. Fibrin crosslinking in hemodiluted conditions
1. This protocol should be used to assess fibrin crosslinking when the desired in vivo application may lead to dilutional coagulopathy (hemorrhage followed by fluid resuscitation).
2. Following the procedure listed in section A, synthesize nanoparticles at the desired peptide functionality (the validated protocol used a 3:1 peptide-to-azide ratio) at a stock of 88 mg/mL.
3. Following the procedure listed in section B, prepare PRP.
4. In a biosafety cabinet, dilute PRP to 60% of its original concentration to simulate Grade-IV hemorrhage, e.g., add 4 mL of isotonic saline to 6 mL of PRP.
5. Set up the plate reader (number of wells, temperature, etc.) so that it is ready to accept the plate and start.
6. Add 3.75 μL of nanoparticle solution, 3.75 μL of crosslinker at stochiometric equivalence, and 52.5 μL of diluted PRP into one well of Costar non-treated clear polystyrene plates (96 well) to obtain a final concentration of 5 mg nanoparticle/ mL PRP (this concentration is after calcium is added in step C10).
Critical: Fibrin crosslinking is initiated upon calcium addition, so it is best to fill all the wells first and then add the calcium.
7. Repeat for 12 wells (1 row).
8. Repeat steps C6–7 with 7.5 μL of deionized water replacing nanoparticle and crosslinker, making two rows (24 wells). These will be used as positive (with calcium) and negative controls (without calcium).
9. Repeat steps C6–7 with nanoparticle-only (no crosslinker) group if desired.
10. Add 6 μL of calcium chloride solution to each well. If nanoparticle aggregation or settling is a concern, duplicate the rows with nanoparticles and add isotonic saline in place of calcium chloride. This will serve as a non-crosslinking negative control with nanoparticles.
Critical: Start the measurement immediately; see steps C6–7.
11. Monitor the change in absorbance at 650 nm at 1-min intervals for 1 h.
12. To analyze the data, plot absorbance or transmission against time, normalizing to initial values at t = 0. Transmission can be calculated from absorbance via the following equation:
13. The overall coagulation potential (OCP) is calculated by plotting the normalized absorbance curves and computing the area underneath each curve.
D. Platelet flow cytometry
1. This protocol may be used to assess platelet-material interactions (not necessarily for hemostat design), such as checking for nonspecific binding to platelets, activation of quiescent platelets, or effect on activated platelets.
2. Following the procedure listed in section A, synthesize nanoparticles at the desired peptide functionality (the validated protocol used a 3:1 peptide-to-azide ratio).
Note: As the original experiment in the manuscript was a concentration screen, nanoparticles were formulated at 100, 50, 10, 5, and 1 mg/mL, and the crosslinkers were added in stoichiometric proportions previously described. Prepare the nanoparticles at 10× your desired testing concentration.
3. Following the procedure listed in section B, prepare PRP.
4. Following Recipes 8 and 9, prepare FACS buffer and diluted activated PRP.
Note: Depending on the number of samples or use of a well-plate instead of a FACS tube, you may wish to scale the solution up or down or thaw multiple aliquots of thrombin or GPRP.
5. Prepare inactivated PRP by substituting equivalent volumes of FACS buffer for thrombin and calcium solutions in Recipe 9.
6. Dilute nanoparticles tenfold in prepared PRP solutions into 1.5 mL microcentrifuge tubes. Each trial group should have a sample with activated platelets (in diluted activated PRP) and a negative control (in inactivated PRP). Include four positive controls without nanoparticles (fully stained, single color controls, and unstained), replacing the volume of nanoparticle solution with an equivalent volume of FACS buffer. These controls are summarized in Table 1.
Table 1. Positive and negative controls for flow cytometry. All reagents not added (-) are substituted with an equivalent volume of FACS buffer.
| Sample ID | CD41 antibody | CD62P antibody | Platelet activation |
|---|---|---|---|
| Unstained positive control | - | - | + |
| Single color positive control (CD41) | + | - | + |
| Single color positive control (CD62P) | - | + | + |
| Fully stained positive control | + | + | + |
| Fully stained negative control | + | + | - |
7. Incubate the solutions for 30 min under agitation at 37 °C.
8. Dilute the two antibodies (anti-CD41-AF488 and anti-CD62P-BV421) at a 1:5 ratio (20 μg/mL) from the concentration provided by the manufacturer. Add 5 μL of each antibody to the mixture for fully stained samples. For unstained and single-color controls, add FACS buffer to compensate for the deficit in volume.
9. Incubate the samples at RT for 30 min in the dark, and fix with 600 μL of 1% paraformaldehyde in saline.
10. Transfer to FACS tubes with cell strainers by pipetting samples directly through the cell strainer cap.
11. Analyze samples via flow cytometer, gating first for CD41-positive events to separate platelets from other cells or cell debris, then gating for CD62P-positive events to identify activated platelets (CD62P+/CD41+). 10,000 events were acquired. Representative contour plots and gating strategy can be accessed in the supporting information of the original research publication (open-access) [9].
E. Evaluating complement activation of nanoparticles
E1. Sample preparation
1. This protocol should be used to check complement activation levels prior to in vivo studies, as local inflammation or infusion reactions may occur.
2. Following the procedure listed in section A, synthesize nanoparticles at the desired peptide functionality (the validated protocol used a 3:1 peptide-to-azide ratio). Formulate nanoparticle stock solutions at 11 mg/mL and 5.5 mg/mL in isotonic glucose.
Note: The final nanoparticle dose should match the dosing for future in vivo studies.
3. Prepare a zymosan solution of 5 mg/mL in isotonic glucose as a positive control.
4. Following the procedure listed in section B, prepare PRP.
5. Dilute nanoparticles in PRP at a 1:10 ratio to yield 1 mg or 0.5 mg of nanoparticle/mL PRP in microcentrifuge tubes. Dilute zymosan at a 1:10 ratio to yield 0.5 mg/mL PRP. The validated protocol prepared six replicates per trial group.
6. Incubate for 45 min at 37 °C under agitation.
7. Spin down the samples at 3,000× g to remove both nanoparticles and platelets. The resulting serum should be completely clear.
8. Carefully transfer the serum samples to fresh microcentrifuge tubes without disturbing the pellet.
E2. C5a ELISA
1. Prepare ELISA reagents and standards according to manufacturer instructions (Invitrogen Complement C5a Human ELISA kit), which are summarized below. The kit includes pre-coated ELISA wells.
2. Dilute serum samples from the previous section 1:25 in sample diluent.
3. Wash the microwell strips with approximately 400 μL of wash buffer per well and empty them. Repeat once, for a total of two washes. Allow the buffer to sit in the wells for about 10–15 s before aspiration, taking care not to scratch the wells.
4. Empty wells and tap plate on an absorbent stack of paper towels to remove excess wash buffer. Proceed to the next step immediately.
5. Add 50 μL of sample diluent to all wells.
6. Add standards to designated wells in duplicate.
7. Add 50 μL of calibrator diluent to the wells in which you will be adding serum samples.
8. Add 50 μL of prediluted samples to all sample wells.
9. Cover with an adhesive film and incubate at RT for 2 h on a microplate shaker.
10. Retrieve the biotin-conjugate solution and assay buffer from the kit. Prepare biotin-conjugate by making 1:100 dilution of the concentrated biotin-conjugate solution with assay buffer (1×) in a clean plastic tube, with sufficient volume for 100 μL per well.
Note: This should be used with 30 min of dilution.
11. Remove adhesive film and empty wells. Wash microwell strips 6 times according to step E2.3. Proceed immediately to the next step.
12. Add 100 μL of diluted biotin-conjugate to all wells, including the blank wells.
13. Cover with an adhesive film and incubate at RT for 1 h on a microplate shaker.
14. Prepare Streptavidin-HRP by making a 1:200 dilution of the concentrated biotin-conjugate solution with assay buffer (1×) in a clean plastic tube, with sufficient volume for 100 μL per well.
15. Remove adhesive film and empty wells. Wash microwell strips 6 times according to step E2.3. Proceed immediately to the next step.
16. Add 100 μL of diluted Streptavidin-HRP to all wells, including the blank wells.
17. Cover with an adhesive film and incubate at RT for 1 h on a microplate shaker.
18. Remove adhesive film and empty wells. Wash microwell strips 6 times according to step E2.3. Proceed immediately to the next step.
19. Pipette 100 μL of TMB substrate into each well. Incubate for 30 min at RT away from light (covered with foil).
Note: You may want to check regularly for color development. The most concentrated standard should turn a dark blue color. Alternatively, monitor the color by measuring absorbance at 620 nm, aiming for an OD of 0.9–0.95.
20. Add 100 μL of stop solution and read absorbance of each microwell on a spectrophotometer using 450 nm as the primary wavelength (optionally 620 nm as the reference wavelength; 610–650 nm is acceptable).
21. Plot absorbance readings of standards against concentration to obtain a calibration curve and calculate C5a levels in samples.
F. Fibrin clot lysis capillary assay
F1. Sample preparation
1. This protocol should be used to check the effect of the hemostat in increasing the resistance of the clot to fibrinolysis, which is exacerbated during traumatic coagulopathy. The concentration of the fibrinogen stock solution in step F1.3 may be varied based on the desired final concentration (fibrinogen content in blood varies with the degree of blood loss).
2. Dissolve 100 mg of human fibrinogen in 10 mL of HEPES buffer and add 70 μL of 25 mg/mL AF488 in DMSO. Allow to react overnight at 4 °C.
3. Dialyze over 24 h in HEPES buffer to remove unreacted dye and dilute to a stock concentration of 5.5 mg/mL.
Note: This step may be expedited by following the same procedure to purify nanoparticles (washing with Amicon filters).
4. To make the positive control (fibrin-clot only), begin by mixing 250 μL of AF488-labeled fibrinogen solution with 350 μL of HEPES.
5. To make the nanoparticle-only group, begin by mixing 250 μL of fibrinogen solution with 250 μL of nanoparticle stock solution (22 mg/mL) and 100 μL of HEPES.
6. To make the two-component system, begin by mixing 250 μL of fibrinogen solution with 250 μL of nanoparticle stock solution (22 mg/mL) and 100 μL of crosslinker solution at stoichiometric equivalence.
Critical: If testing crosslinkable nanoparticles as in step F1.6, you must proceed immediately to the next step.
7. Add 30 μL of thrombin (100 U/mL) and 500 μL of HEPES to a glass shell vial and mix thoroughly.
8. Use a micropipette to draw up the positive control fibrinogen solution (step F1.4).
Critical: Do not add to the shell vial yet.
9. Take three square glass capillaries of 1 mm inner diameter (VitroCom) and hold them in your free hand.
10. Dispense the fibrinogen solution into the shell vial and immediately immerse the square capillaries in the shell vial. Allow to gel for 45 min, covered under foil, to prevent photobleaching of the labeled fibrinogen (Figure 4A).
11. Repeat steps F1.7–10 for the nanoparticle-only trial group (step F1.5) and the two-component hemostat (step F1.6).
12. Seal the ends of the capillaries that were immersed in fibrinogen with vacuum grease.
13. Add plasmin into the open end of the capillary using a gel loading tip directly at the capillary interface until it is full. Seal with vacuum grease. You may add saline instead of plasmin to create a non-degrading negative control.
F2. Monitoring clot lysis
1. Place on a fluorescent microscope (1.25× objective, 488 nm laser). Image at 0, 2, 4, 6, 8, 12, and 24 h, covering with foil in between measurements to minimize photobleaching (see Troubleshooting).
2. Analyze the data with ImageJ, using the Analyze and Measure tool. There are a number of ways to analyze the data; the one validated in the experiment is by outlining a region of interest (ROI) at the end of the capillary (Figure 4C, D) and tracking its increase in fluorescence as fibrinogen diffuses from the degrading clot. This value is first normalized to a ROI of the same size (Figure 4B) away from the interface to account for photobleaching of the gel over time.
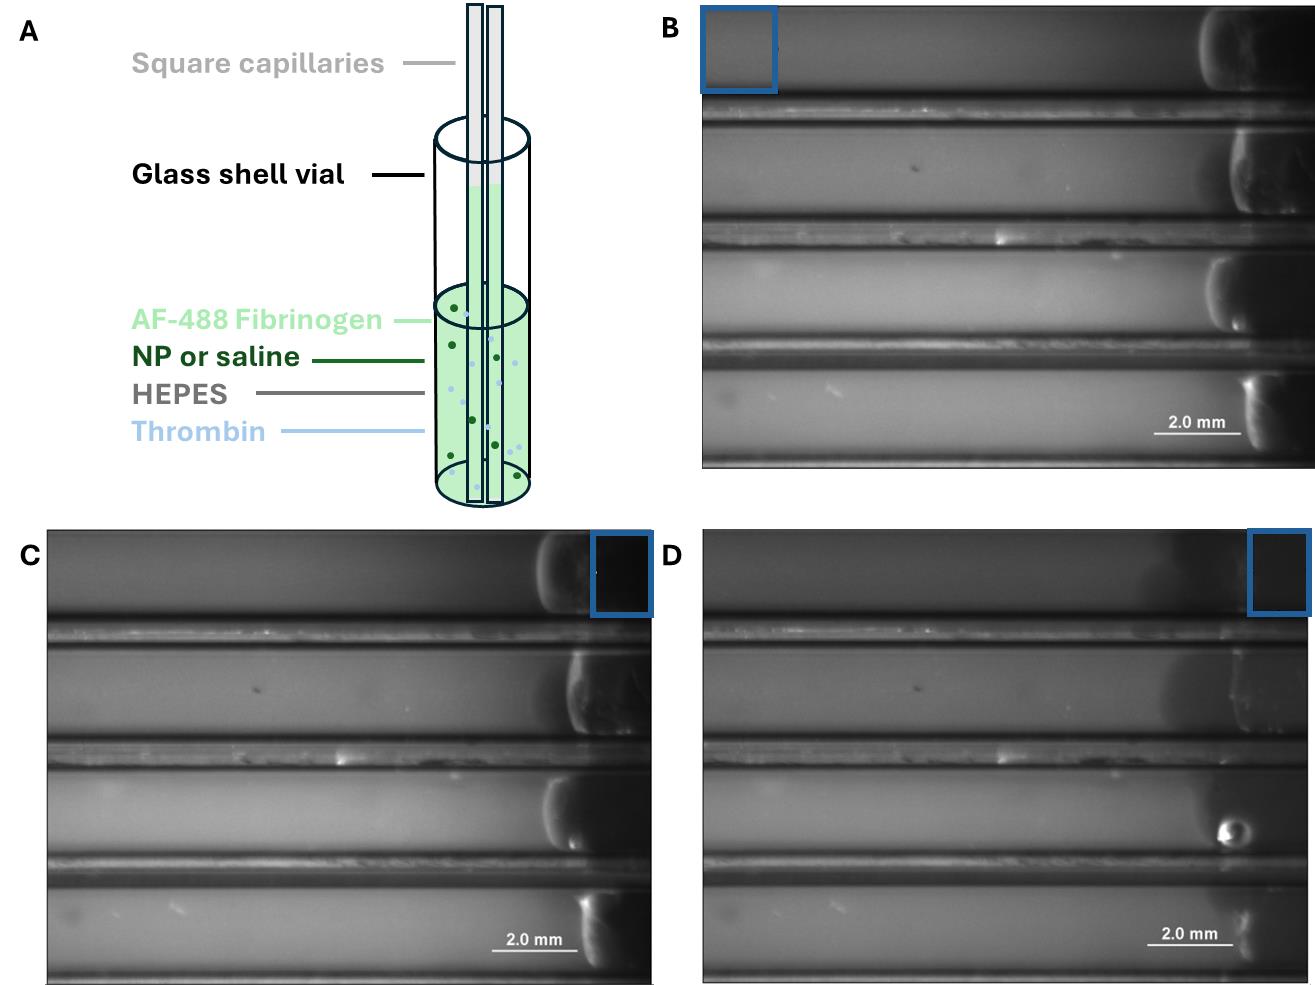
Figure 4. Fibrin clot lysis capillary assay. (A) Diagram of capillaries in a glass shell vial of fluorescently labeled fibrinogen. (B) Images of capillaries (filled with plasmin). ROI indicates a region that is used for normalization as described in the protocol above. (C) Representative image of capillaries at t = 0; ROI indicating the region that will be used to quantify leached fluorescence. (D) Representative image of the same capillaries at t = 12 h with the same ROI. Observe the lightening of the plasmin (right side of tubes) as the fibrin clot degrades.
Data analysis
Use ImageJ (Measure tool under the Analyze tab). The following statistical tests were used to analyze the data in the experiments using Prism 5: Two-way ANOVA with Tukey’s post-test for platelet recruitment assays (hemodiluted and normal conditions) and fibrin clot lysis capillary assay, and one-way ANOVA with Tukey’s post-test for evaluating complement activation from nanoparticles and fibrin crosslinking in hemodiluted conditions. Outliers were detected and excluded via Grubbs’ test (GraphPad Outlier Calculator) for all experiments.
Validation of protocol
This protocol (or parts of it) has been used and validated in the following research article(s):
• Hong et al. [9]. Engineering a Two‐Component Hemostat for the Treatment of Internal Bleeding through Wound‐Targeted Crosslinking. Advanced Healthcare Materials. (Figure 2B, D, Figures 4–6, Figure S6)
• Hong et al. [8]. Modulating Nanoparticle Size to Understand Factors Affecting Hemostatic Efficacy and Maximize Survival in a Lethal Inferior Vena Cava Injury Model. ACS Nano. (Figure 5)
General notes and troubleshooting
General notes
1. Many steps in these assays are time-sensitive, requiring the next step to be done immediately after, as the solution you are working with may begin to gel or aggregate. It is important to familiarize yourself with the procedure beforehand.
2. Platelet activity can also be affected by storage. If PRP is used in two different experiments at timepoints several hours apart (e.g., overnight), they will likely not be comparable even if the PRP is from the same donor. Therefore, all trial groups should be run at the same time, with positive and negative controls for normalization purposes.
3. Depending on the stability of nanoparticles you plan on using, high concentrations may predispose them to aggregating. To test this, a pilot stability study (leaving the stock concentration for a certain amount of time and sampling for dynamic light scattering measurements) could be beneficial.
4. While it is possible to scale up or down some of the assays in this experiment (e.g., using 384 instead of 96-well for platelet recruitment assays), this will come at the expense of increased experimental variability for smaller samples. The well plate sizes and replicate numbers have been optimized for the current system.
Troubleshooting
Problem 1: Sample readings for platelet recruitment assays exceed the most concentrated standard of the calibration curve.
Possible cause: Strong binding affinity of material to platelets and high aggregation potential.
Solution: Instead of using the undiluted positive control sample to construct the calibration curve, use dilutions of PRP (lysed in RIPA buffer), or dilute the samples further (5–10× instead of 3×).
Problem 2: Capillaries drying out overnight.
Possible cause: Time, heat from microscope, incomplete sealing with vacuum grease.
Solution: Leave soaked Kimwipes or paper towels (with deionized water) around the capillaries and underneath the foil.
Acknowledgments
Conceptualization, C.H., B.D.O., P.T.H.; Investigation, C.H., Y.H., the David H. Koch Institute Flow Cytometry Core; Writing—Original Draft, C.H.; Writing—Review & Editing, C.H., P.T.H.; Funding acquisition, P.T.H., B.D.O., A.M.B; Supervision, P.T.H., B.D.O., A.M.B.
Original research paper supported by W911NF-18-2-0048 and W81XWH-18-2-0010 from the U.S. Army Research Office and the Department of Defense. Protocols were validated in [9] (flow cytometry also in [8] and transmission-based coagulation measurements in [12]). Protocols were adapted from [8,13–15].
Competing interests
Three of the authors (C.H., B.D.O., and P.T.H.) hold a patent application related to this work: HEMOSTATIC NANOPARTICLES FOR THE TREATMENT OF NON-COMPRESSIBLE HEMORRHAGE AND INTERNAL BLEEDING (Patent number US-20230406905-A1).
References
- Zhang, Z. Y., Zhang, H. Y., Talmy, T., Guo, Y., Zhou, S. R., Zhang, L. Y. and Li, Y. (2021). Management of non-compressible torso hemorrhage: An update. Chin J Traumatolo. 24(3): 125–131. https://doi.org/10.1016/j.cjtee.2021.03.005
- Skeik, N., Smith, J. E., Jensen, J. D., Nowariak, M. E., Manunga, J. M. and Mirza, A. K. (2021). Literature review of distal deep vein thrombosis. J Vasc Surg Venous Lymphat Disord. 9(4): 1062–1070.e6. https://doi.org/10.1016/j.jvsv.2021.01.018
- Hong, C., Olsen, B. D. and Hammond, P. T. (2022). A review of treatments for non-compressible torso hemorrhage (NCTH) and internal bleeding. Biomaterials. 283: 121432. https://doi.org/10.1016/j.biomaterials.2022.121432
- Girish, A., Jolly, K., Alsaadi, N., de la Fuente, M., Recchione, A., An, R., Disharoon, D., Secunda, Z., Raghunathan, S., Luc, N. F., et al. (2022). Platelet-Inspired Intravenous Nanomedicine for Injury-Targeted Direct Delivery of Thrombin to Augment Hemostasis in Coagulopathies. ACS Nano. https://doi.org/10.1021/acsnano.2c05306
- Modery-Pawlowski, C. L., Tian, L. L., Ravikumar, M., Wong, T. L. and Gupta, A. S. (2013). In vitro and in vivo hemostatic capabilities of a functionally integrated platelet-mimetic liposomal nanoconstruct. Biomaterials. 34(12): 3031–3041. https://doi.org/https://doi.org/10.1016/j.biomaterials.2012.12.045
- Rourke, C., Curry, N., Khan, S., TAYLOR, R., RAZA, I., DAVENPORT, R., STANWORTH, S. and BROHI, K. (2012). Fibrinogen levels during trauma hemorrhage, response to replacement therapy, and association with patient outcomes. J Thromb Haemost. 10(7): 1342–1351. https://doi.org/10.1111/j.1538-7836.2012.04752.x
- Vernon, T., Morgan, M. and Morrison, C. (2019). Bad blood: A coagulopathy associated with trauma and massive transfusion review. Acute Med Surg. 6(3): 215–222. https://doi.org/10.1002/ams2.402
- Hong, C., Alser, O., Gebran, A., He, Y., Joo, W., Kokoroskos, N., Velmahos, G., Olsen, B. D. and Hammond, P. T. (2022). Modulating Nanoparticle Size to Understand Factors Affecting Hemostatic Efficacy and Maximize Survival in a Lethal Inferior Vena Cava Injury Model. ACS Nano. 16(2): 2494–2510. https://doi.org/10.1021/acsnano.1c09108
- Hong, C., He, Y., Bowen, P. A., Belcher, A. M., Olsen, B. D. and Hammond, P. T. (2023). Engineering a Two‐Component Hemostat for the Treatment of Internal Bleeding through Wound‐Targeted Crosslinking. Adv Healthcare Mater. 12(20): e202202756. https://doi.org/10.1002/adhm.202202756
- Biorender. (2025). Sample plate layout. Created in BioRender. Hammond, P. (2026) https://BioRender.com/2jv0x90
- Braune, S., Zhou, S., Groth, B. and Jung, F. (2015). Quantification of adherent platelets on polymer-based biomaterials. Comparison of colorimetric and microscopic assessment. Clin Hemorheol Microcirc. 61(2): 225–236. https://doi.org/10.3233/ch-151995
- Gkikas, M., Peponis, T., Mesar, T., Hong, C., Avery, R. K., Roussakis, E., Yoo, H. J., Parakh, A., Patino, M., Sahani, D. V., et al. (2019). Systemically Administered Hemostatic Nanoparticles for Identification and Treatment of Internal Bleeding. ACS Biomater Sci Eng. 5(5): 2563–2576. https://doi.org/10.1021/acsbiomaterials.9b00054
- Södergren, A. L. and Ramström, S. (2018). Platelet subpopulations remain despite strong dual agonist stimulation and can be characterised using a novel six-colour flow cytometry protocol. Sci Rep. 8(1): e1038/s41598–017–19126–8. https://doi.org/10.1038/s41598-017-19126-8
- Park, J. Y., Gemmell, C. H. and Davies, J. E. (2001). Platelet interactions with titanium: modulation of platelet activity by surface topography. Biomaterials. 22(19): 2671–2682. https://doi.org/10.1016/s0142-9612(01)00009-6
- Gkikas, M., Timonen, J., Ruokolainen, J., Alexandridis, P. and Iatrou, H. (2013). Facile aqueous synthesis and stabilization of nearly monodispersed gold nanospheres by poly(L‐proline). J Polym Sci, Part A: Polym Chem. 51(6): 1448–1456. https://doi.org/10.1002/pola.26517
Article Information
Publication history
Received: Sep 30, 2025
Accepted: Nov 12, 2025
Available online: Nov 26, 2025
Published: Dec 20, 2025
Copyright
© 2025 The Author(s); This is an open access article under the CC BY-NC license (https://creativecommons.org/licenses/by-nc/4.0/).
How to cite
Hong, C., He, Y., Belcher, A. M., Olsen, B. D. and Hammond, P. T. (2025). In Situ Crosslinking of Bioorthogonal Nanoparticles to Restore Clot Stability in Coagulopathic Blood. Bio-protocol 15(24): e5548. DOI: 10.21769/BioProtoc.5548.
Category
Biological Engineering > Biomedical engineering > Drug Delivery
Medicine
Do you have any questions about this protocol?
Post your question to gather feedback from the community. We will also invite the authors of this article to respond.