

Radial Profile-Based Quantification of Centrosomal Proteins
发布: 2026年03月20日第16卷第6期 DOI: 10.21769/BioProtoc.5638 浏览次数: 13
评审: Anonymous reviewer(s)
参见作者原研究论文
The authors used this protocol in:

Mar 2025


Abstract
Centrosomes are dynamic organelles critical for mitotic spindle assembly and cilia formation. Here, I describe a protocol for quantifying relative centrosomal protein abundance in Drosophila melanogaster embryos using radial profile analysis of fluorescence intensity. The method involves embryo collection, manual dechorionation, mounting for live imaging, confocal microscopy, and subsequent image analysis. Radial profiling allows quantification of relative protein abundance together with its spatial distribution at the centrosome, providing either relative or normalized intensity profiles. I then outline how this approach can be integrated with complementary techniques such as fluorescence recovery after photobleaching (FRAP) and super-resolution imaging, in this case, three-dimensional structured illumination microscopy (3D-SIM). Combining radial fluorescence profiling with these imaging modalities enables high-resolution, quantitative analysis of dynamic centrosome assembly in a genetically tractable system.
Key features
• Manual embryo dechorionation and heptane glue mounting enable reliable preparation for high-quality live imaging.
• Radial profile analysis provides quantitative measurement of centrosomal protein abundance and spatial distribution.
• The protocol is compatible with both confocal and 3D-SIM super-resolution microscopy, offering complementary spatial and temporal resolution.
Keywords: Drosophila embryoGraphical overview
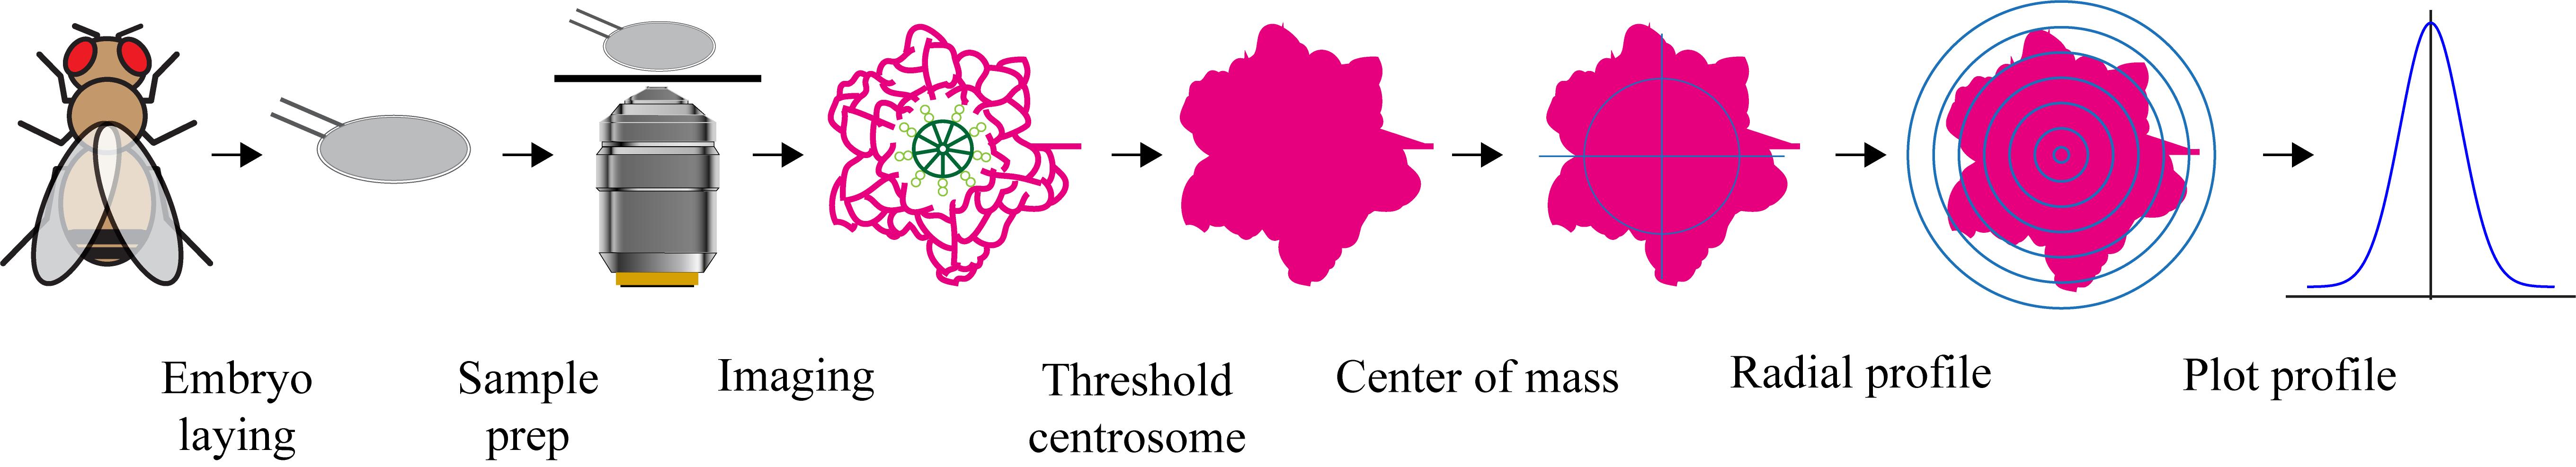
Workflow for centrosome radial profiling. Drosophila embryos are imaged, centrosomes segmented, centroids determined, and radial fluorescence intensity profiles generated for quantitative analysis.
Background
The centrosome is a cellular organelle composed of a pair of orthogonally arranged, cylindrical centrioles surrounded by an amorphous mesh of various proteins, called pericentriolar material (PCM). Centrosomes are important for many cellular functions, most notably spindle pole organization during mitosis and ciliogenesis in quiescent cells [1–3].
The centrosome is not a static organelle but rather a dynamic structure that varies in both composition and organization throughout the cell cycle [4–7]. Two notable events during the cell cycle are (i) the growth of a daughter centriole (on the side of the preexisting mother centriole) during S phase and (ii) the dramatic increase in PCM volume on the entry into mitosis. Monitoring these events live in an in vivo system is essential to fully capture their dynamics, which can range from seconds (e.g., mitotic kinase turnover) to minutes (e.g., the dynamics of pericentriolar material scaffold proteins such as Cnn and Spd-2) [8]. Defining how and where centrosomal proteins are recruited and quantifying their abundance is fundamental to modeling centrosome formation. Quantification through radial profile analysis can be presented either with intensity levels normalized to the average peak value of the wild-type protein, allowing comparison of protein abundance between genetic backgrounds, or with intensity levels normalized so that the peak intensity is set to 1, allowing comparisons of protein localization irrespective of protein abundance at the centrosome.
Radial profiling of centrosomal fluorescence intensity, using an analysis method similar to the one described here, has been routinely employed to investigate centrosome organization in Caenorhabditis elegans [9,10]. In the present work, we describe its implementation in Drosophila, although the same analytical approach is readily applicable to centrosomes in other model organisms and experimental systems.
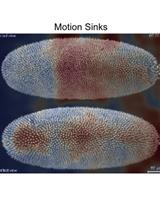
The syncytial Drosophila embryo is a powerful system for quantifying centrosome assembly dynamics [11]. During the first 13 nuclear cycles, nuclei divide in a shared cytoplasm without cytokinesis. In cycles 10–13, centrosomes localize at the embryonic cortex, where they are ideally positioned for imaging near the coverslip [12,13]. These divisions are nearly synchronous, allowing multiple events to be quantified in parallel; combined with the large number of centrosomes undergoing rapid processes, this enables rigorous statistical analysis [14]. Together with genetic tractability, this enables integration with mathematical modeling, providing fundamental insights into centrosome biology [15,16].
Centrosomes in the fly embryo have been imaged using conventional microscopy for many years [17]. Recently, two imaging techniques, fluorescence recovery after photobleaching (FRAP) and three-dimensional structured-illumination microscopy (3D-SIM), have been applied to this system to examine the dynamics of centrosome assembly in greater detail. FRAP allows the dynamic incorporation of centrosomal proteins to be investigated [8,18,19]. In this technique, fluorescently tagged proteins within the centrosome are bleached with a high-power laser. The subsequent replacement of bleached molecules at the centrosome with unbleached molecules from the cytoplasm provides details on incorporation location and dynamics. 3D-SIM extends the resolution of imaging beyond that defined by Abbe’s law of diffraction [20,21]. In this technique, the sample is illuminated with patterned light that interferes with the sub-resolution structures within the sample. The Moiré interference pattern generated enables the sub-diffraction information to be algorithmically decoded and reconstructed [22,23]. This enhanced resolution has revealed finer details of centrosomal protein localization [24–27]. Indeed, FRAP and 3D-SIM can be combined to provide the localization of incorporating molecules at a higher resolution [8,28,29].
Here, I provide guidance on how to use radial profile analysis to quantify centrosome protein abundance in the Drosophila embryo imaged by standard confocal microscopy and then demonstrate its application in combination with FRAP and 3D-SIM. I illustrate the various approaches with previously unpublished original data.
Materials and reagents
Biological materials
The imaging approaches described in this protocol assume that a fly line is used where the protein(s) of interest are fluorescently tagged. Wherever available, lines expressing fluorescently tagged proteins under the control of the endogenous promoter in a mutant background are selected, as these provide expression levels close to endogenous, confirmed by western blotting. The fluorescent protein selected depends on experimental requirements. For two-color experiments, eGFP, NeonGreen [30], or StayGold [31] (the latter generally more photostable) are typically combined with mCherry, a relatively bright and stable red fluorophore [32,33].
Reagents
1. Instant dried yeast (Fermipan red)
2. Bacteriological agar (VWR, catalog number: 84609)
3. Sucrose (Sigma-Aldrich, catalog number: RDD023)
4. Apple or cranberry juice
5. Heptane (Sigma-Aldrich, catalog number: 246654)
6. Voltalef H10S PCTFE oil ARKEMA (Samaro, catalog number: AK6208)
7. Immersion oil for 3D-SIM imaging on OMX-Blaze, DV Immersion Oil Kit containing refractive index oil 1.514 (GE Healthcare, catalog number: 29163068)
8. Immersion oil with a refractive index of 1.518 for spinning disc confocal (ImmersolT 518 F, Carl Zeiss, catalog number: 433802-9010-000)
Solutions
1. Yeast paste (see Recipes)
2. Fruit juice agar plates (see Recipes)
3. Heptane glue (see Recipes)
Recipes
1. Yeast paste
Mix instant dried yeast with water (approximately 10 g of yeast in 12 mL of water) in a 100 mL beaker to achieve a thick, creamy consistency.
2. Fruit juice agar plates
a. Boil 9 g of agar in 300 mL of distilled water and, separately, 10 g of sucrose in 100 mL of apple juice (or cranberry juice).
b. Mix together the agar and sugar solutions once fully dissolved.
c. Pour the mix into Petri dishes of a size designed to fit snugly into the bottom of the fly collection chamber (typically a diameter of 50 mm and height of 20.3 mm) to a depth of ~15 mm. Leave to cool and dry at room temperature for ~1 h before use. Plates can be stored at 4 °C for 2–3 days. Before use, add a button-sized drop of yeast paste to each plate and leave to dry. The yeast paste needs to dry to prevent the flies from getting stuck in the liquid yeast.
3. Heptane glue
a. Fill a 50 mL conical tube with double-sided sticky tape (remove the release liner and tightly pack approximately 1 m of tape into the tube) and add 20 mL of heptane. Leave the tube rotating overnight.
b. Remove the tape and centrifuge the heptane glue at 15,700 RCF to remove solids. The glue can be kept indefinitely at RT in an Eppendorf tube sealed with Parafilm.
Laboratory supplies
1. Petri dishes, 50 mm diameter (Fisher Scientific, catalog number: 10655821)
2. Glass-bottom 35 mm dishes (MatTek, catalog number: P35G-1.5-14-C)
3. Paintbrush (size 3)
4. Fine forceps (Dumont No. 5)
5. Microscope slides (Appleton Woods, catalog number: MS529)
6. Double-sided sticky tape (Scotch 665 Double-Sided Tape)
Note: The adhesion of some brands of double-sided sticky tape is too strong to dechorionate the embryos successfully. Scotch tape is particularly well-suited for dechorionation.
7. Sticky tape (single-sided) for holding the fruit juice agar plate onto the fly collection chamber (Starlabs ID Tape 55 m long × 19.0 mm wide, catalog number: E9055-1913)
Equipment
1. Fly collection chamber: This is typically a Perspex cylinder with one end sealed with a fine wire mesh (so that flies can breathe but not escape) (Flystuff Inc., catalog numbers: 59-100 or 59-101)
2. Humidified incubator at 25 °C in a reverse day light cycle to optimize the embryo collection during standard laboratory working hours
3. Binocular dissecting microscope (Nikon, model: SMZ800)
4. Rotator mixer (Stuart, model: SB3)
5. Confocal microscope with FRAP unit
Note: The example shown in Figure 3A was acquired using a Perkin Elmer Spinning disc system running Volocity 6.3 software mounted on a Zeiss Axiovert microscope with a 63×/1.4 NA oil immersion objective lens (60×/1.3 NA Silicone immersion oil lenses are also suitable). This system is equipped with a Hamamatsu Orca ER CCD camera and 488 and 568 nm laser lines. Comparable FRAP experiments can be performed on many other confocal systems.
6. 3D-SIM microscope with blaze unit
Note: The example shown in Figure 4A–E was acquired using a DeltaVision OMX V3 Blaze microscope (GE Healthcare), fitted with a 60×/1.42 NA UPlanSApo oil immersion objective lens. This system is fitted with PCO Edge 5.5 sCMOS cameras and 488 and 593 nm laser lines. Other SIM systems are suitable for similar experiments.
Software and datasets
1. Volocity (Perkin Elmer)
2. SoftWoRx (GE Healthcare)
3. ImageJ/FIJI (http://fiji.sc/) [34]
4. SIMcheck plugin (http://downloads.micron.ox.ac.uk/fiji_update/SIMcheck/) [35]
5. Radial Profile plugin (https://imagej.net/ij/plugins/radial-profile.html)
Procedure
文章信息
稿件历史记录
提交日期: Sep 24, 2025
接收日期: Feb 11, 2026
在线发布日期: Feb 27, 2026
出版日期: Mar 20, 2026
版权信息
© 2026 The Author(s); This is an open access article under the CC BY license (https://creativecommons.org/licenses/by/4.0/).
如何引用
Readers should cite both the Bio-protocol article and the original research article where this protocol was used:
- Wainman, A. (2026). Radial Profile-Based Quantification of Centrosomal Proteins. Bio-protocol 16(6): e5638. DOI: 10.21769/BioProtoc.5638.
- Hu, L., Wainman, A., Andreeva, A., Apizi, M., Alvarez-Rodrigo, I., Wong, S.-S., Saurya, S., Sheppard, D., Cottee, M., Johnson, S., et al. (2025). The conserved Spd-2/CEP192 domain adopts a unique protein fold to promote centrosome scaffold assembly. Sci Adv. 11(12): eadr5744. https://doi.org/10.1126/sciadv.adr5744
分类
癌症生物学 > 细胞周期检查点(checkpoint) > 细胞生物学试验
细胞生物学 > 细胞成像 > 活细胞成像
您对这篇实验方法有问题吗?
在此处发布您的问题,我们将邀请本文作者来回答。同时,我们会将您的问题发布到Bio-protocol Exchange,以便寻求社区成员的帮助。