

A Guide to Reproducible Cellulose Synthase Density and Speed Measurements in Arabidopsis thaliana
发布: 2026年03月20日第16卷第6期 DOI: 10.21769/BioProtoc.5634 浏览次数: 19
评审: Felix RuhnowAnonymous reviewer(s)
参见作者原研究论文
The authors used this protocol in:
Dec 2024


Abstract
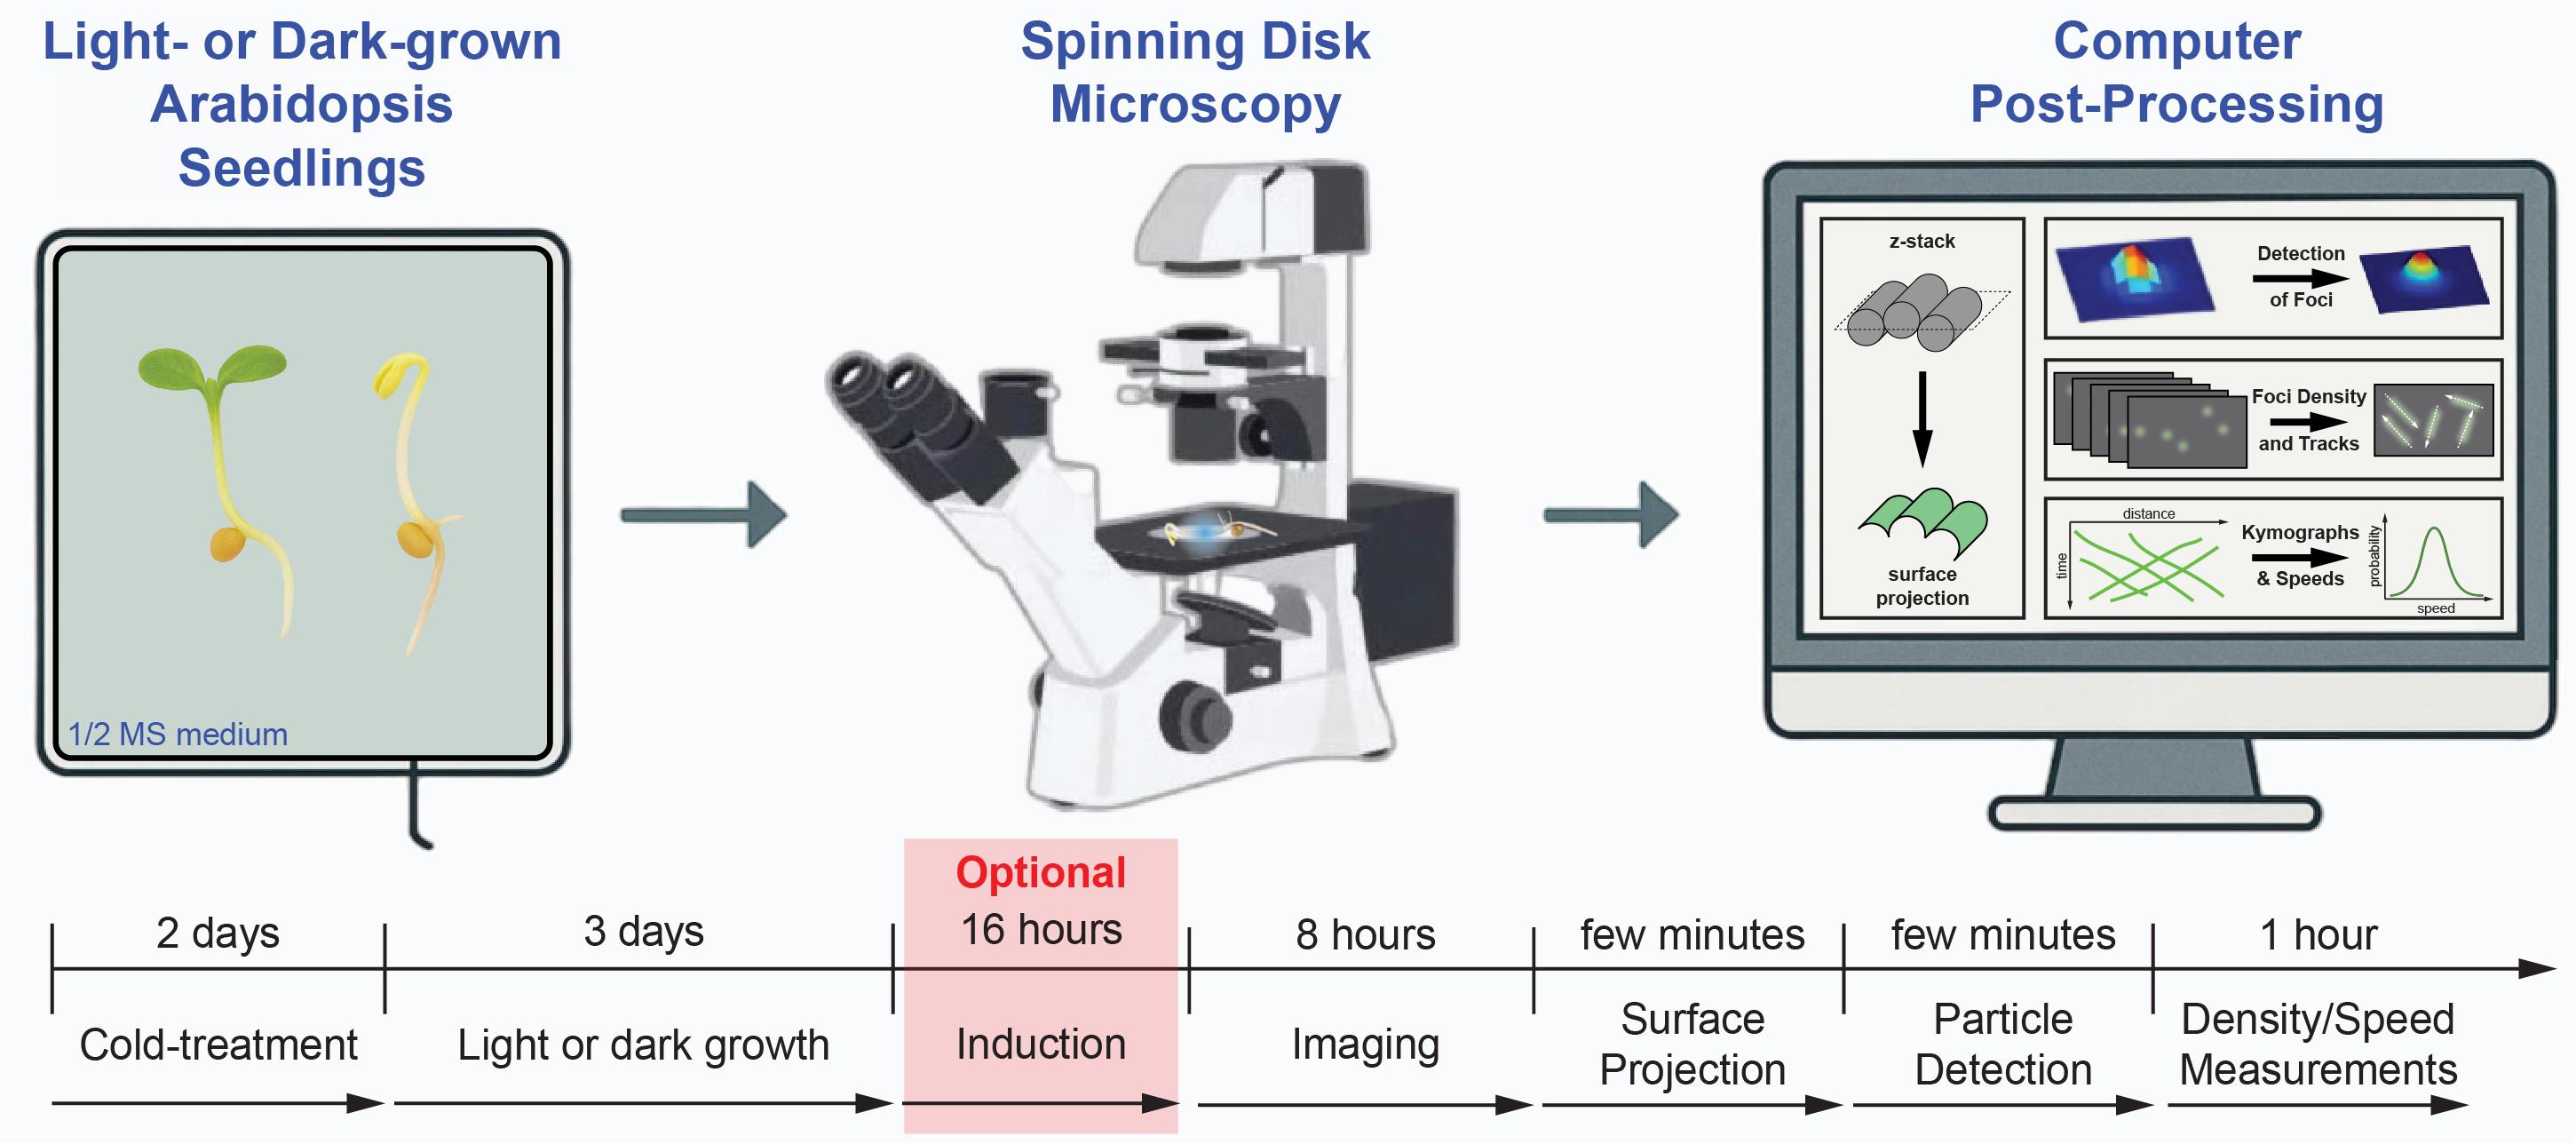
Cellulose synthase complexes (CSCs) play a central role in plant cell wall formation. Their dynamic behavior at the plasma membrane leads to the deposition of cellulose microfibrils into the apoplastic space, thereby shaping the architecture and mechanical properties of the cell wall. Although previous imaging studies have provided important insights into CSC dynamics and localization, standardized and reproducible workflows for quantitative measurements of CSC speed and density remain limited. Here, we present a reproducible live-cell imaging and analysis workflow for quantifying the speed and density of fluorescently labeled CSCs at the plasma membrane in Arabidopsis thaliana. The protocol integrates optimized spinning-disk confocal imaging, surface-based projection of z-stack recordings, automated detection of diffraction-limited CSCs foci, and kymograph-based speed measurements using freely available tools in Fiji. While selected steps, such as region of interest definition and parameter selection for spot detection or trajectory analysis, remain user-guided, these decisions are constrained to well-defined stages within an otherwise standardized pipeline, thereby reducing variability and improving reproducibility across experiments. The workflow has been validated across multiple tissues, reporter lines, genetic backgrounds, and perturbation conditions in Arabidopsis and enables robust comparative analysis of CSC dynamics. Beyond CSCs, this workflow is expected to be adaptable to other fluorescently labeled proteins that appear as diffraction-limited foci at or near the plasma membrane.
Key features
• Enables accurate CSC speed and density measurements during both primary and secondary cell wall formation using spinning-disk confocal time-lapse imaging.
• Combines surface-projection, kymograph analysis, and high-throughput particle detection to quantify CSC dynamics even in crowded or low-signal plasma membrane regions.
• Provides a standardized analysis workflow validated across multiple Arabidopsis genotypes, including inducible systems and mutant backgrounds that possess altered cell wall biosynthesis.
• Applicable to any fluorescently labeled diffraction-limited foci at or near the plasma membrane, extending the workflow beyond CSCs.
Keywords: Cellulose synthase complexes (CSC)Graphical overview
Background
Cellulose synthase A (CESA) complexes (CSCs) synthesize cellulose at the plasma membrane. In doing so, they define the mechanical properties of plant cell walls [1–4]. Their dynamic behavior, particularly their speed and density at the plasma membrane, provides direct readouts of catalytic activity, trafficking efficiency, and interactions with the cytoskeleton [5–15]. In Arabidopsis thaliana, CSCs operate in both primary cell wall (PCW) and secondary cell wall (SCW) contexts and differ in their CESA composition: PCW CSCs are heterotrimers of CESA1, CESA3, and CESA6-like isoforms, whereas SCW CSCs incorporate CESA4, CESA7, and CESA8 [2,16–22]. CSC dynamics vary with genetic background and developmental stage, and respond rapidly to environmental stimuli, making CSC motility a sensitive quantitative marker for cell wall biosynthesis [19,21,23–31].
Live-cell studies have revealed that CSCs move laterally within the plane of the plasma membrane and often track along cortical microtubules [5,7–9,22,25]. However, accurately quantifying their behavior remains challenging. Structured illumination microscopy provides high-resolution imaging of primary cell wall CSCs but is optically most reliable within shallow imaging depths near the coverslip [32]. Accordingly, imaging of cortical plasma membrane regions adjacent to the coverslip is generally advantageous for quantitative analysis. For cells or membrane domains located deeper within the tissue or further away from the coverslip, computational surface projection approaches can compensate for curvature and optical attenuation, thereby extending quantitative accessibility. Nevertheless, even under standard confocal imaging conditions, quantitative analysis is frequently complicated by background fluorescence arising from brighter and highly mobile intracellular structures such as Golgi bodies, variable signal intensities, lateral drift during time-lapse acquisition, and photobleaching. Cells with complex three-dimensional morphology, such as pavement cells, require acquisition of z-stacks that tend to highlight even more Golgi bodies, unlike hypocotyl cells that are typically imaged at a single focal plane close to the coverslip. In addition, traditional manual or semi-automated tracking approaches introduce user bias and limit throughput, particularly in crowded membrane regions where CSC trajectories overlap.
To address these limitations, we developed a reproducible workflow that integrates optimized spinning-disk confocal imaging with surface-based projection of z-stack recordings, automated diffraction-limited spot detection, and kymograph-based speed measurements. By preferentially extracting plasma-membrane surface information—for example, by applying optional surface-projection methods to suppress out-of-plane intracellular signals—and using intensity- and shape-based filtering to distinguish CSCs from Golgi-derived fluorescence, this approach robustly isolates plasma membrane–localized CSCs across diverse cell types and experimental conditions. Explicit correction for lateral drift and standardized acquisition settings further improves spatial consistency over time. Together, these elements represent a key technical advance to provide quantitative metrics suitable for comparing genotypes, treatments, and developmental stages with improved robustness and reproducibility.
This protocol therefore establishes standardized conditions for imaging, image processing, foci detection, and kymograph analysis, enabling consistent quantification of CSC speed and density across experiments and laboratories [21,28]. While the workflow does not fully eliminate user input, potential sources of user bias are restricted to a small number of well-defined and explicitly documented steps, such as region of interest (ROI) selection and parameter tuning for spot detection or projection methods. By constraining user decisions to these controlled stages and embedding them within an otherwise standardized acquisition and analysis pipeline, the protocol substantially reduces variability and improves reproducibility compared with traditional manual or ad hoc CSC-tracking approaches. Because the workflow relies on diffraction-limited spot detection and surface-based trajectory extraction rather than CSC-specific features, it is also readily applicable to other fluorescently labeled membrane-associated proteins with similar optical appearances. Although the core principles of this workflow are broadly applicable, experimental validation in the present study was performed exclusively in Arabidopsis.
Materials and reagents
Biological materials
1. SCW imaging: mNeonGreen-CESA7 (mNG-CESA7) marker in the Col-0 wild-type or the cobra-like4/irx6-2 (GK-329F09) mutant. Both lines also carried the inducible VND7-GR to induce SCW formation [33]. Request seeds from Lacey Samuels’ or Shawn Mansfield’s lab.
2. PCW imaging: GFP-CESA3 marker in the Col-0 wild type and the csi1-1/pom2-8 (SALK_136239) mutant backgrounds. Request seeds from Arun Sampathkumar’s or René Schneider’s lab.
Reagents
1. KOH (Sigma, catalog number: 484016)
2. Dexamethasone (DEX) (Sigma, catalog number: D4902-25MG)
3. Sucrose (VWR, catalog number: 27483.294)
4. MS salt including vitamins (Duchefa Biochemie, catalog number: M0222.0010)
5. MES [2-(N-morpholino)ethanesulfonic acid] (Sigma, catalog number: M8250-25g)
6. Micro-agar (Duchefa Biochemie, catalog number: M1002.1000)
7. 12.5% sodium hypochlorite (Carl Roth, catalog number: 9062.4)
8. Tween 20 (Sigma, catalog number: P1379-250ML)
9. Triton X-100 (Sigma, catalog number: X100-100ML)
10. Agarose standard (Carl Roth, catalog number: 3810.3)
11. Dimethyl sulfoxide (DMSO) (Carl Roth, catalog number: 7029.1)
12. Milli-Q water (MQ-H2O) (alternative: deionized/double-distilled H2O)
13. 1 M KOH (dissolve in MQ-H2O, store near pH meter) (Sigma, catalog number: P1767-250G)
14. 10 mM DEX (dissolve in DMSO, store 1 mL aliquots in -20 °C) (Sigma, catalog number: D4902-25MG)
Solutions
1. 1/2 MS solid medium (± 1% sucrose) (see Recipes)
2. Seed sterilization solution (see Recipes)
3. Sample holders and 1% agarose sandwiches for microscopy (see Recipes)
Recipes
1. 1/2 MS solid medium (± 1% sucrose)
| Reagent | Final concentration | Quantity or volume |
|---|---|---|
| Sucrose (optional) | 1% (w/v) | 10 g |
| MS salt (incl. vitamins) | 1/2 strength | 2.2 g |
| MES | 0.5 g | |
| 1 M KOH | to pH 5.8 | |
| MQ-H2O | top up to 800 mL |
Adjust the pH of the medium to 5.8 by carefully adding drops of 1 M KOH while stirring with a magnetic stirrer. Be careful to use the smallest drops that can be released by the glass pipette and wait a few seconds between adding additional drops to avoid overshooting the pH. After pH adjustment, bring the volume to 1,000 mL with MQ-H2O water. Transfer the solution to a bottle containing 8 g of micro-agar, mix thoroughly, and autoclave; if no agar is added, the same preparation yields standard 1/2 MS liquid medium. Store the sterilized medium in a cool, dark place (cabinet or cold room) and use within two months.
To prepare solid 1/2 MS plates, re-melt autoclaved medium in a microwave oven. To avoid boiling over, reduce microwave power to 300 W (30%). Then, allow liquefied medium to cool in a 60 °C water bath. All subsequent steps of Recipe 1 should be performed under sterile conditions in a laminar flow hood. When pharmacological treatments are required, such as the addition of selective antibiotics or DEX for induction, compounds are added at this stage to avoid heat-induced degradation. Using a sterile 50 mL Falcon tube, dispense exactly 40 or 25 mL of medium into the bottom halves of square or round plates, respectively (see Laboratory supplies). Allow plates to solidify for 15 min before covering with lids. Solidified plates are stored inverted (bottoms facing upward) in sealed plastic bags at 4 °C for up to two months.
2. Seed sterilization solution
| Reagent | Final concentration | Quantity or volume |
|---|---|---|
| 12.5% sodium hypochlorite | 1.25% | 5 mL |
| Tween 20 | n/a | 20 μL (approx. 2 drops) |
| MQ-H2O | top up to 50 mL |
Triton X-100 (same quantity) is an alternative to Tween 20.
Invert the Falcon tube several times to ensure thorough mixing; the formation of bubbles indicates proper preparation. The final solution should emit a characteristic chlorine-like odor reminiscent of public swimming pools. Store the solution at 4 °C and use within three months.
3. Sample holders and 1% agarose sandwiches for microscopy
Immediately before imaging, prepare the sample holders, have the seedlings ready for transfer, and prepare 1% agarose sandwiches to provide a stable and moist environment for the seedlings (Figure 1A–C). To prepare the agarose sandwiches, melt 1% (w/v) agarose in either MQ-H2O or liquid 1/2 MS medium. Place a 10 × 10 cm sheet of Parafilm flat on the bench and arrange individual 9 mm round cover slips on its surface (see Laboratory supplies and section B). Pipette 50–100 μL of the hot agarose onto one coverslip and place a second coverslip immediately on top, starting with the second coverslip at a 45º angle to spread the agarose evenly; slowly lower to avoid air bubbles, forming a thin, even agarose layer. Prepare additional agarose sandwiches in the same way while allowing previously assembled ones to cool and solidify.
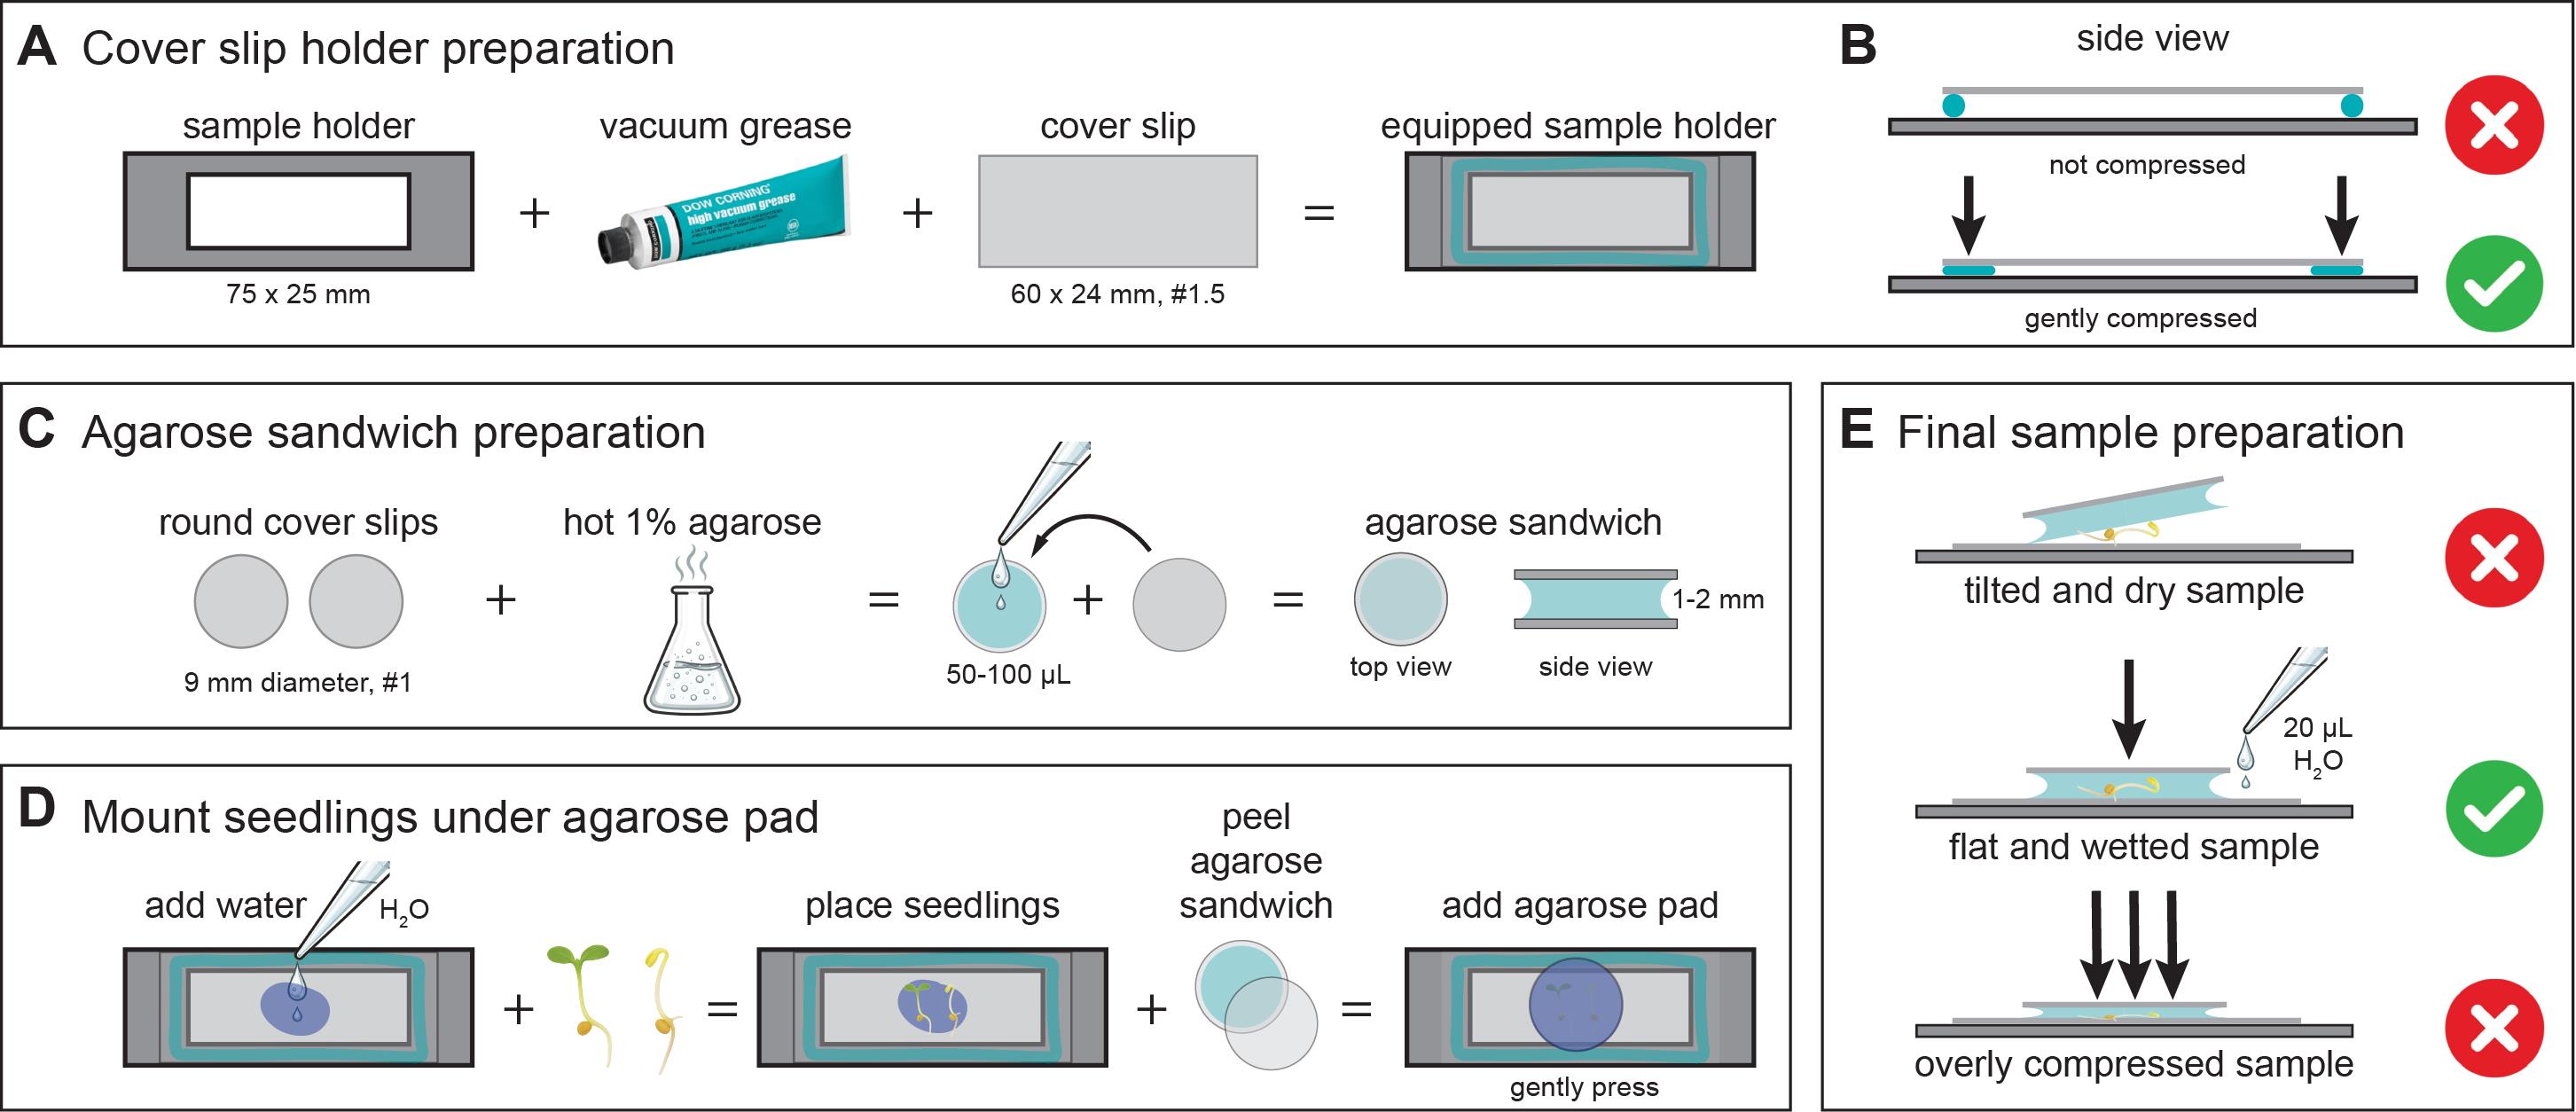
Figure 1. Preparation of correctly mounted Arabidopsis seedlings for live-cell imaging. This figure illustrates key steps for preparing stable and reproducible samples for live-cell imaging of cellulose synthase complexes. (A) Schematic showing a custom-made 75 × 25 mm microscope sample holder containing a central rectangular opening to allow optical access from below. The holder is coated with a thin layer of vacuum grease (turquoise outline), onto which a 60 × 24 mm #1.5 coverslip is mounted. Mounting seals the opening and provides a flat, stable support surface for imaging. (B) The coverslip-equipped sample holder is gently pressed to ensure firm and even adhesion of the coverslip to the holder. (C) Preparation of agarose sandwiches using two 9 mm round coverslips and molten 1% agarose. Approximately 50–100 μL of hot agarose is pipetted onto one coverslip, and the second coverslip is carefully placed on top, resulting in a solidified agarose layer of ~1–2 mm thickness between the coverslips. (D) Mounting of seedlings for imaging. Small droplets of water are placed onto the large coverslip, and seedlings are transferred onto the droplets. One coverslip is peeled off from the agarose sandwich to generate an agarose pad, which is then placed agarose-side down onto the seedlings. Residual water spreads evenly beneath the pad, forming a stable and hydrated mounting environment. (E) Common mounting errors and optimal conditions: (top) an overly dry agarose pad can tilt and mechanically stress the seedlings. (middle) This can be corrected by adding ~20 μL of water beneath the pad to achieve uniform hydration and a flat sample orientation; gentle pressure is applied only to ensure contact between the pad, liquid, and coverslip. (bottom) Excessive compression must be avoided, as it can damage both the agarose pad and the seedlings.
Laboratory supplies
1. 50 mL Falcon tubes (Roth, catalog number: AYY5.1)
2. 2 mL microcentrifuge tubes (Roth, catalog number: 5913.1)
3. 12 cm square plates (Greiner Bio-One, catalog number: 688102)
4. 9 cm round Petri dishes (Roth, catalog number: N221.2)
5. 12-well plates (Roth, catalog number: EKX6.1)
6. 9 mm round coverslips, #1 (Thermo Fisher Scientific, catalog number: 10313573)
7. 60 × 24 mm square coverslips, #1.5) (Roth, catalog number: KCY5.1)
8. Parafilm (Roth, catalog number: CNP8.1)
9. Micropore tape (1.25 cm width) (Duchefa Biochemie, catalog number: L3302)
10. ROTILAB® aluminum foil (Roth, catalog number: 2596.1)
11. Molykote high-vacuum silicone grease (Sigma, catalog number: Z273554-1EA)
Equipment
1. Fine balance (Sartorius, model: Quintix64-1S)
2. pH meter (inoLab®, model: pH 7110)
3. Magnetic stirrer (Yellow Line, model: MSH basic)
4. Orbital shaker for microcentrifuge tubes (Eppendorf, model: Thermomixer comfort)
5. Autoclave (Systec, model: VX-150)
6. Benchtop centrifuge (ROTILABO®, model: Mini centrifuge)
7. Sterile hood or clean bench (Thermo Fisher Scientific, model: MSC-Advantage)
8. Microwave oven (Sharp, model: R941)
9. Milli-Q water purification system (MERCK, model: Elix Essential 10)
10. Tilting apparatus (Lauda, model: Varioshake VS 15 R)
Software and datasets
Note: All software listed below is free to use and open source unless otherwise noted. Version numbers and release dates correspond to the versions used to develop and validate this protocol.
1. Fiji software (ImageJ2 distribution), v2.14.0 (released 2023/11/15) [34]. Free, open source (GPL license). Used for image processing, background subtraction, drift correction, and kymograph generation. Download at https://imagej.net/software/fiji/downloads
2. ThunderSTORM plugin, v1.3 (released 2014) [35]. Free, open source (GPL license). Used for spot detection and sub-pixel localization of CSC foci. Download at https://github.com/zitmen/thunderstorm
3. Smooth Manifold Projection Tool, v1.0 (released 2022). Free, open source (MIT license). Used for surface-projection of z-stack recordings to isolate plasma-membrane-localized signals. Download at https://github.com/DrReneSchneider/Smooth-Manifold-Projection-Tool
4. MultiStackReg plugin, v1.45 (released 2020) [36]. Free, open source. Used for x–y drift correction of time-lapse recordings. Download at https://github.com/miura/MultiStackRegistration
5. Bleach Correction plugin (Fiji core plugin, v1.52, released 2018) [37]. Free, open source. Used to compensate for photobleaching using histogram matching. Included with Fiji; documentation at https://imagej.net/plugins/bleach-correction
6. Velocity Measurement Tool, mod2025 version. Free, open source. Fiji macro modified by the authors to allow sequential measurements in a continuously expanding results table. The Velocity Measurement Tool (mod2025) is provided as Supplementary Dataset S1. Original references: Volker Baecker (INSERM, Montpellier RIO Imaging), J. Rietdorf (FMI Basel), A. Seitz (EMBL Heidelberg). Distributed as Supplementary Material in this manuscript.
7. FIESTA tracking software, v1.05.0005 (released 2021) [38]. Free, open source (MATLAB-based). Used as an alternative tool for automated particle tracking and high-throughput kymograph analysis. Requires a MATLAB license to run the source code; compiled macOS and Windows executables are free to use. Download at https://github.com/fiesta-tud/FIESTA/wiki
Procedure
文章信息
稿件历史记录
提交日期: Dec 17, 2025
接收日期: Feb 5, 2026
在线发布日期: Feb 26, 2026
出版日期: Mar 20, 2026
版权信息
© 2026 The Author(s); This is an open access article under the CC BY-NC license (https://creativecommons.org/licenses/by-nc/4.0/).
如何引用
Readers should cite both the Bio-protocol article and the original research article where this protocol was used:
- Xue, J. Y., Mansfield, S. D., Samuels, A. L., Sampathkumar, A. and Schneider, R. (2026). A Guide to Reproducible Cellulose Synthase Density and Speed Measurements in Arabidopsis thaliana. Bio-protocol 16(6): e5634. DOI: 10.21769/BioProtoc.5634.
- Xue, J. Y., McNair, G., Watanabe, Y., Kaplen, M. V., Guevara-Rozo, S., Schuetz, M., Schneider, R., Mansfield, S. D. and Samuels, A. L. (2024). COBRA-LIKE4 modulates cellulose synthase velocity and facilitates cellulose deposition in the secondary cell wall. Plant Physiol. 196(4): 2531–48. https://doi.org/10.1093/plphys/kiae469
分类
植物科学 > 植物细胞生物学 > 细胞成像
细胞生物学 > 细胞成像
您对这篇实验方法有问题吗?
在此处发布您的问题,我们将邀请本文作者来回答。同时,我们会将您的问题发布到Bio-protocol Exchange,以便寻求社区成员的帮助。