

Machine Learning-Assisted Quantification of Organelle Abundance
基于机器学习的细胞器丰度定量分析方法
(§Technical contact: A.J.Long@soton.ac.uk) 发布: 2026年03月05日第16卷第5期 DOI: 10.21769/BioProtoc.5626 浏览次数: 79
评审: Akira KarasawaAnonymous reviewer(s)


Abstract
Organelle abundance is a key microscopic readout of organelle formation and, in many cases, function. Quantification of organelle abundance using confocal microscopy requires estimating their area based on the fluorescence intensity of compartment-specific markers. This analysis usually depends on a user-defined intensity threshold to distinguish organelle regions from the surrounding cytoplasm, which introduces potential bias and variability. To address this issue, we present a machine learning–assisted algorithm that allows for the quantification of organelle density using the open-source Fiji platform and WEKA segmentation. Our method enables the automated quantification of organelle number, area, and density by learning from training data. This standardizes threshold selection and minimizes user intervention. We demonstrate the utility of this approach for both membrane and non-membrane organelles, such as peroxisomes, lipid droplets, and stress granules, in human cells and whole fish samples.
Key features
• The organelle abundance algorithm is an automated, open-source, Fiji-based tool that extracts organelle number and area and calculates abundance based on a single marker.
• The macro measures the average intensity of all the segmented areas and quantifies their area.
• The algorithm is applicable to cellular compartments, including membrane-bound and membrane-less organelles.
• The training is performed on a sample dataset, enabling the algorithm to be applied to all images obtained with the same imaging parameters.
Keywords: Organelle (细胞器)Graphical overview
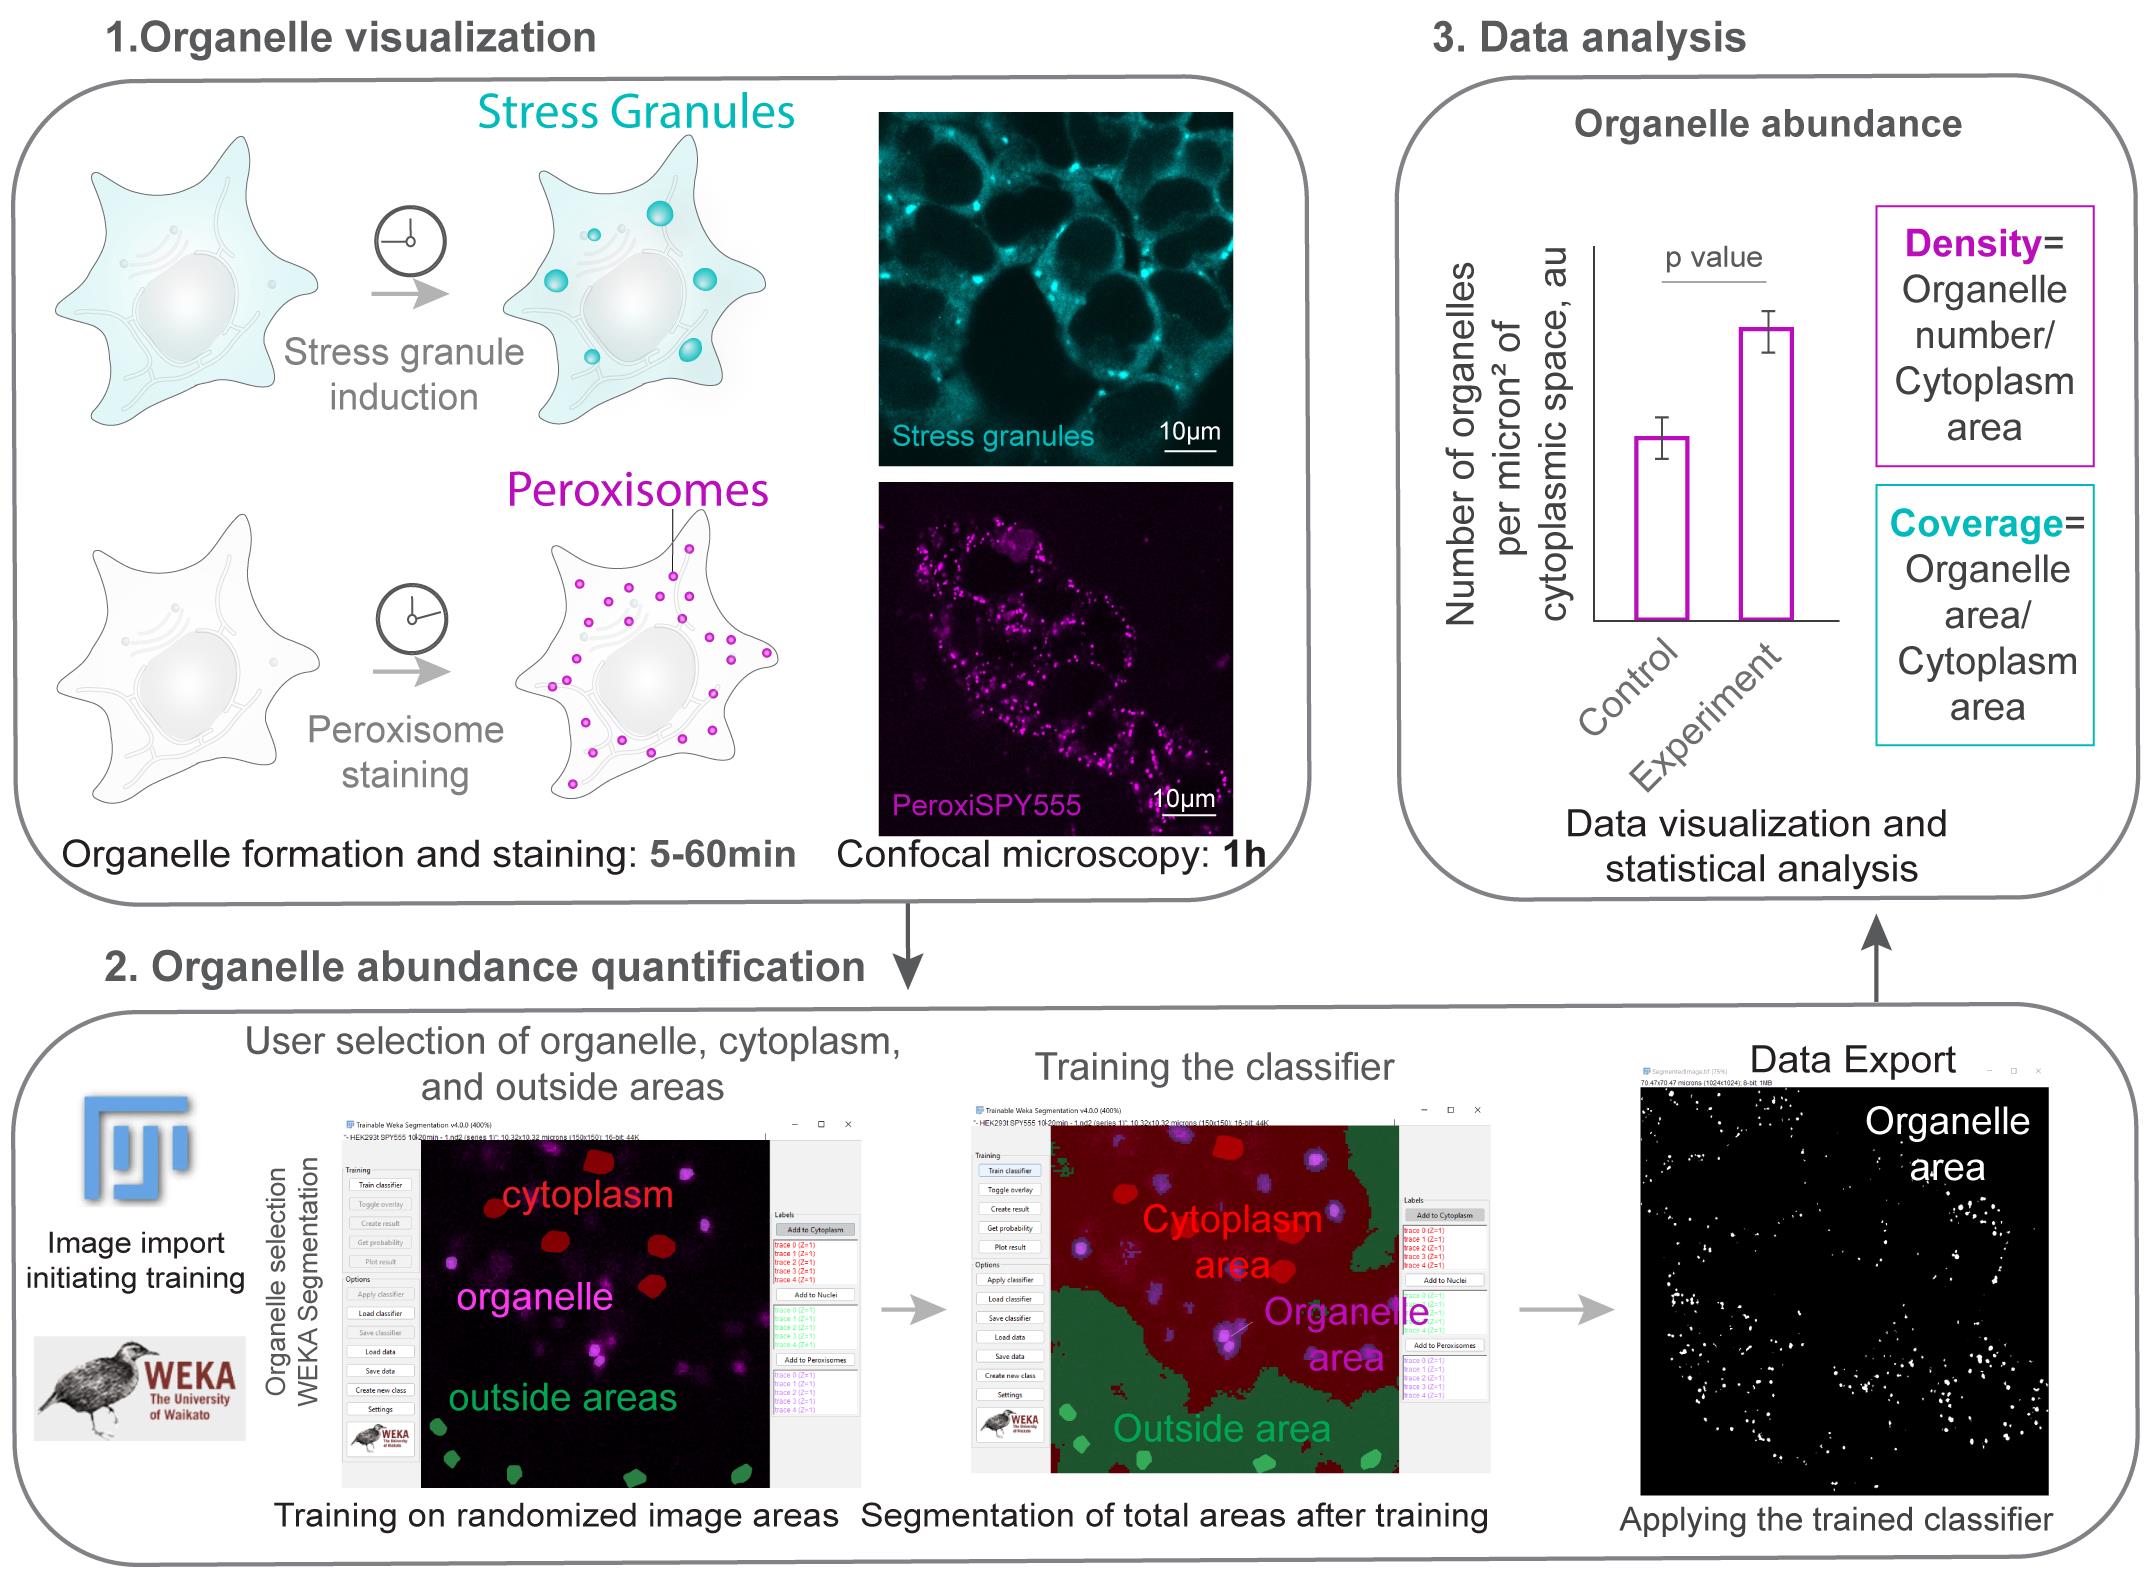
Graphical overview. Section 1 (organelle visualization) corresponds to section A in the procedure. Section 2 (organelle abundance quantification) corresponds to section B in the procedure. Section 3 (data analysis) takes place after the procedure.
Background
Quantifying organelle abundance by determining how many organelles are present in the cell and the area of the cytoplasm they cover provides a useful measure of organelle dynamics and offers insight into organelle function. For example, stress granules are membrane-less organelles that form from stalled translation pre-initiation complexes and other proteins in response to stress [1–3], with their functional roles emerging upon their assembly in the cytoplasm. Similarly, peroxisomes are membrane-enclosed organelles that are essential for lipid and oxidative metabolism [4–6]. They undergo division and increase in number when their metabolic activity is required. In both cases, quantifying organelle density in the cytoplasm correlates with organelle function in healthy cells.
Organelle abundance can be estimated from confocal imaging by visualizing resident proteins or established organelle markers [7]. An organelle marker is any fluorescently labeled molecule that localizes to an organelle. Examples include overexpressing a fluorescent protein fused to an organelle localization signal or an endogenously tagged protein. Examples of endogenously tagged proteins include the CRISPR/Cas9 genomic fusion of polyA-binding protein PABPC1 to Dendra2, which is used as a marker of stress granules [8], and ATP-binding cassette sub-family D member 3 (ABCD3) fused to GFP as a marker of peroxisomes [9]. Other examples include using a fluorescent probe that selectively targets the organelle, such as PeroxiSPY, which is used to label peroxisomes [10], or using antibody staining of organelles post-fixation [9]. The quantification requires segmentation, or defining the boundaries of compartments, which is often based on visual inspection. Manual segmentation is prone to error; for example, it is difficult to consistently outline highly variable, punctate, or overlapping patterns. To improve the reliability of quantification, thresholding methods set an intensity value independent of the user, improving consistency [11]. Machine learning approaches further reduce manual segmentation errors by providing consistent labeling based on user-defined parameters [12–14].
Here, we present a protocol for quantifying the abundance of membrane and membrane-less organelles based on a single marker using Fiji software [15,16]. This protocol combines the WEKA Segmentation [12] and watershed algorithms into a user-friendly workflow. The quantification is based on trainable organelle recognition, which limits user-defined thresholding bias and improves the consistency of image processing [14,17,18]. Recognition requires reliably outlining organelles for initial training, a task that can be done by experienced researchers. The trained classifier can then be applied to any number of images obtained with the same microscopy settings. Alternatively, a beginning researcher can train the classifier and include controls to verify whether the recognized area corresponds to an organelle area.
As a proof-of-concept, we validate that machine learning–assisted recognition of cellular compartments corresponds to an independent marker of cellular cytoplasmic and peroxisome areas using a control marker for both the organelle and the cytoplasm. In many experimental setups, adding additional markers is not feasible, and manually extracting the cytoplasmic area from a single organelle marker is biased and time-consuming. Our results demonstrate that machine learning assistance enables the consistent and reliable identification of these regions. Finally, we apply the macro to quantify the non-membrane compartment density of stress granules using a CRISPR/Cas9-tagged PABPC1 cell line [19]. The algorithm recognizes conditions in which there are no stress granule compartments and extracts areas based on a single marker.
This protocol can be modified further to estimate organelle coverage and the area of the cell occupied by the cytoplasm, or to extract abundance in 3D using stacks of 2D images obtained from tissues. This provides a useful tool for quantitative cell biology experiments.
Materials and reagents
Biological materials
Cell lines and organisms used in this study:
1. Human embryonic kidney cells HEK293T (ATCC® CRL-3216TM)
2. HEK293T PABPC1-DDR2 cell line [8]
3. Zebrafish Danio rerio
Reagents
1. PeroxiSPY555 (Spirochrome, catalog or CAS number: SC207: Peroxi_SPY555); store 1 mM stock in DMSO at -20 °C long-term; aliquots can be stored at 4 °C
2. Sodium arsenite (Thermo Fisher Scientific, catalog or CAS number: 7784-46-5)
3. Immersion liquid (Cargille, catalog or CAS number: 16482)
4. Penicillin/Streptomycin for cell culture (Pan Biotech, catalog or CAS number: P06-07050)
5. Dulbecco’s modified Eagle’s medium (DMEM) cell culture media with 10% fetal bovine serum (FBS) (Pan Biotech, catalog or CAS number: P30-3031, P04-03590)
6. DMSO (Invitrogen, catalog number: D12345)
Solutions
1. 200 μM sodium arsenite in media (see Recipes)
2. 1 μM PeroxiSPY in DMEM (see Recipes)
Recipes
1. 200 μM sodium arsenite in media
To dissolve in tissue culture medium, add 2 μL of the 100 mM stock in water to 1 mL of medium. Mix by vortex mixing or pipetting before adding to the cells.
2. 1 μM PeroxiSPY in DMEM
To dissolve PeroxiSPY in media, add 1 μL of the 1 mM stock to an Eppendorf tube, then add 1 mL of DMEM. Mix by vortex mixing or pipetting before adding to the cells.
Laboratory supplies
1. 4-chamber glass bottom plates (CellVis, catalog number: D35C4200N), cover glass (0.13–0.16 mm), used for confocal imaging
2. Tissue culture 10 cm plates (Sigma) used for cell culture
Note: Plastic plate thickness will not allow confocal imaging at 60×; however, larger organelles can be imaged through plastic plates at a lower magnification, e.g., 20×, e.g., for nuclei segmentation.
Equipment
1. Confocal microscope (Nikon, model: A1r), equipped with a CFI Plan Apo Lambda 60× oil NA 1.42 objective
2. Spinning disk microscope (Nikon, model: W1), equipped with a CFI Plan Apochromat Lambda S 60XC Sil objective
3. CO2 chamber and temperature control unit (OKO Lab, model: CO2-O2 Unit-BL)
4. CO2 incubator for cell culture (Thermo Fisher Scientific, model: Steri-Cycle CO2 incubator: 370)
5. Eppendorf tubes
Software and datasets
1. Example dataset, 01.12.2025, free: Supplementary Dataset S1
2. Fiji software (or ImageJ), Java 21.0.7 (64-bit), 01.12.2025, free [15,16]
3. NIS Nikon software, 4.1, paid (microscope software)
4. Macro (organelle abundance algorithm), resource, 1.0, 01.12.2025, free: Supplementary Code S1
Procedure
文章信息
稿件历史记录
提交日期: Dec 7, 2025
接收日期: Jan 28, 2026
在线发布日期: Feb 12, 2026
出版日期: Mar 5, 2026
版权信息
© 2026 The Author(s); This is an open access article under the CC BY-NC license (https://creativecommons.org/licenses/by-nc/4.0/).
如何引用
Readers should cite both the Bio-protocol article and the original research article where this protocol was used:
- Long, A. J., Candeias, D., Coveña, N. F., Reymond, L., Schuhmacher, M., Kemp, S., Hamilton, N. and Amen, T. (2026). Machine Learning-Assisted Quantification of Organelle Abundance. Bio-protocol 16(5): e5626. DOI: 10.21769/BioProtoc.5626.
- Borisyuk, A., Howman, C., Pattabiraman, S., Kaganovich, D. and Amen, T. (2025). Protein Kinase C promotes peroxisome biogenesis and peroxisome–endoplasmic reticulum interaction. J Cell Biol. 224(9): e202505040. https://doi.org/10.1083/jcb.202505040
您对这篇实验方法有问题吗?
在此处发布您的问题,我们将邀请本文作者来回答。同时,我们会将您的问题发布到Bio-protocol Exchange,以便寻求社区成员的帮助。