

A Quantitative DNA Fiber Assay to Monitor Replication Fork Progression, Protection, and Restart
用于监测复制叉推进、保护与重启的定量 DNA 纤维分析方法
发布: 2026年02月05日第16卷第3期 DOI: 10.21769/BioProtoc.5593 浏览次数: 227
评审: Elena A. OstrakhovitchAnonymous reviewer(s)
参见作者原研究论文
The authors used this protocol in:
Jun 2025


Abstract
Our genome is duplicated during every round of cell division through the process of DNA replication, but this fundamental process is subjected to various stresses arising from endogenous or exogenous sources. Thus, studying replication dynamics is crucial for understanding the mechanisms underlying genome duplication in physiological and replication stress conditions. Earlier, radioisotope-based autoradiography and density-labeling methods were used to study replication dynamics, which were limited in spatial resolution, representing only average estimates from many DNA samples. Here, we describe a DNA fiber assay that utilizes different thymidine analog incorporation, like 5-chloro-2’-deoxyuridine (CldU) and 5-iodo-2’-deoxyuridine (IdU), into replicating DNA. Such labeled DNA can be stretched and fixed on silanized glass slides, which are denatured with mild acidic treatment to expose the labeled nascent DNA. This DNA can then be visualized by using primary antibodies against CldU and IdU, followed by fluorophore-conjugated secondary antibodies, and observing them using a fluorescence microscope. The DNA fiber assay allows the visualization of individually replicating DNA at a single-molecular resolution and is highly quantitative, high-throughput, and easily reproducible. This technique offers insights into different replication parameters, like rate of DNA synthesis, extent of reversed fork protection, restart of stalled forks, and fork asymmetry under untreated or replication stress conditions at a single-molecule level.
Key features
• Single-molecule resolution of DNA replication dynamics.
• Diverse replication parameters can be quantified with variations of the labeling protocol.
• Easily reproducible across different cell lines in any lab with a basic molecular biology setup.
• Effective in studying the effects of different genotoxic treatments on replication.
Keywords: Replication (NA 复制)Graphical overview
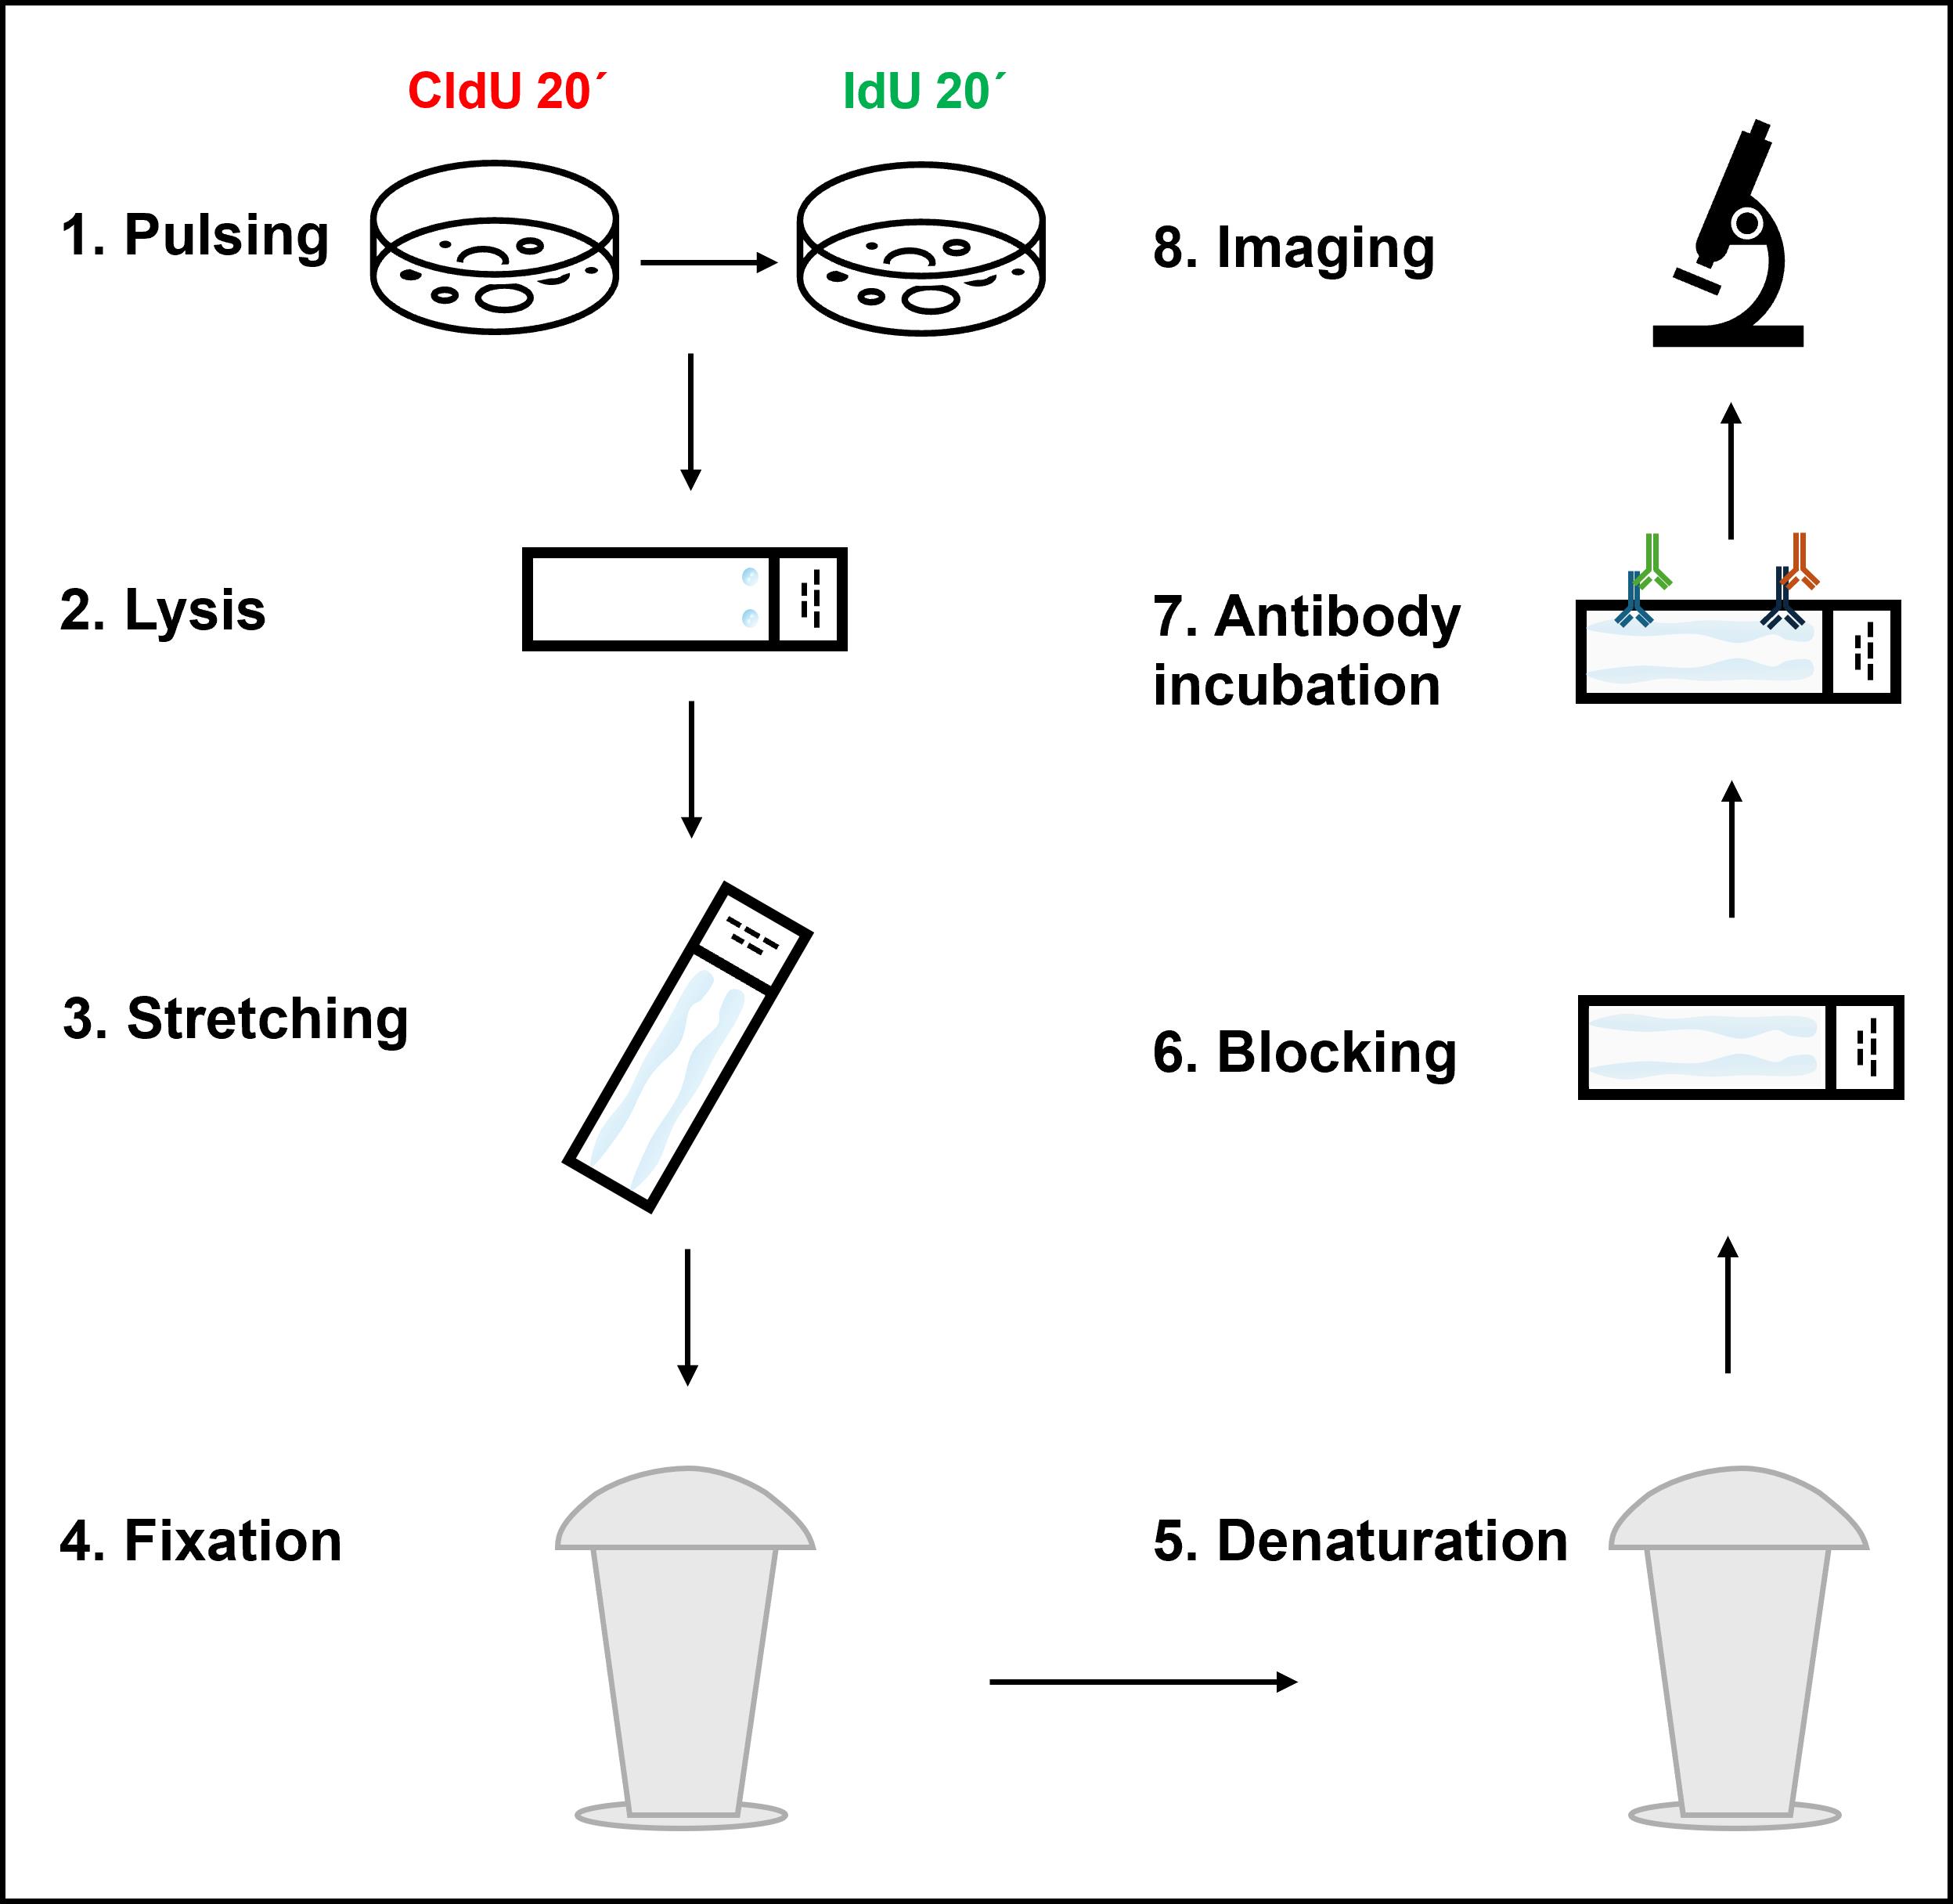
Graphical overview depicting the key steps of the DNA fiber assay protocol
Background
Faithful DNA replication is fundamental to the maintenance of genome integrity. During each S phase of the cell cycle, replication forks duplicate the entire genome through coordinated synthesis of leading and lagging strands. However, replication forks frequently encounter obstacles such as DNA lesions, DNA-protein crosslinks, secondary DNA structures, unscheduled R-loops, and repetitive DNA sequences that can deregulate replication speed and cause fork stalling or collapse. Cells have evolved different replication stress response mechanisms to protect stalled forks, prevent nascent DNA degradation, and ensure efficient fork restart once the stress is relieved. Understanding these dynamic replication responses requires experimental tools that can visualize and quantify replication forks with high spatial and temporal resolution [1–4]. Earlier methods to study DNA replication dynamics largely relied on population-level labeling approaches. Autoradiography using tritiated thymidine incorporation provided the first visualization of replicating DNA in eukaryotic cells but offered limited spatial resolution and required long exposure times [5,6]. Subsequently, 5-bromo-2’-deoxyuridine (BrdU) incorporation combined with immunofluorescence was widely used to mark replication foci and to determine the fraction of cells undergoing replication, but it could not resolve individual replication tracts [7,8]. Similarly, bulk density labeling or alkaline sucrose gradient sedimentation techniques provided only average replication rates without single-molecule resolution [9]. Electron microscopy (EM) is the only method that allows direct visualization of replication intermediates, but it is technically demanding, requires large amounts of purified DNA, and has limited throughput [10,11].
The DNA fiber assay was developed to overcome these limitations [12]. In this method, cells are sequentially pulse-labeled with halogenated nucleoside analogs such as 5-chloro-2’-deoxyuridine (CldU) and 5-iodo-2’-deoxyuridine (IdU), which incorporate into newly synthesized DNA during replication. The pulse-labeling scheme can be combined with the treatment of replication stress–inducing agents to study the effects of different genotoxic agents on replication. The cells are then harvested, lysed, and stretched on glass slides to expose the labeled DNA, and immunostained with antibodies specific to each thymidine analog, producing red and green fluorescent tracts corresponding to the first and second labeling periods, respectively. The tract lengths can subsequently be measured and used as a quantitative readout of different replication parameters like fork speed, stalling, or degradation, depending on the labeling scheme. The DNA fiber assay is highly versatile (Figure 1). Under unperturbed conditions, consecutive double labeling of cells with CldU and IdU for 20–30 min each, followed by measuring either CldU or IdU tract length, allows the estimation of replication fork speed (kb/min), which typically averages around 1 kb/min in mammalian cell lines. Shorter replication tract lengths indicate frequent fork stalling events, whereas an extended fiber length indicates unrestrained DNA replication [13,14]. Combining the second labeling pulse with a low dose of genotoxic agents enables measurement of fork stalling induced by specific replication barriers, e.g., low doses of camptothecin (CPT, 50–100 nM) as markers for R-loop induced fork stalling [15]. Sister-fork asymmetry, calculated as the ratio of the two sister-fork tract lengths extending from a common origin (green-red-green tracts), serves as another indicator of fork stalling. Fork asymmetry is measured by calculating the lengths of two green tracts on either side of an origin (red tract) and taking the ratio of the longer tract to the shorter one or vice-versa. Symmetric forks have a sister fork ratio close to 1, whereas asymmetric forks have a ratio </> 1; thus, the sister fork ratio can serve as an estimate of fork progression vs. stalling.
Fork reversal is a global response to replication stress, and reversed forks are susceptible to fork degradation. The fork protection assay is useful for studying the extent of fork protection and as a surrogate marker for fork reversal under replication stress [16,17]. In this assay, after the CldU and IdU pulses, cells are subjected to a prolonged period of hydroxyurea (HU) treatment (2–4 mM for 5 h). In the absence of fork protection, the second label is gradually degraded, resulting in shorter IdU tracts compared to CldU tracts. The extent of fork protection is then calculated using IdU to CldU ratios, where a ratio close to 1 indicates efficient fork protection and a ratio less than 1 indicates fork degradation. In a recent study, a variation of this assay has been used as a surrogate marker for fork reversal in cells, where replication stress (e.g., 150 nM CPT) during the second pulse slowed fork progression, reducing the CldU/IdU ratio, which is indicative of fork reversal in cells [18].
Reversed replication forks are restarted by homologous recombination (HR)-based or repriming-based restart mechanisms once the replication stress is alleviated [1,19]. The fork restart assay can be used to quantify the percentage of stalled and restarted replication forks, as well as the replication speed after fork restart. In this assay, typically, the first pulse (CldU, 20 min) is followed by 2 mM HU treatment for 2 h to stall the forks, and then the second pulse (IdU, 40 min) is given, during which fork restart occurs. Only red tracts or red followed by very short green tracts are considered to be stalled forks, whereas red tracts followed by longer green tracts are counted as restarted forks. New origin-firing events can also be quantified in this assay by measuring only green tracts, which represent origins fired during the second pulse duration. The percentage of stalled forks is calculated as red tracts/(red + red-green tracts) × 100, and restarted forks are calculated as 100 - percentage of stalled forks [20].
Replication stress is often associated with the formation of ssDNA gaps in the nascent DNA, which are termed as daughter-strand gaps (DSGs) [21]. These gaps can be scored by combining the S1 nuclease assay with the DNA fiber technique [12,22]. Here, cells are sequentially pulse-labeled and subjected to replication stress, followed by permeabilization of the cells with CSK buffer (10 min) and a 30 min incubation with S1 nuclease (20 U/mL) enzyme [23]. The S1 nuclease nicks the DNA strand opposite to the ssDNA gaps, creating double-strand breaks (DSBs). This results in shorter IdU tract lengths and reduced IdU/CldU ratios, which serve as a quantitative marker for DSGs. Overall, employing the different labeling schemes, the DNA fiber assay can be easily combined with specific gene knockdowns or inhibitor treatments to mechanistically dissect molecular pathways of fork protection and replication stress responses [24,25].
Compared with earlier approaches, the major advantage of the DNA fiber assay is that it provides single-molecule resolution and direct quantitative measurement of fork dynamics. By tweaking the pulse-labeling scheme, different fork metabolisms like fork speed, fork asymmetry, fork protection/reversal, fork restart, and DSGs can be quantified, thus allowing accurate assessment of replication dynamics under different stress conditions. Additionally, the assay requires relatively simple equipment and can be performed in most cell lines. The method also enables statistical analysis of hundreds of replication events within a single experiment, making it a robust technique. However, it has certain limitations. The efficiency is dependent on the uniformity of fiber labeling and spreading. The procedure is low-throughput and labor-intensive compared to automated microscopy-based replication assays, as a minimum of 200–300 individual fibers must be manually measured in each experiment across biological replicates [26]. Artifacts from fiber overlapping or overstretching can also occur. Despite these caveats, the DNA fiber assay remains one of the most powerful and versatile methods for studying DNA replication and fork metabolism at the single-molecule level [13,27].
A derivative of the DNA fiber assay is the DNA combing technique, which uses molecular combing to uniformly stretch the DNA on silanized slides. DNA combing allows controlled, parallel alignment of individual DNA fibers at a constant extension factor (≈2 kb/μm) as compared to conventional DNA fiber spreading, in which DNA is randomly distributed and variably stretched. This uniform stretching improves precision and allows determination of inter-origin distances [28]. This technique can also be combined with fluorescence in situ hybridization (FISH) to study replication dynamics at specific genomic loci [29]. Although the method requires a constant-speed combing device, which is not readily available everywhere, and careful control of DNA quality to prevent breakage, DNA combing offers enhanced precision and reproducibility for single-molecule analysis of replication [30].
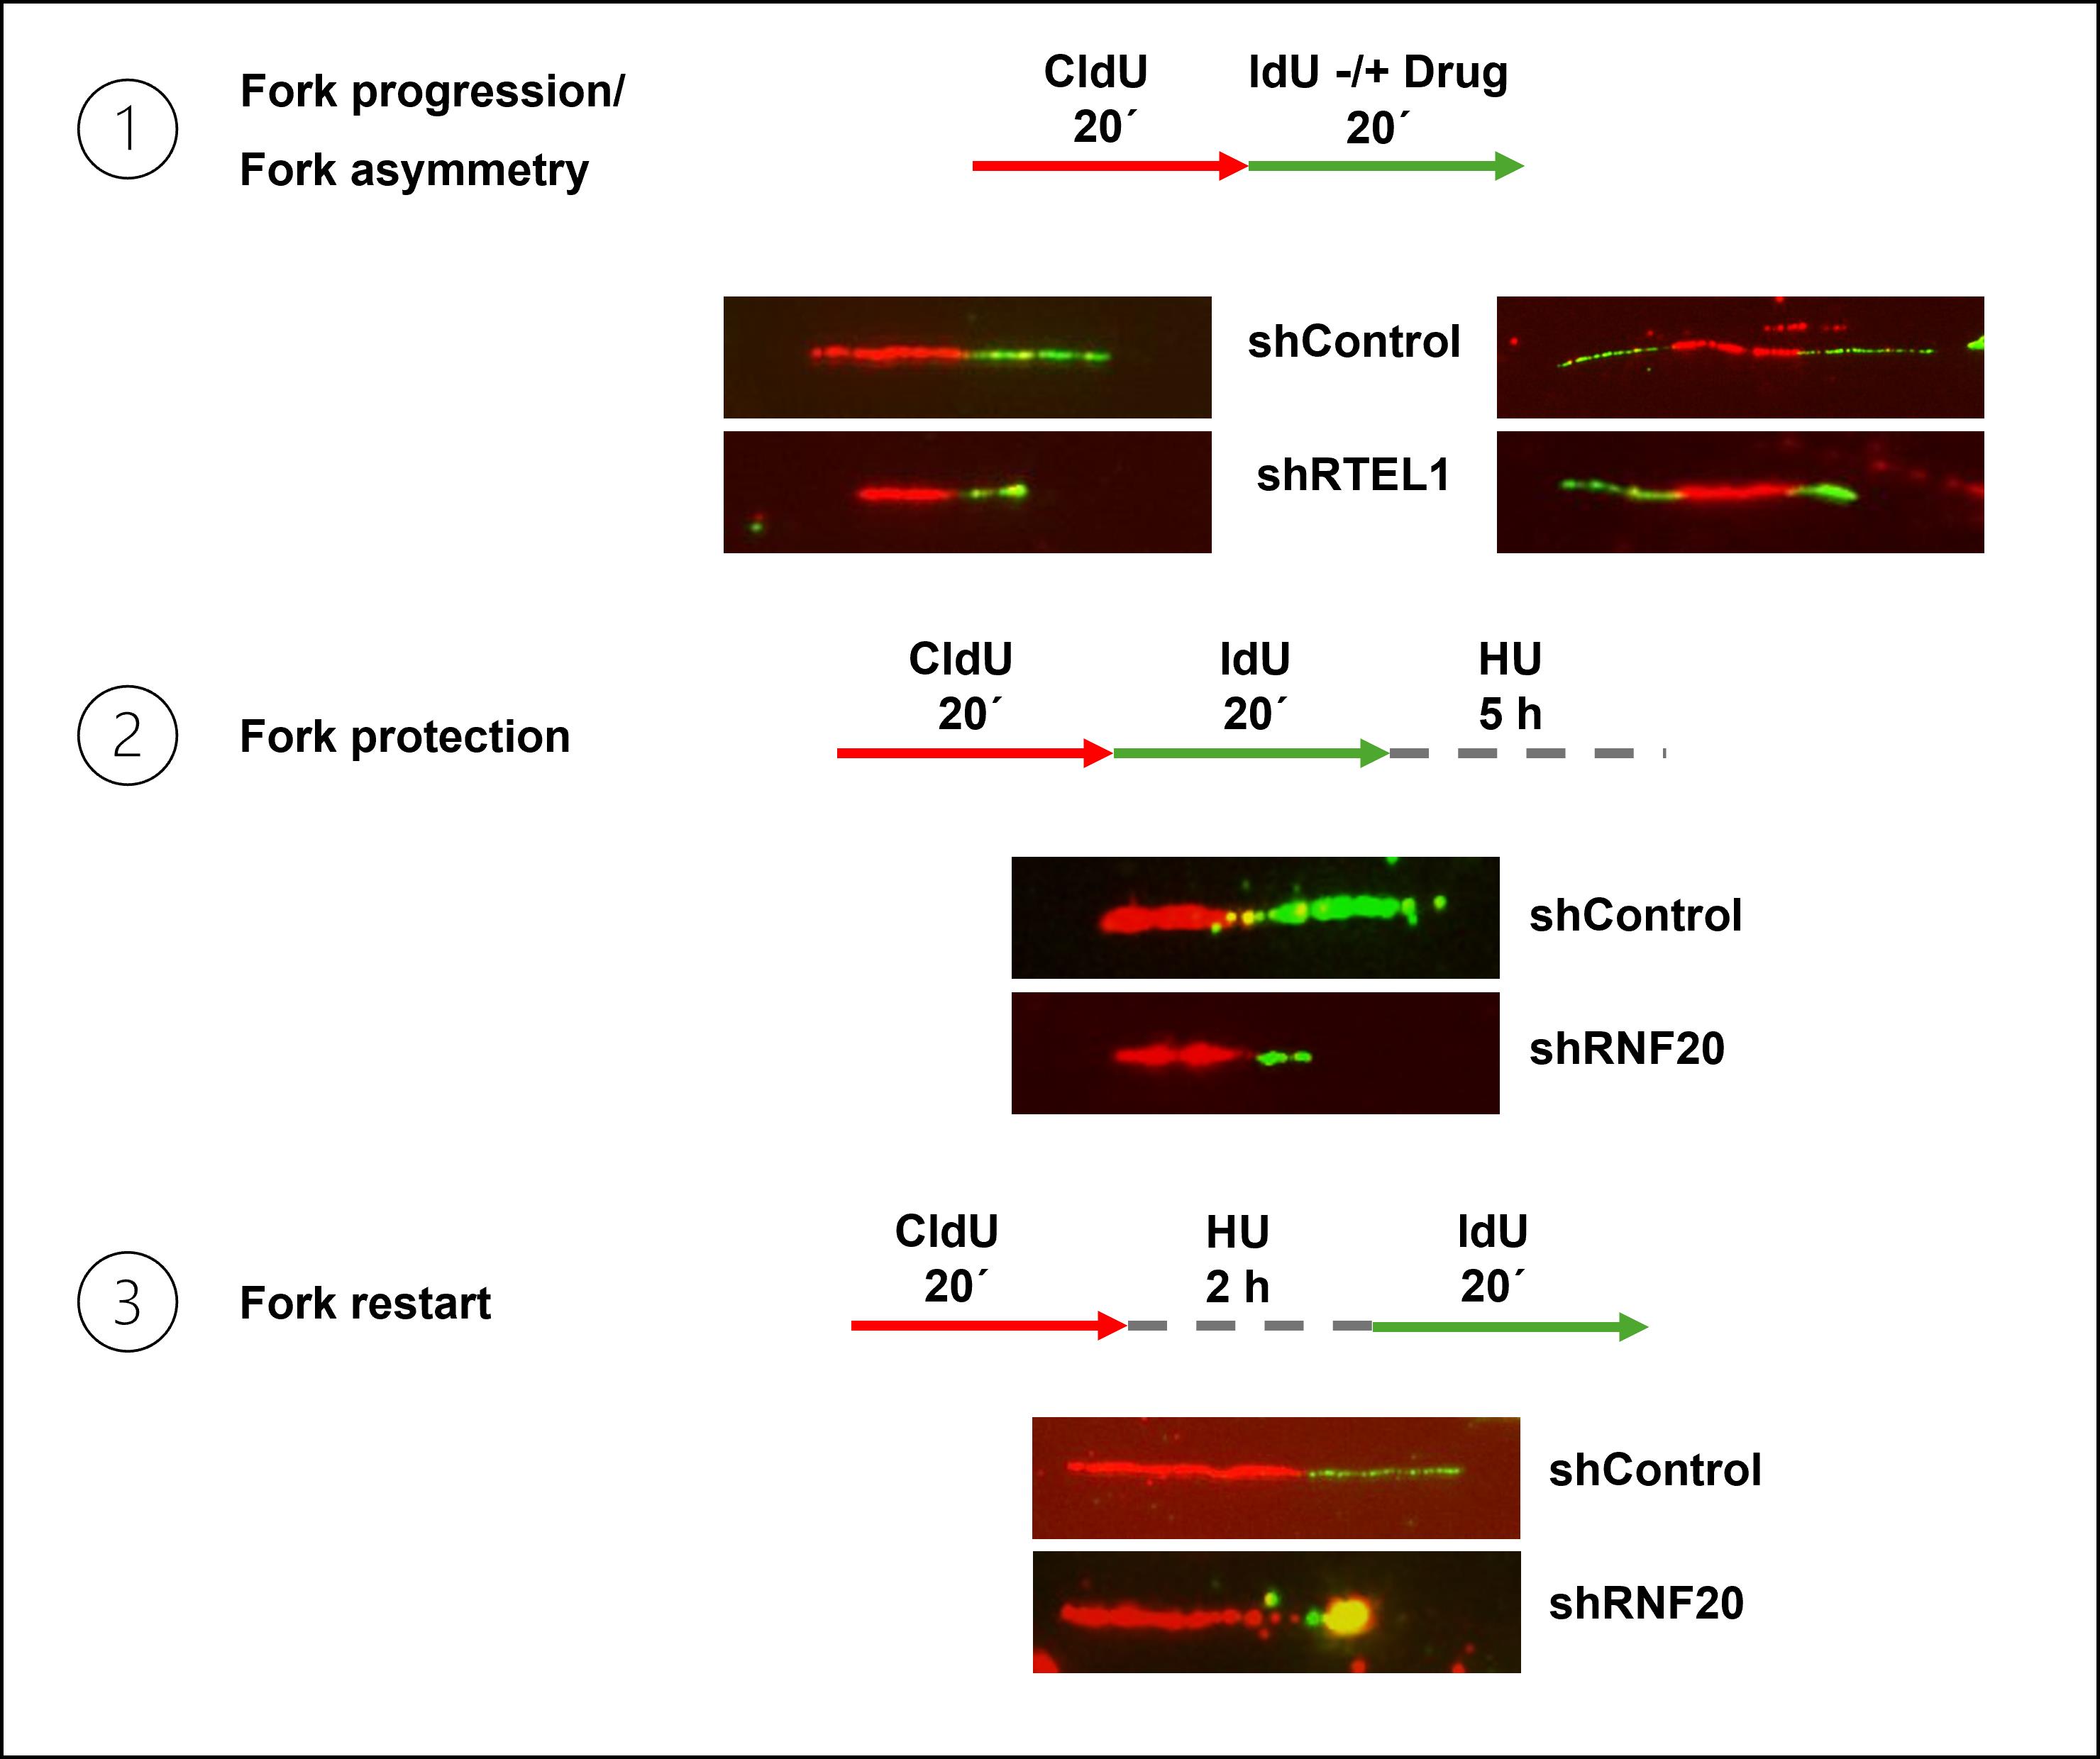
Figure 1. Representative images of different DNA fiber labeling schemes. 1: Schematic and representative fibers showing replication fork progression (left) and fork asymmetry (right) in control and RTEL1-depleted cells. 2: Schematic and representative fibers illustrating replication fork protection defect in RNF20-depleted cells compared with control cells. 3: Schematic and representative fibers from a fork restart assay demonstrating defective fork restart in RNF20-depleted cells relative to control.
Materials and reagents
Biological materials
1. U2OS cells (ATCC, catalog number: HTB-96; RRID:CVCL_0042)
Note: Cells were grown in DMEM medium supplemented with 10% FBS, 1% GlutaMax, and 1% PenStrep. Cells were regularly tested for mycoplasma with DAPI staining. Experiments were generally performed within 3rd–25th cell passages.
Reagents
1. 5-Chloro-2’-deoxyuridine (Sigma-Aldrich, catalog number: C6891)
2. 5-Iodo-2’-deoxyuridine (Sigma-Aldrich, catalog number: I7125)
3. Rat anti-BrdU (Abcam, catalog number: ab6326, RRID: AB_305426)
4. Purified mouse anti-BrdU (BD Biosciences, catalog number: 347580, RRID: AB_400326)
5. Donkey anti-rat Alexa Fluor 594 (Abcam, catalog number: ab150156, RRID: AB_2890252)
6. Rabbit anti-mouse IgG H&L Alexa Fluor 488 (Abcam, catalog number: ab150125)
7. Mowiol® 4-88 (Sigma-Aldrich, catalog number: 81381, CAS number: 9002-89-5)
8. Bovine serum albumin (BSA) (Sigma-Aldrich, catalog number: A7906, CAS number: 9048-46-8)
9. Hydroxyurea (Sigma-Aldrich, catalog number: H8627)
10. TWEEN® 20 (Sigma-Aldrich, catalog number: P1379)
11. Concentrated HCl (Qualigens, catalog number: Q29147)
12. Dimethyl sulphoxide (Sigma-Aldrich, catalog number: D8418)
13. Methanol (Sigma-Aldrich, catalog number: 6.06007, CAS number: 67-56-1)
14. Glacial acetic acid (Supelco, Merck, catalog number: 1.93002, CAS number: 64-19-7)
15. Trizma base (Sigma-Aldrich, catalog number: 93362)
16. Ethylenediaminetetraacetic acid (Sigma-Aldrich, catalog number: E6758)
17. Sodium dodecyl sulphate (Sigma-Aldrich, catalog number: 436143)
18. Trypsin-EDTA solution (Sigma-Aldrich, catalog number: T4174)
Solutions
1. Lysis buffer (see Recipes)
2. Blocking buffer (see Recipes)
3. Wash buffer (see Recipes)
4. CldU stock (see Recipes)
5. IdU stock (see Recipes)
6. Fixative (see Recipes)
7. HU stock (see Recipes)
Recipes
1. Lysis buffer
| Reagent | Final concentration | Quantity or volume |
|---|---|---|
| 1 M Tris-HCl (pH 7.5) | 0.2 M | 200 μL |
| 0.5 M EDTA (pH 8) | 0.05 M | 100 μL |
| 10% SDS | 0.5% | 50 μL |
| Autoclaved milli-Q water | n/a | 650 μL |
Filter-sterilize. It can be stored and used for a week at room temperature (RT).
2. Blocking buffer
| Reagent | Final concentration | Quantity or volume |
|---|---|---|
| BSA | 2% | 200 mg |
| Tween 20 | 0.1% | 10 μL |
| 1× PBS | n/a | up to 10 mL |
Filter-sterilize. It can be stored at 4 °C for 1–2 weeks.
3. Wash buffer
| Reagent | Final concentration | Quantity or volume |
|---|---|---|
| Tween 20 | 0.1% | 0.5 mL |
| 1× PBS | n/a | up to 500 mL |
It can be stored at RT for a few weeks.
4. CldU stock
| Reagent | Final concentration | Quantity or volume |
|---|---|---|
| CldU powder (262.65 g/mol) | 50 mM | 13.13 mg |
| Filter-sterilized, autoclaved milli-Q water | n/a | 1 mL |
Dissolve and store at -20 °C in 50 μL aliquots in the dark for up to 1 year, avoiding frequent freeze-thaw cycles.
5. IdU stock
| Reagent | Final concentration | Quantity or volume |
|---|---|---|
| IdU powder (354.1 g/mol) | 100 mM | 35.41 mg |
| Cell-culture grade DMSO | n/a | 1 mL |
Dissolve and store at -20 °C in 100 μL aliquots in the dark for up to 1 year, avoiding frequent freeze-thaw cycles.
6. Fixative
| Reagent | Final concentration | Quantity or volume |
|---|---|---|
| Methanol | 3 parts by volume | 37.5 mL |
| Glacial acetic acid | 1 part by volume | 12.5 mL |
Prepare fresh every time.
7. HU stock
| Reagent | Final concentration | Quantity or volume |
|---|---|---|
| Hydroxyurea powder | 200 mM | 15.212 mg |
| Filter-sterilized, autoclaved Milli-Q water | n/a | 1 mL |
Store at 4 °C for a couple of months in sealed aliquots.
Laboratory supplies
1. Superfrost slides (epredia/Fisher Scientific, catalog number: 16069901, Ref: AA00008032E01MNZ10)
2. Tissue culture 6-well plates (ThermoFisher, catalog number: 140675)
3. Cell counter or hemocytometer (ThermoFisher, model: Countess 3 Automated Cell Counter)
4. 1.5 mL microcentrifuge tubes (MCT) (Tarsons, catalog number: T500010)
5. 15/50 mL conical centrifuge tubes (Tarsons, catalog number: 546021/546041)
6. 15/50 mL centrifuge tube racks (Tarsons)
7. Coplin jars (local vendor)
8. 3-ply tissue paper (local vendor)
9. MCT rack (Tarsons, catalog number: 241010-B)
10. Whatman filter paper (GE Healthcare, catalog number: 1003-917)
11. Parafilm (PARAFILM, catalog number: 39209999)
12. Surface roller (local vendor)
13. Microscopic cover glass 24 × 60 mm (BLUE STAR)
14. 200–10,00 μL, 20–200 μL, 2–20 μL pipettes and pipette tips
Equipment
1. Fluorescence microscope (Zeiss AxioObserver)
2. Cell culture equipment, including CO2 incubator and biosafety chamber for culturing cells
Software and datasets
1. ImageJ (NIH, Version1.54p, Feb 2025, https://imagej.net/ij/download.htmL)
2. Microsoft Excel (Microsoft, https://products.office.com/en-us/excel)
3. GraphPad Prism (Version 9.5.1, graphpad.com/how-to-buy/)
Procedure
文章信息
稿件历史记录
提交日期: Oct 27, 2025
接收日期: Dec 25, 2025
在线发布日期: Jan 13, 2026
出版日期: Feb 5, 2026
版权信息
© 2026 The Author(s); This is an open access article under the CC BY-NC license (https://creativecommons.org/licenses/by-nc/4.0/).
如何引用
Bhattacharya, D. and Nagaraju, G. (2026). A Quantitative DNA Fiber Assay to Monitor Replication Fork Progression, Protection, and Restart. Bio-protocol 16(3): e5593. DOI: 10.21769/BioProtoc.5593.
分类
癌症生物学 > 基因组不稳定性及突变 > 细胞生物学试验 > DNA结构和改变
分子生物学 > DNA > DNA 损伤和修复
您对这篇实验方法有问题吗?
在此处发布您的问题,我们将邀请本文作者来回答。同时,我们会将您的问题发布到Bio-protocol Exchange,以便寻求社区成员的帮助。