

Biochemical Reconstitution and FRAP Analysis of Membrane-Associated Condensates on Supported Lipid Bilayers
基于支持型脂质双层的膜相关凝聚体生化重构及 FRAP 分析
发布: 2026年02月05日第16卷第3期 DOI: 10.21769/BioProtoc.5592 浏览次数: 192
评审: Anonymous reviewer(s)
参见作者原研究论文
The authors used this protocol in:
Sep 2025


Abstract
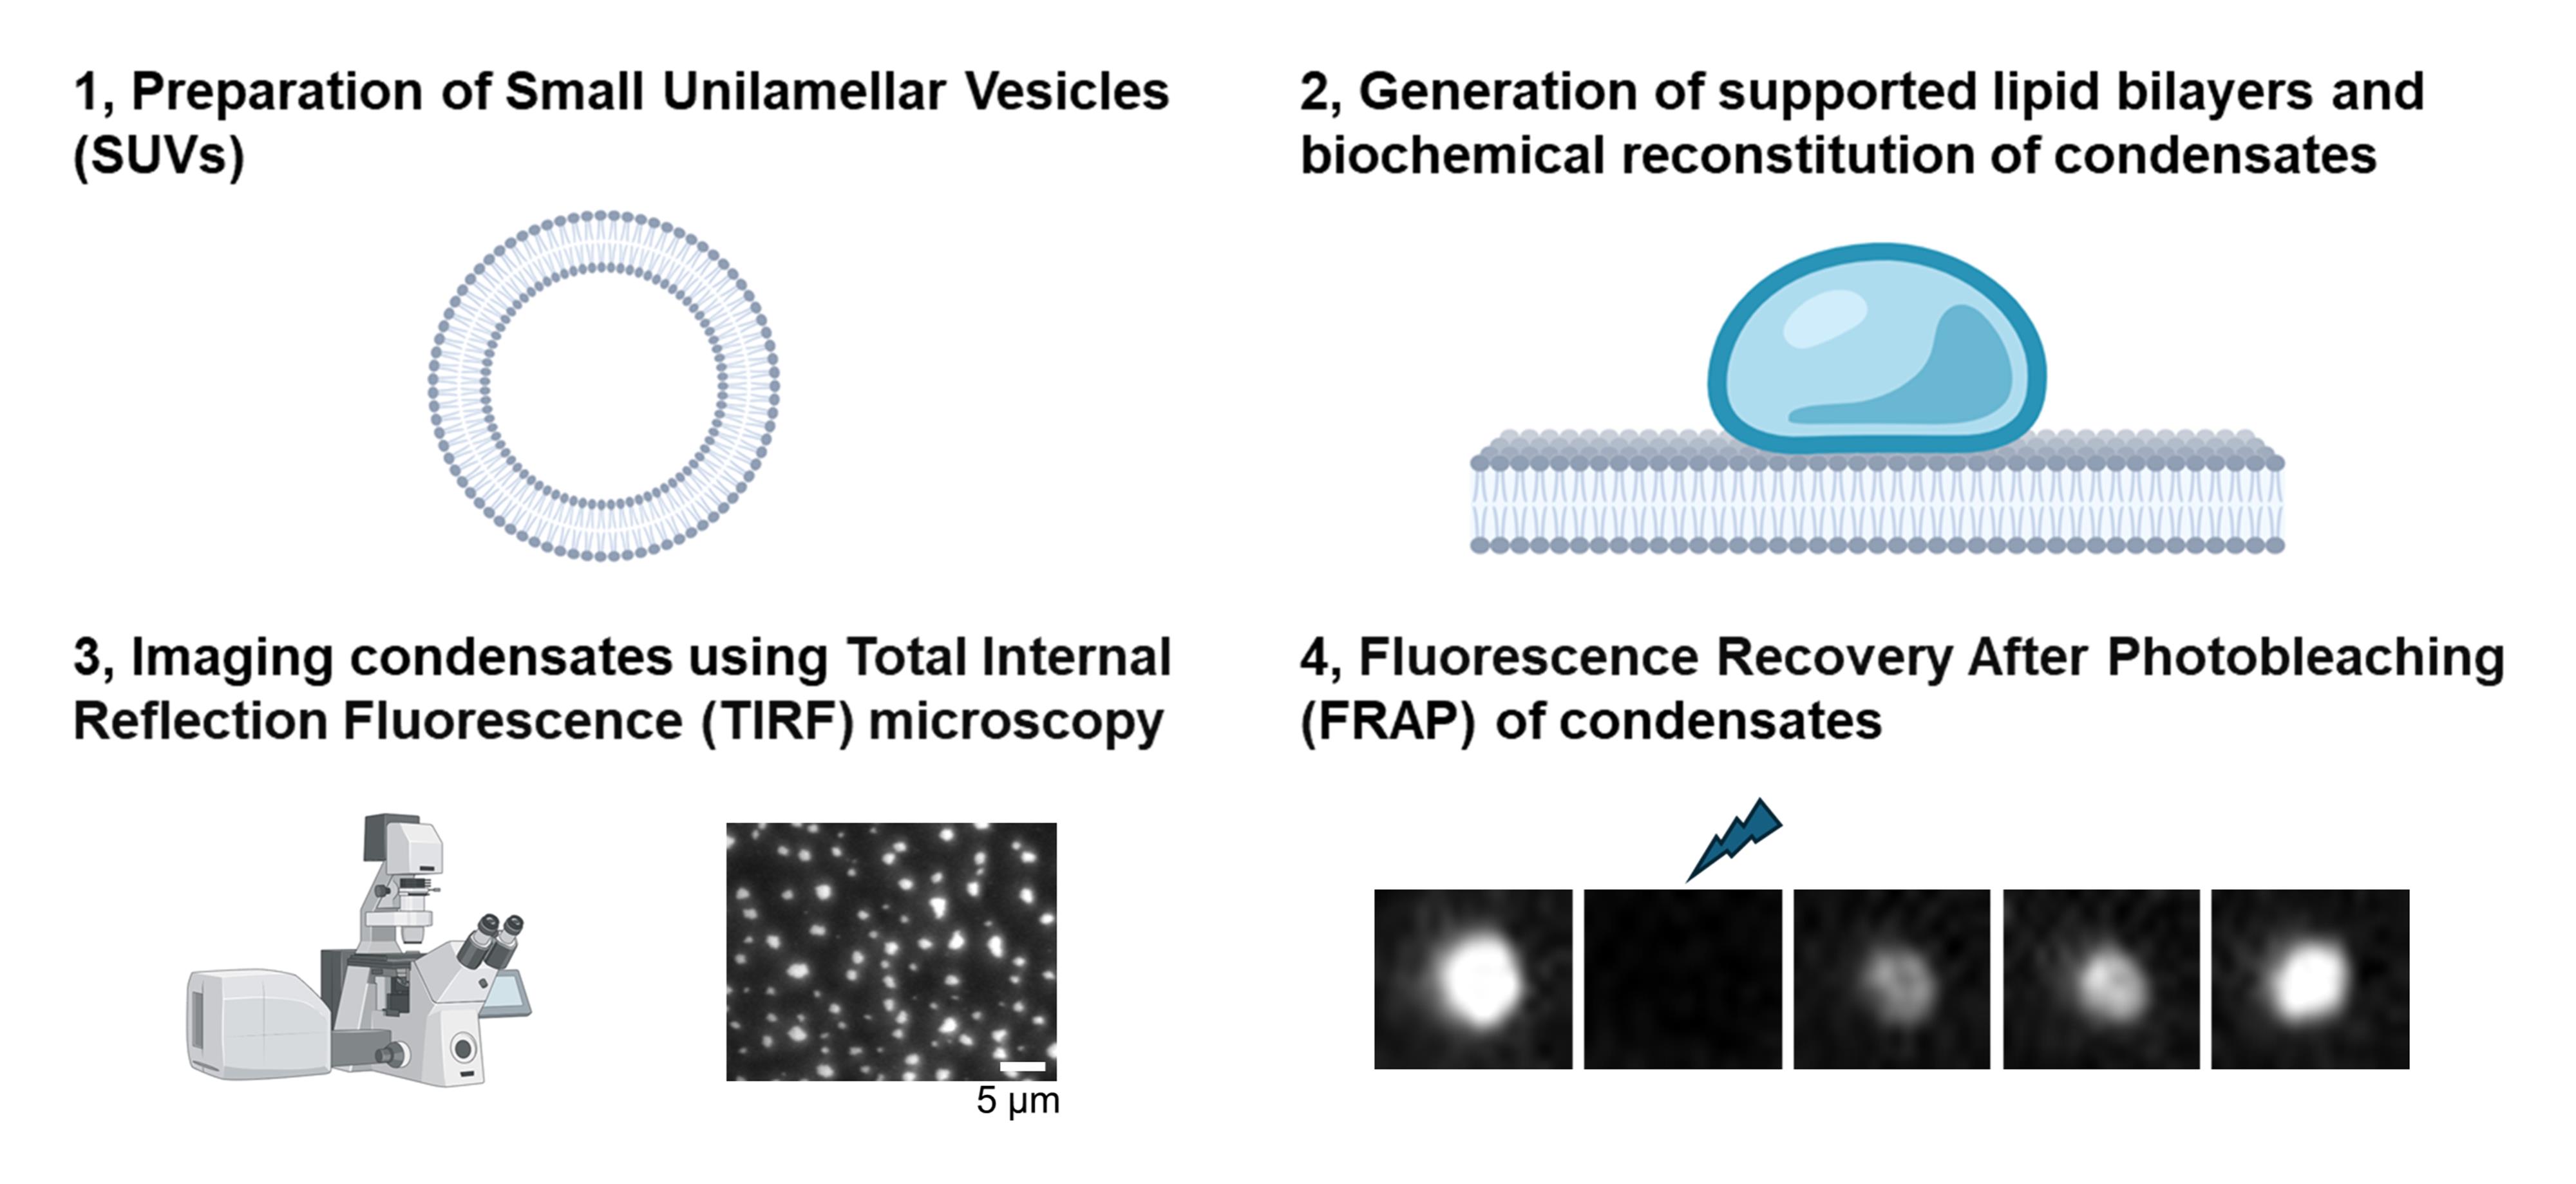
Plasma membrane–associated condensates driven by liquid–liquid phase separation represent a novel mechanism of receptor-mediated signaling transduction, serving as mesoscale platforms that concentrate signaling molecules and modulate reaction kinetics. Condensate formation is a highly dynamic process that occurs within seconds to minutes following receptor activation. Here, we present methods for de novo reconstituting liquid-like condensates on supported lipid bilayers and assessing the condensate fluidity using fluorescence recovery after photobleaching (FRAP). This protocol encompasses supported lipid bilayer preparation, condensation imaging, and FRAP analysis using total internal reflection fluorescence (TIRF) microscopy. Supported lipid bilayers provide a membrane-mimicking environment for receptor signaling cascades, offering mechanistic insights into protein–protein and lipid–protein interactions amid micron-scale condensates. The protocol can also be adapted to study condensates associated with the internal membranes of the Golgi apparatus, mitochondria, and other organelles.
Key features
• Real-time imaging of condensate formation and FRAP analysis using TIRF microscopy reveals a spatiotemporal profile of signaling transduction.
• Supported lipid bilayers provide a fluidic membrane environment that is critical for the biochemical reconstitution of condensates at physiological protein concentrations.
• The lipid and protein components within the reconstituted condensate system can be readily manipulated to accommodate specific experimental objectives and assay designs.
Keywords: Receptor signaling (受体信号传导)Graphical overview
Background
Signal transduction at the plasma membrane requires precise spatial and temporal organization of receptor-associated signaling molecules to elicit appropriate cellular responses upon stimulation. Recent efforts have uncovered that membrane-associated biomolecular condensates driven by liquid–liquid phase separation (LLPS) serve as organizing hubs for dynamic signaling assemblies in pathways including T-cell receptor (TCR), B-cell receptor (BCR), and epidermal growth factor receptor (EGFR) [1–3]. Beyond the plasma membrane, condensates also form on intracellular membranes such as the Golgi apparatus, endosomes, and mitochondria [4]. Elucidating the mechanisms governing biomolecular condensate formation and regulation provides crucial insight into normal cellular processes and pathological states such as tumorigenesis [5] and unveils potential targets for therapeutic intervention [6,7].
In the context of TCR signaling, the transmembrane adaptor protein LAT (Linker for Activation of T cells) is the key to drive membrane-associated condensate formation [1]. Upon receptor engagement, the intracellular intrinsically disorder region (IDR) of LAT is phosphorylated by ZAP-70, generating multiple phosphotyrosine (pY) motifs that recruit SH2 domain–containing proteins such as Grb2 and PLCγ1. We implemented a biochemical reconstruction system and fluorescence recovery after photobleaching (FRAP) analysis to identify two types of multivalent interactions—the pY-SH2 pair between LAT and Grb2 and the SH3-Proline rich motif pair between Grb2 and Sos1—that form LAT condensates with a liquid-like property [8]. We further discovered that PLCγ1 drives LAT cluster formation and nonmonotonically regulates the condensate sizes at physiological TCR signaling [9]. Interestingly, PLCγ1 is frequently mutated in adult T-cell leukemia/lymphoma, cutaneous T-cell lymphoma, and peripheral T-cell lymphoma. We found that leukemia/lymphoma-associated PLCγ1 mutations drive abnormal LAT condensation compared to the wild type [10]. These discoveries illustrated the power of biochemical reconstitution in revealing molecular mechanisms underlying both physiological and pathological states.
Membrane-associated condensates are frequently characterized in a reconstituted system. Their liquidity is assessed by FRAP, fusion, and wetting [1,8,10]. Here, we provide detailed, step-by-step methods for the biochemical reconstitution and quantification of membrane-associated condensates. Because FRAP serves as the most common method to assess condensation, we also provide a protocol for FRAP analysis.
Materials and reagents
Biological materials
1. Recombinant proteins: LAT [1], Grb2 [1], Sos1 [1], and PLCγ1 [11] (generated in-lab)
2. Glucose oxidase (Sigma, catalog number: G7141-50KU)
3. Glucose (Sigma, catalog number: 158968-5KG)
4. Catalase (Sigma, catalog number: C9322-5G)
Reagents
1. 10× PBS buffer (Gibco, catalog number: 70011-044)
2. Milli-Q ultrapure water (generated in-lab)
3. NaOH (Macron, catalog number: 7708-10)
4. 1 M HEPES buffer, pH 7.4 (Gibco, catalog number: 15630-080)
5. 5 M NaCl (Sigma, catalog number: S5150-1L)
6. TCEP (Sigma, catalog number: C4706-10G)
7. BSA (Sigma, catalog number: A9647-100G)
8. Lipids: 10 mg/mL POPC (Avanti, catalog number: 850457C)
9. Lipids: 1 mg/mL PEG5000 PE (Avanti, catalog number: 880230C)
10. Lipids: 1 mg/mL DOGS-NTA (Avanti, catalog number: 790404C)
11. Chloroform (Electron Microscopy Sciences, catalog number: 12550)
12. Immersion oil type F 30cc (Nikon, catalog number: MXA22168)
13. β-mercaptoethanol (Sigma, catalog number: M6250-100ML)
14. Hellmanex III (Sigma, catalog number: Z805939)
Solutions
1. 1× PBS buffer (see Recipes)
2. 5 M NaOH buffer (see Recipes)
3. Basic buffer (see Recipes)
4. Clustering buffer (see Recipes)
5. Lipid mixture (see Recipes)
Recipes
1. 1× PBS buffer
| Reagent | Final concentration | Quantity or volume |
|---|---|---|
| 10× PBS | 10% | 100 mL |
| Ultrapure water | 90% | 900 mL |
| Total | 100% | 1,000 mL |
2. 5 M NaOH buffer
| Reagent | Final concentration | Quantity or volume |
|---|---|---|
| NaOH | 5 M | 4 g |
| Ultrapure water | 20 mL |
3. Basic buffer
| Reagent | Final concentration | Quantity or volume |
|---|---|---|
| 1 M HEPES, pH 7.4 | 50 mM | 2.5 mL |
| 5 M NaCl | 150 mM | 1.5 mL |
| 0.5 M TCEP | 1 mM | 0.1 mL |
| Ultrapure water | 45.9 mL | |
| Total | 50 mL |
4. Clustering buffer
| Reagent | Final concentration | Quantity or volume |
|---|---|---|
| 1 M HEPES, pH 7.4 | 50 mM | 2.5 mL |
| 5 M NaCl | 150 mM | 1.5 mL |
| 0.5 M TCEP | 1 mM | 0.1 mL |
| BSA | 1 mg/mL | 0.5 mg |
| Ultrapure water | 45.9 mL | |
| Total | 50 mL |
5. Lipid mixture
| Reagent | Final concentration | Quantity or volume |
|---|---|---|
| 10 mg/mL POPC | 97.9% | 0.3 mL |
| 1 mg/mL DOGS-NTA | 2% | 0.06 mL |
| 1 mg/mL PEG5000 PE | 0.1% | 0.015 mL |
| Chloroform | 0.2–0.5 mL |
Laboratory supplies
1. 96-well glass-bottom plate (Matrical Inc, catalog number: MGB096-1-2-LG-L)
2. Glass vials (National Scientific, catalog number: B7800-2)
3. Adhesive PCR plate foils (Thermo Fisher, catalog number: AB-0626)
4. 25 μL gastight syringe (Hamilton, catalog number: 80275)
5. 250 μL gastight syringe (Hamilton, catalog number: 81175)
6. 1.7 mL Eppendorf tubes (Posi-click, catalog number: 1149K01)
7. 15 mL tubes (Cell Treat, catalog number: 229411)
8. 50 mL tubes (Cell Treat, catalog number: 229421)
9. 10 μL pipette tips (Thomas Scientific, catalog number: 1158U34)
10. 200 μL pipette tips (Thomas Scientific, catalog number: 1159M40)
11. 1,250 μL pipette tips (Thomas Scientific, catalog number: 1159M42)
12. Razor blade (VWR International, catalog number: 55411-050)
13. Polycarbonate high ultracentrifuge tubes (Beckman Coulter, catalog number: 343775)
Equipment
1. Heater (Thermo Scientific, catalog number: HP88857100)
2. Water bath (Thermo Scientific, catalog number: 51221073)
3. 37 °C incubator (Thermo Scientific, catalog number: 51028121)
4. Optima Max-Xp benchtop ultracentrifuge (Beckman Coulter, catalog number: JAA187324)
5. -80 °C freezer (Thermo Scientific, catalog number: 3282232101)
6. TIRF microscope with FRAP laser (Nikon Ti2-E inverted motorized microscope stand) equipped with Oko Lab temperature control system set at 37 °C and a stage adaptor for 96-well glass-bottom imaging plate (ASI imaging, catalog number: I-3020); the microscope was equipped with a 4-channel monolithic laser combiner (Agilent Technologies, catalog number: MLC 400B)
Software and datasets
1. ImageJ software (NIH, https://imagej.net/Downloads)
2. GraphPad Prism 10 software (GraphPad Software, Inc., https://www.graphpad.com)
3. Excel (Microsoft, https://www.microsoft.com/en-us/microsoft-365/excel)
Procedure
文章信息
稿件历史记录
提交日期: Nov 19, 2025
接收日期: Dec 28, 2025
在线发布日期: Jan 13, 2026
出版日期: Feb 5, 2026
版权信息
© 2026 The Author(s); This is an open access article under the CC BY-NC license (https://creativecommons.org/licenses/by-nc/4.0/).
如何引用
Zeng, L. and Su, X. (2026). Biochemical Reconstitution and FRAP Analysis of Membrane-Associated Condensates on Supported Lipid Bilayers. Bio-protocol 16(3): e5592. DOI: 10.21769/BioProtoc.5592.
分类
生物化学 > 蛋白质 > 自组装
生物物理学 > 生物工程 > 医用生物材料
细胞生物学 > 细胞成像 > 活细胞成像
您对这篇实验方法有问题吗?
在此处发布您的问题,我们将邀请本文作者来回答。同时,我们会将您的问题发布到Bio-protocol Exchange,以便寻求社区成员的帮助。