

Using combined fluorescent in situ hybridization with Immunohistochemistry to co-localize mRNA in diverse neuronal cell types
发布: 2026年05月05日第16卷第9期 DOI: 10.21769/BioProtoc.5591 浏览次数: 65
评审: Sanjay Kumar KureelAnonymous reviewer(s)


Abstract
Understanding gene expression within defined neuronal populations is essential for dissecting the cellular and molecular diversity of the brain. mRNA assays provide a direct readout of gene expression, capturing transcriptional changes that may precede or occur independently of protein abundance, whereas protein assays reflect the cumulative effects of translation, modification, and degradation. Moreover, in histological analysis, immunohistochemical protein detection results in visually diffuse labeling, which makes it difficult to quantitatively assess levels and locations of expression at high resolution. Here, we present a protocol that allows for mRNA detection in single neuronal cell types with a high degree of sensitivity and anatomical resolution. This protocol combines fluorescent in situ hybridization (FISH) with immunohistochemistry (IHC) on the same tissue section. Briefly, FISH is carried out by ACDBio RNAscope® fluorescent in situ hybridization technology, which involves processing the tissue sections, followed by signal amplification. This involves target retrieval, probe hybridization, and signal enhancement. Then, the tissue section is processed for IHC, which involves blocking nonspecific sites and incubation with primary antibodies, followed by development of a fluorescent signal with secondary antibodies. Typically, visual mRNA detection with FISH can be seen as individual puncta, whereas targeting the protein with an antibody results in filled cells or processes. The variation in staining pattern allows for the quantification of distinct mRNA transcripts within different neuronal populations, which renders co-localization analyses easy and efficient.
Key features
• This protocol combines ACDBio RNAscopeTM technology with standard immunohistochemistry techniques.
• Visual simultaneous detection of mRNA and protein expression within murine brain tissue to identify mRNA transcripts within specific neuronal subpopulations.
• Using a custom macro code for FIJI/ImageJ for an efficient analysis of total mRNA expression or mRNA co-localization with neuronal subtypes.
• This protocol can be used to detect any mRNA and protein combination given appropriate antigen retrieval and tissue preparation within any tissue type of interest.
Keywords: mRNAGraphical overview
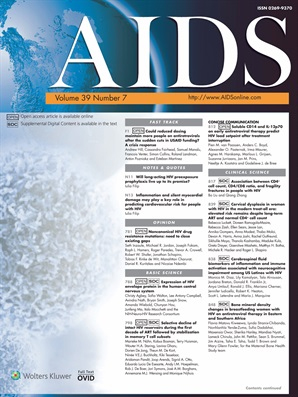
Overview of sequential in situ hybridization and immunohistochemistry (IHC) workflow. The workflow for sequential fluorescent in situ hybridization (FISH) with IHC staining begins with adequate fixation and slicing of tissue (1), followed by a procedure developed with ACD Bio’s RNAscopeTM technology (2), and ends with a standard IHC protocol performed on the same tissue (3). Finally, slides are imaged and quantified for co-localization of mRNA within the cell population of interest (not shown).
Background
In situ hybridization (ISH) is a technique utilized in histological analyses that involves using antisense nucleic acid probes containing complementary bases to the target mRNA for the detection of mRNA transcripts [1]. Historically, ISH has utilized radioactive probes (using sulfur 35 as a radioisotope) to target mRNA molecules within a cell population in tissue sections [2]. Non-radioactive methods were also developed by utilizing digoxigenin RNA probes [3]. However, these methods, while allowing for the detection of a single species of mRNA, are not suited to simultaneously visualize protein and RNA species in individual cells. More recently, fluorescent probes were developed to allow for the analysis of multiple mRNA species using a distinct fluorophore. This technique is similar to immunohistochemistry (IHC), which involves the utilization of antibodies that recognize specific epitopes on proteins, thus allowing for the detection and visualization of these proteins within a certain cell [4]. Both techniques have their limitations and advantages. ISH allows for temporal and spatial analysis of gene transcription within a given cell and can be visualized as individual puncta, although more advanced methods exist that can provide comprehensive information about mRNA translation within a given cell population or tissue (RNA sequencing). IHC is a common, robust method to visualize proteins, reflecting the cumulative results of translation. Although there is no temporal resolution, it is a useful method for analyzing cell quantities, cell morphology, and cell subtype identification within tissues. However, IHC analysis can be subjective and difficult to replicate. When utilizing ISH and IHC together, it allows for simultaneous measurements of transcription and translation, allowing for the identification of the same or different markers. In addition, the visual properties of each method complement each other, such that IHC immunoreactivity results in diffuse labeling throughout the cell or cell processes in the case of a neuron, while ISH labeling results in puncta-like positivity. The combination of ISH and IHC allows for straightforward co-localization of mRNA transcripts within a cell subtype. This is particularly important because neurons can be identified and classified based on their protein expression.
Within the central nervous system (CNS), there is a large diversity of neuronal subtypes, including excitatory and inhibitory interneurons, specialized neurons containing neuropeptides, and non-neuronal cells such as astrocytes, microglia, and oligodendrocytes. While region-level analyses provide valuable information about overall gene expression, deeper insight can be gained by studying changes at the level of specific neuronal subtypes due to diseases or CNS activity. This is particularly important as transcript distribution can differ dramatically between neighboring cells and drive unique physiological roles [5]. Since each subtype contributes in distinct ways to network dynamics, analyzing cell type–specific processes provides a more accurate link between molecular regulation, circuit activity, and, ultimately, behavior, yielding a clearer understanding of the target under study. Neuronal subtypes can be easily identified by proteins that are uniquely expressed in the subpopulation. For example, tyrosine hydroxylase can be used to label neurons that produce catecholamines (i.e., dopamine and norepinephrine) because it is an enzyme involved in the synthesis of these neurotransmitters. Additional neurotransmitters can be detected by other unique proteins. Examples include parvalbumin, which is expressed in GABAergic interneurons, tryptophan hydroxylase, which denotes serotonergic neurons, and vesicular glutamate transporter, which is highly expressed in glutamate neurons.
The protocol detailed below has been optimized to detect and quantify GPR75 mRNA within the mouse brain. GPR75 is an orphan G-protein-coupled receptor (Gαq subtype), highly expressed within the brain as compared to the periphery [6]. Recent works have suggested GPR75 to have a large role in the regulation of metabolism [7]. This protocol was developed to further the understanding of GPR75 expression patterns in an effort to elucidate the function of this orphan receptor. This was achieved by combining ISH and IHC to co-localize GPR75 mRNA within different neuronal subtypes using several key neuronal markers. The examples provided within this protocol are not representative of all neuronal subtypes; see Table 1 for more examples of antibodies that can be used with IHC to detect different neuronal subtypes, as well as other brain cell types, such as microglia and astrocytes.
This method of combining ISH with IHC within the same tissue is not uncommon in the field of neuroscience. Moreover, many researchers may use this system to analyze the localization of mRNA differences with protein expression of the same marker [8]. Research using this method has been published [9–11]. However, there is no clear protocol outlining the steps involved for analysis and preparation. Such a protocol, if similarly utilized by researchers, will provide a better avenue to share discoveries.
Materials and reagents
Biological materials
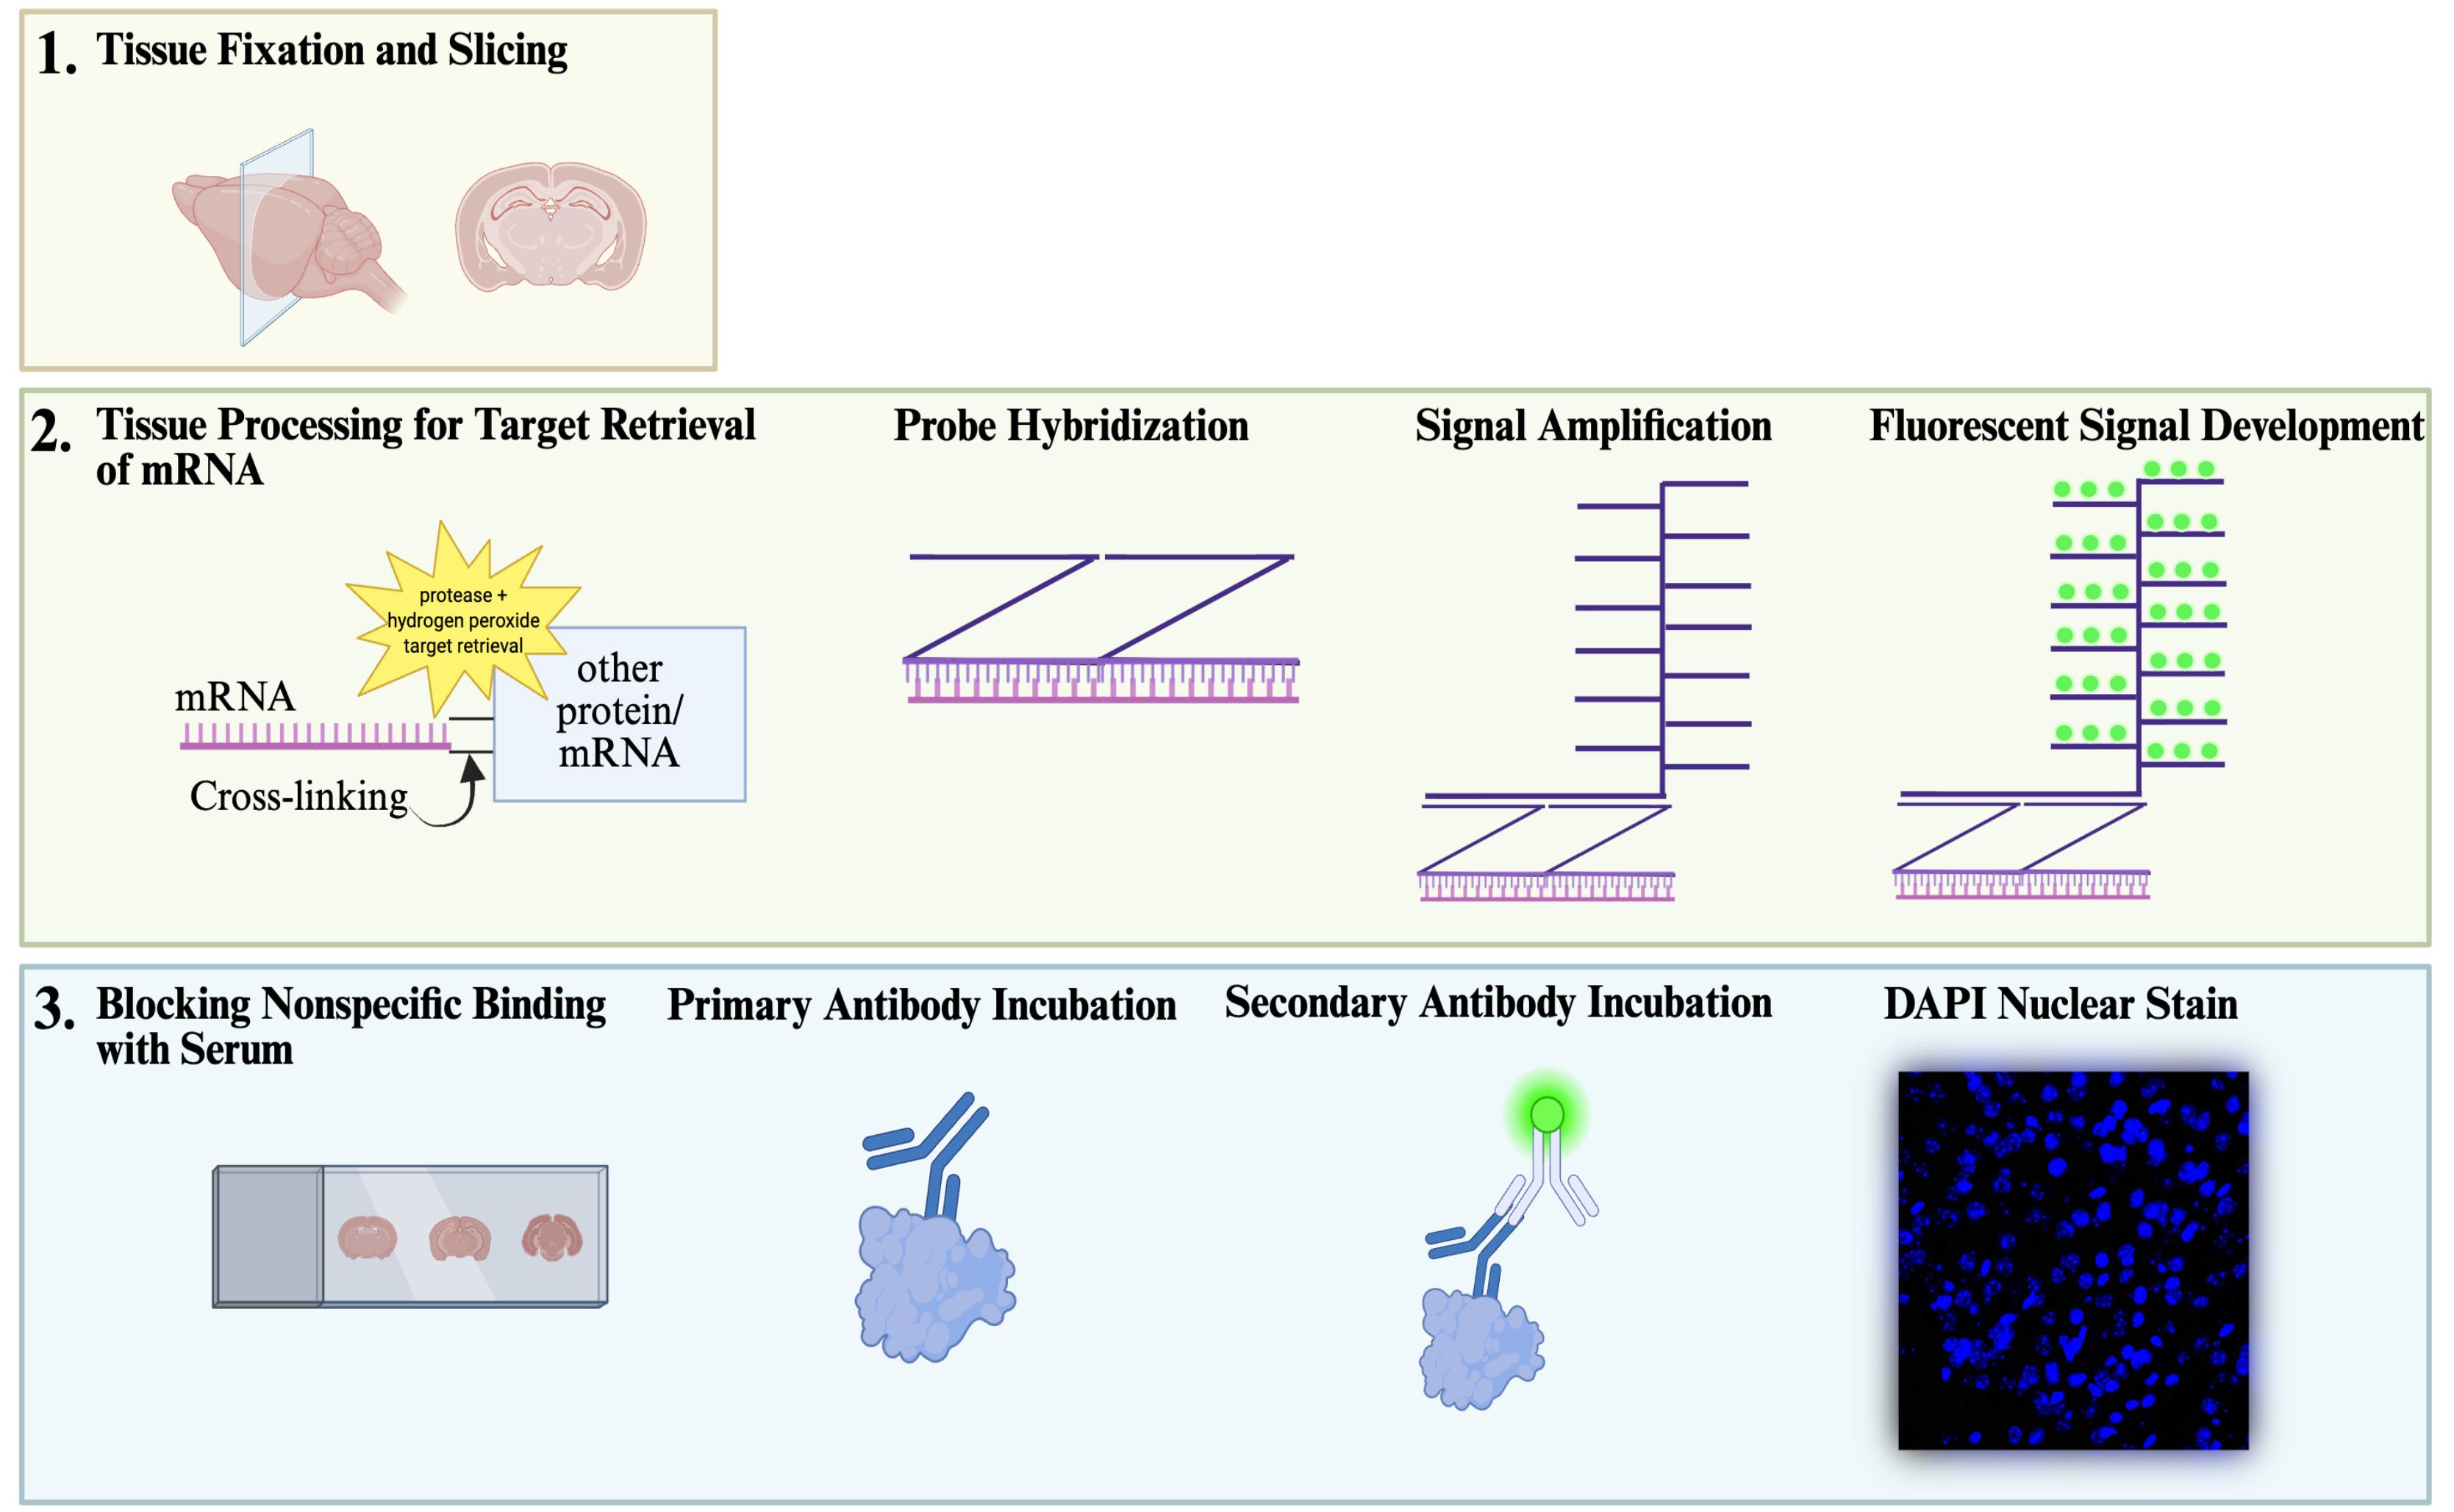
1. Microtome or cryostat frozen brain sections, slide-mounted (Figure 1A)
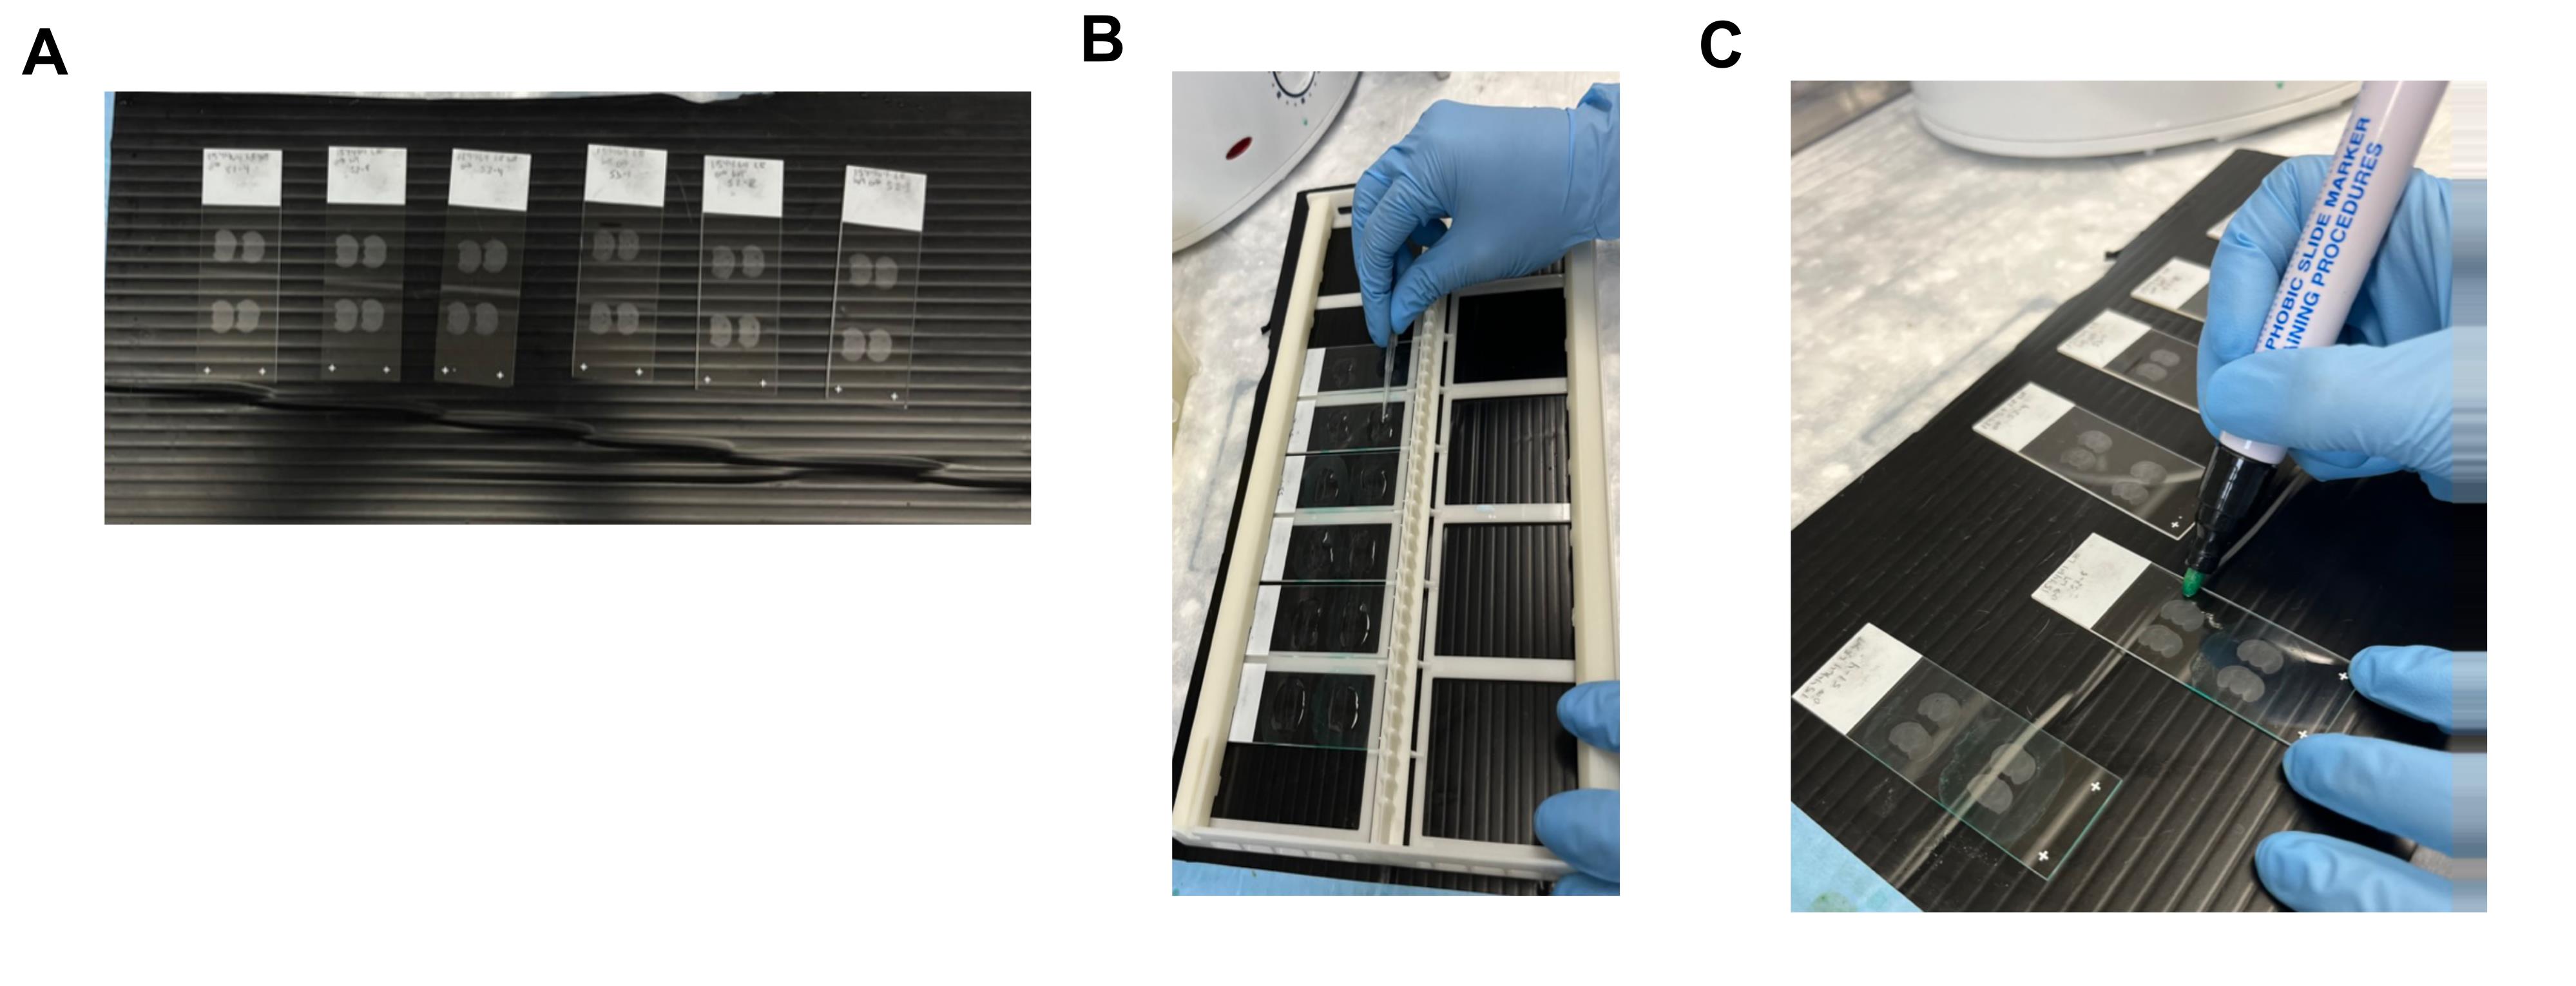
Figure 1. Technical considerations for slide preparation and tissue pretreatment. (A) Example of how the tissue can be organized onto individual slides after slicing on the cryostat or microtome. This is also an example of when the slides need to be laid down flat; it is helpful to have a dark material to contrast the tissue for easier visualization. (B) Visual representation of the technique used to spread the solution over the tissue on the slide with the flat side of a pipette tip. This must be done carefully without touching the tissue under the solution. (C) Visual representation of tissue outlining with the wax pen. The outline must be close enough to the tissue to ensure proper coverage with small volumes, while also maintaining an adequate distance from the tissue to avoid wax contamination, which will weaken the signal.
Reagents
1. 200 proof ethyl alcohol (Warner-Graham Company, catalog number: 64-17-05)
2. RNAscopeTM target probe (Bio-Techne, catalog or made-to-order C1 to C3 probes)
3. RNAscopeTM Multiplex Fluorescent Detection kit v2 (Bio-Techne, catalog number: 323110)
4. RNAscopeTM target retrieval (10×) (Bio-Techne, catalog number: 322001)
5. RNAscopeTM TSA buffer pack (Bio-Techne, catalog number: 322810)
6. RNAscopeTM wash buffer (50×) (Bio-Techne, catalog number: 310058)
7. 20× SSC buffer RNase-free (Invitrogen, catalog number: AM9763)
8. RNAscopeTM H2O2 and protease reagents (Bio-Techne, catalog number: 322381)
9. Opal 520 reagent pack (Akoya Biosciences, catalog number: FP1487001KT)
10. Opal 570 reagent pack (Akoya Biosciences, catalog number: FP1488001KT)
11. Opal 620 reagent pack (Akoya Biosciences, catalog number: FP1495001KT)
12. Bovine serum albumin, heat shock-treated (Fisher Scientific, catalog number: BP1600-100)
13. Triton-X 100 (Sigma-Aldrich, catalog number: 9036-19-5)
14. Primary antibody (depends on the target)
15. Fluorescent secondary Antibody (depends on primary antibody species and fluorescence of choice)
16. Fluoro-Gel (with tris buffer) (Electron Microscopy Services, catalog number: 17985-10)
17. Hydrophobic slide marker (Newcomer Supply, catalog number: NC9827128)
18. Phosphate-buffered saline (PBS), 10× solution (Fisher Scientific, catalog number: BP39920)
19. Paraformaldehyde (PFA), 20% w/v aqueous solution, methanol-free (Thermo Fisher, catalog number: 047340.9M)
Solutions
1. 1× target retrieval solution (see Recipes)
2. 5× SSC buffer (see Recipes)
3. 1× wash buffer (see Recipes)
4. 1× PBS (see Recipes)
5. Blocking/permeabilizing solution (see Recipes)
6. EtOH 50%, 70%, 100% (see Recipes)
7. 4% PFA (see recipes)
Recipes
1. Target retrieval solution
| Reagent | Final concentration | Volume (for 250 mL) |
|---|---|---|
| RNAscopeTM Target retrieval (10×) | 1× | 25 mL |
| Deionized water (diH2O) | n/a | 225 mL |
2. 5× SSC buffer
| Reagent | Final concentration | Volume (for 250 mL) |
|---|---|---|
| 20× SSC buffer | 5× | 62.5 mL |
| diH2O | n/a | 187.5 mL |
3. Wash buffer
| Reagent | Final concentration | Volume (for 1 L) |
|---|---|---|
| RNAscopeTM wash buffer (50×) | 1× | 20 mL |
| diH2O | n/a | 0.98 L |
4. 1× PBS
| Reagent | Final concentration | Volume (for 1 L) |
|---|---|---|
| 10× PBS | 1× | 100 mL |
| diH2O | n/a | 900 mL |
5. Blocking/permeabilizing solution
| Reagent | Final concentration | Volume (for 50 mL) |
|---|---|---|
| Bovine serum albumin | 5% of total volume | 2.50 g |
| Triton-X | 0.1% of total volume | 50 μL |
| 1× PBS | n/a | 50 mL |
6. EtOH 50%, 70%, 100%
| Reagent | Final concentration | Volume (for 250 mL) |
|---|---|---|
| 200 proof ethanol | 50% EtOH | 125 mL EtOH +125 mL diH2O |
| 70% EtOH | 175 mL EtOH + 75 mL diH2O | |
| 100% EtOH | 250 mL EtOH |
7. 4% PFA
| Reagent | Final concentration | Volume (for 50 mL) |
|---|---|---|
| PFA 20% w/v aqueous solution | 4% PFA | 10 mL |
| 1× PBS | 40 mL |
Laboratory supplies
1. Slide staining station dish with lid (Mediscus Health, catalog number: 2935M14)
2. Slide staining plastic dipper with handle (Mediscus Health, catalog number: 2935M6)
3. Slide moisture chamber (Newcomer Supply, catalog number: NC9062083)
4. Superfrost PlusTM microscope slides white tab (Fisherbrand, catalog number: 1255015)
5. Rectangle cover glass No. 1 1/2 (Corning, catalog number: 2940-245)
Equipment
1. Slide warmer (C&A Scientific Company, catalog number: NC14-008)
2. ACD HybEZTM II hybridization system (Bio-Techne, catalog number: 321711)
3. ACD EZ-batch slide system (Bio-techne, catalog number: 310007)
4. Rice cooker/steamer (any)
5. Easy-Read® thermometer (Sigma-Aldrich, catalog number: Z423459)
Software and datasets
1. FIJI/ImageJ (ImageJ2, Version: 2.16.0/1.54p)
2. ImageJ source (https://imagej.net/ij/macros/download.html)
3. All code has been deposited to GitHub: https://github.com/mkb142-art/Image-J-Macro-code-for-analyzing-mRNA-and-IHC-co-localization (accessed 10/06/2025)
Procedure
文章信息
稿件历史记录
提交日期: Oct 6, 2025
接收日期: Dec 23, 2025
在线发布日期: Jan 8, 2026
出版日期: May 5, 2026
版权信息
© 2026 The Author(s); This is an open access article under the CC BY-NC license (https://creativecommons.org/licenses/by-nc/4.0/).
如何引用
Becher, M. K., Wilson, K. and Mocchetti, I. (2026). Using combined fluorescent in situ hybridization with Immunohistochemistry to co-localize mRNA in diverse neuronal cell types. Bio-protocol 16(9): e5591. DOI: 10.21769/BioProtoc.5591.
您对这篇实验方法有问题吗?
在此处发布您的问题,我们将邀请本文作者来回答。同时,我们会将您的问题发布到Bio-protocol Exchange,以便寻求社区成员的帮助。