
- Protocols

- About
-


Ferric reducing antioxidant potential (FRAP) assay

Last updated date: Nov 6, 2026 Views: 16 Forks: 0

 Download PDF
 Ask a
question

 How to
cite

 Favorite


Protein hydrolysates derived from residual after polysaccharide extraction of Chlorella vulgaris biomass improves yield and quality of baby leaf lettuce
Annamaria Di Serio1#, Giovanna Aquino2,3#, Francesco del Prete2, Francesca Sansone2,5, Emanuela Salviati2, Manuela Giovanna Basilicata3, Michele Manfra4, Pietro Campiglia2, Domenico Ronga2,* and Giacomo Pepe2
1 Chemistry and Biology Department, University of Salerno, Via Giovanni Paolo II 132, Fisciano, 84084, Italy. adiserio@unisa.it
2 Department of Pharmacy, University of Salerno, Via G. Paolo II, Fisciano, 84084 Salerno, Italy. gaquino@unisa.it; fdelprete@unisa.it; fsansone@unisa.it; esalviati@unisa.it; pcampiglia@unisa.it; gipepe@unisa.it.
3 Department of Advanced Medical and Surgical Sciences, University of Campania “Luigi Vanvitelli”, Naples, Italy; manuelagiovanna.basilicata@unicampania.it
4 Department Health Science, University of Basilicata, Viale dell’Ateneo Lucano 10, 85100 Potenza, Italy; michele.manfra@unibas.it
5 UNESCO Chair “Plants for Health in the Mediterranean Traditions”, University of Salerno, Via G. Paolo II, Fisciano, 84084 Salerno, Italy
# These authors are co-first authors
* Correspondence: dronga@unisa.it
https://doi.org/10.1038/s41598-025-15748-5
1. Abstract
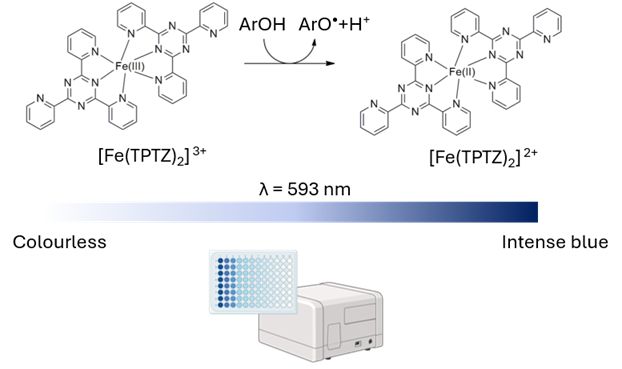
The Ferric Reducing Antioxidant Power (FRAP) assay is a rapid, robust, and highly reproducible spectrophotometric method widely employed to assess the total antioxidant capacity (electron-donating ability) of biological samples, including plant and marine algae extracts. This protocol describes an adapted microplate-based FRAP assay optimized for high-throughput analysis. Under acidic conditions (pH 3.6), antioxidant compounds present in the extract reduce the ferric-tripyridyltriazine complex ([Fe(III)-(TPTZ)₂]³⁺) to its intense blue ferrous form ([Fe(II)-(TPTZ)₂]²⁺), which exhibits maximum light absorbance at 593 nm. This step-by-step document details standard operating procedures, reagent stoichiometry, microplate layout, and quantitative data analysis expressed as Fe(II) equivalents per dry weight.
2. Graphical Overview
3. Background
Antioxidants play a crucial role in neutralizing reactive oxygen species (ROS) and mitigating oxidative stress. Evaluating the antioxidant potential of natural extracts, such as marine algae, requires reliable, quantitative methods. The FRAP assay measures total electron-donating capability. Unlike radical scavenging assays (e.g., DPPH or ABTS), FRAP relies entirely on a single electron transfer (SET) redox reaction. In acidic solution, non-colored ferric complexes are reduced to blue ferrous-tripyridyltriazine complexes. Operating at pH 3.6 maintains iron solubility and suppresses non-specific side reactions, providing a direct measurement of total reducing capacity.
4. Materials and Reagents
4.1 Biological Materials
Plant extracts stored at -20 °C until analysis.
4.2 Reagents
Acetate buffer solution pH 4.6 (1 M) (Sodium acetate/acetic acid, CAS: 127-09-3)
2,4,6-Tris(2-pyridyl)-s-triazine (TPTZ) (MW: 312.33 g/mol, CAS: 3682-35-7)
Iron(III) chloride (FeCl₃) (MW: 162.20 g/mol, CAS: 7705-08-0)
Iron(II) sulfate heptahydrate (FeSO₄·7H₂O) (MW: 278.01 g/mol, CAS: 7782-63-0)
4.3 Solutions
Ultrapure Water (Milli-Q water, resistivity ≥ 18.2 MΩ·cm).
4.4 Recipes
Reagent A — 300 mM Acetate Buffer (pH 3.6): Dilute commercial 1 M acetate buffer solution (pH 3.6) with ultrapure H₂O to achieve a 300 mM concentration (e.g., 30 mL of 1 M buffer diluted to 100 mL total volume). If necessary, adjust pH down to 3.6 by adding glacial acetic acid dropwise under constant magnetic stirring and pH monitoring.
Reagent B — 10 mM TPTZ in 40 mM HCl: First, prepare 40 mM HCl by mixing 4 mL of 1 N HCl with 96 mL of ultrapure H₂O. Then, weigh 0.312 g of TPTZ (MW 312.33 g/mol) and dissolve completely in 100 mL of the prepared 40 mM HCl.
Reagent C — 20 mM FeCl₃ in H₂O: Weigh 0.081 g (81 mg) of anhydrous FeCl₃ (MW 162.20 g/mol) and dissolve completely in 25 mL of ultrapure H₂O.
Working FRAP Reagent (10:1:1 v/v/v): Mix Reagents A, B, and C in a 10:1:1 volumetric ratio (e.g., 25 mL Reagent A + 2.5 mL Reagent B + 2.5 mL Reagent C). Prepare fresh prior to use and incubate for 30 min at room temperature protected from light.
5. Equipment
Microplate Spectrophotometer / Reader: Capable of reading absorbance at λ = 593 nm with temperature control
96-Well Clear Microplates: Flat-bottom polystyrene microplates
Precision Pipettes & Multichannel Pipettes: Single-channel (0.5–10 µL, 20–200 µL) and 8-channel micropipettes
Analytical Balance: Precision ± 0.1 mg / ± 0.01 mg
pH Meter: Calibrated at pH 4.00, 7.00, and 10.00
Vortex Mixer & Magnetic Stirrer: Standard laboratory benchtop mixer
6. Procedure
6.1 Standard Curve Preparation (FeSO₄·7H₂O)
Prepare a 10 mM FeSO₄ stock solution by dissolving 1.39 mg of FeSO₄·7H₂O in 500 µL of ultrapure H₂O. Perform serial dilutions in ultrapure H₂O (range 0.05 – 10 mM) according to the scheme below:
Standard Concentration | Volume of H₂O | Volume of Previous Standard |
10 mM | — | Stock Solution (1.39 mg / 500 µL H₂O) |
5 mM | 500 µL | 500 µL of 10 mM standard |
2.5 mM | 500 µL | 500 µL of 5 mM standard |
1 mM | 600 µL | 400 µL of 2.5 mM standard |
0.5 mM | 500 µL | 500 µL of 1 mM standard |
0.25 mM | 500 µL | 500 µL of 0.5 mM standard |
0.1 mM | 600 µL | 400 µL of 0.25 mM standard |
0.05 mM | 500 µL | 500 µL of 0.1 mM standard |
0.025 mM | 500 µL | 500 µL of 0.05 mM standard |
6.2 Sample Preparation
Perform preliminary dilutions of the extract as necessary to ensure absorbance values fall within the linear range of the FeSO₄ calibration curve.
6.3 Microplate Reaction Procedure
Pipetting Samples & Standards: Add 5 µL of sample, standard, or blank (extraction solvent) into designated wells of a 96-well microplate in triplicate.
Adding FRAP Reagent: Add 145 µL of prepared Working FRAP Reagents (A:B:C 10:1:1) to each well using a multichannel pipette.
Incubation [Critical Step]: Agitate the microplate briefly (5 sec) and incubate for exactly 30 min at 37 °C in the dark.
Measurement: Measure absorbance at λ = 593 nm on a microplate spectrophotometer immediately after incubation.
7. Data Analysis
Blank Correction: Calculate net absorbance for all standards and samples by subtracting the mean absorbance of the solvent blank wells (Solvent + FRAP reagent).
Standard Curve Fitting: Plot net absorbance (y-axis) against FeSO₄ concentration (x-axis, mM). Perform linear regression analysis (y = mx + c) and verify that R² ≥ 0.999.
Quantification & Expression: Interpolate the net absorbance of sample extracts into the linear regression equation to derive the mM Fe(II) concentration. Express final results as Fe(II) equivalents per gram of dry extract weight (mM Fe(II)/g dw) using the formula below:
Fe(II) equivalents (mM Fe(II)/g dw) = mM Fe(II) × (mL extract / g extract) |
8. Validation of Protocol
This protocol has been validated for repeatability and linearity across a concentration range of 0.05–10 mM Fe(II). Intra-assay and inter-assay coefficients of variation (CV%) are typically below 5%. Technical triplicates should be performed for every sample and standard dilution.
9. General Notes and Troubleshooting
Critical (Light Protection): TPTZ and the working FRAP reagent are light-sensitive. Wrap container vessels in aluminum foil during preparation and incubation.
Critical (pH Adjustment): Ensure pH of Reagent A is exactly 3.6. Improper pH alters iron solubility and reaction kinetics.
Troubleshooting (Absorbance Out of Range): If sample absorbance exceeds standard curve range, dilute sample extract in extraction solvent and re-analyze.
- Serio, A D, Aquino, G and Ronga, D(2026). Ferric reducing antioxidant potential (FRAP) assay. Bio-protocol Preprint. bio-protocol.org/prep3025.
- Serio, A. D., Aquino, G., Prete, F. D., Sansone, F., Salviati, E., Basilicata, M. G., Manfra, M., Campiglia, P., Ronga, D. and Pepe, G.(2025). Protein hydrolysates derived from residual after polysaccharide extraction of Chlorella vulgaris biomass improves yield and quality of baby leaf lettuce. Scientific Reports 15. DOI: 10.1038/s41598-025-15748-5
Do you have any questions about this protocol?
Post your question to gather feedback from the community. We will also invite the authors of this article to respond.
 Post a Question


